
Syngas
Abstract
In this chapter, various carbonous raw materials, from biomass to fossil fuels (ie, coal, crude oil, and natural gas) are evaluated for the production of syngas. Syngas refers either to the mixture of nitrogen and hydrogen, the kind of mixture needed for ammonia production, or carbon monoxide/hydrogen (CO:H2) mixtures, the building blocks for the production of methanol, hydrocarbons, synthetic gasoline and diesel, or ethanol. The operation and performance of gasification and reforming technologies, as well as gas processing units, are analyzed based on unit operation and reactor engineering approaches, including mass and energy balances. Once the syngas is obtained, reactor engineering and process modeling using gProms and EXCEL are used to evaluate the production of ammonia, methanol, or Fischer–Tropsch (FT) liquids, including the simulation of the performance of such reactors. Finally, several separation units are evaluated such as flash, using shortcut methods, as well as rigorous simulation, adsorption, absorption, and hydrocracking. Biomass hydrolysis processing technologies are left for Chapter 8, Biomass.
Keywords
Ammonia; methanol; hydrogen; haber–bosch; gas processing
5.1 Introduction
In this chapter, various carbonous raw materials, from biomass to fossil fuels (ie, coal, crude oil and natural gas) are evaluated for the production of syngas. Syngas refers either to the mixture of nitrogen and hydrogen, the kind of mixture needed for ammonia production, or carbon monoxide/hydrogen (CO:H2) mixtures, the building blocks for the production of methanol, hydrocarbons, synthetic gasoline and diesel, or ethanol. Chapter 8, Biomass, is devoted to biomass processing, therefore here the technologies will be discussed, but applied to processing fossil resources, leaving further discussion of biomass-based fuels and chemicals to that chapter. Fig. 5.1 shows the relative availability of fossil resources worldwide. Coal is the major resource, and only in the Middle East oil is widely available. The picture was prepared before the industrial exploitation of shale gas, which, as it will be discussed, has changed the map. In the following paragraphs, the reader will find a brief description of the raw materials (covered throughout this chapter) that can be used to obtain syngas.

http://www.worldcoal.org/bin/pdf/original_pdf_file/coal_matters_2_-_global_availability_of_coal(16_05_2012).pdf “Coal Matters—Global Availability of Coal” (2012) The World Coal Association, Copyright permission by the World Coal Association, London, UK.
5.1.1 Coal
Coal has been widely used by mankind. Its consumption has increased steadily over the last 40 years, surpassing 7500 million tons (www.iea.org). The reserves are located in a few regions. Around 23% (122,000 million tons oil equivalent) is in the United States, 15% in Russia, 13% in China, 9% in Australia, 7% in India, 5% in Germany, 4% in Ukraine and Kazakhstan each, and 3.5% in Serbia. The production and consumption by region follow the same trend. The cost has been rather stable since 2000 (around $60/t), but peaked in 2008 at $140/t (http://www.infomine.com).
5.1.2 Natural Gas
Natural gas (NG) is one of the cleanest fuels. Its typical composition consists of 70–90% methane; 0–20% ethane, propane, and butane; 0–8% carbon dioxide (CO2); 0–5% nitrogen; 0–5% hydrogen sulfide (H2S); 0–0.2% oxygen; and traces of noble gases. The major proven reserves are in Russia (42,000 million tons of oil equivalent), followed by Iran and Qatar with half the amount of the Russian reserves. Saudi Arabia, the United Arab Emirates, the United States, Nigeria, and Algeria with 4000–6000 million tons oil equivalent are next. However, the natural gas market has recently changed due to the development of technically feasible solutions for exploiting unconventional reservoirs using horizontal drilling combined with fracking for the release of so-called shale gas. Shale gas is nothing more than natural gas trapped in shale formations. The use of a high-pressure fluid with chemicals to push the gas out has created new opportunities. The major reserves of shale gas are located in the United States, Algeria, Canada, Mexico, China, and Argentina, with over 500 trillion cubic feet available. As a result, the current prices of natural gas have dropped to around $4/MMBTU (Henry Hub prices). There are two qualities: dry and wet shale gas. The wet type contains C2+ hydrocarbons in a certain proportion. It is more valuable since these chemicals are used in industry for the production of high-value products, including plastics.
5.1.3 Crude Oil
Crude oil is a mixture of hydrocarbons. The standard unit is the barrel, which is equal to 42 gal (1 gal=3.785 L). Fig. 5.2 shows the typical composition of a barrel. Petrol represents half of it, while diesel reaches around 25%. The major reserves of oil are located in the Middle East, representing 65% of the total worldwide (695,000 million barrels), with Saudi Arabia, Iraq, Kuwait, Iran, and the United Arab Emirates the most plentiful areas with 37.8%, 16.2%, 13.9%, 14.3%, and 14% shares, respectively. Venezuela with 76,000 million barrels, and Russia with 65,000 million barrels, are the main proven reserves on other continents. The price per barrel is quite volatile, and has varied from $90 in the 1980s down to $25 by 1997, increasing again to $100 by 2010. The EIA forecast covers a range from $60 to $200. By 2015 it was $30–$50 per barrel.

5.2 Stage I: Syngas Production
5.2.1 Hydrogen and H2:CO Mixture Production
Hydrogen, although one of the most abundant atoms, can only be found free in very small quantities in the atmosphere. It mostly appears in the form of water. It has two isotopes: deuterium (D) and tritium (T). Deuterium represents 0.015% of total hydrogen and is typically used for the production of heavy water (D2O) to control nuclear reactions. Tritium is radioactive with a semidecay period of 12.5 years. The H![]() H bonding is strong, 436 kJ/mol. H2 is slightly soluble in water, but reacts with most elements, generating hydrides with those less electronegative. Its small size allows its diffusion across steel. Furthermore, with carbon steel it generates methane, reducing the strength of the material. This quick diffusivity determines the design of the units that process it. With air it generates explosive mixtures; however, they result in a pressure decrease. The process generates implosions instead of explosions. It is not considered to be toxic. It is difficult to liquefy, and at 1 atm the melting and boiling points are −259°C and −253°C, respectively. The critical temperature and pressure are 12.8 atm and −240°C. It has a peculiar characteristic—its Joule–Thompson coefficient is negative above 100K—so that it heats up upon expansion for a wide range of temperatures. The liquefaction requires the use of liquid nitrogen so that we can reach 80K for the expansion to allow entering the gas–liquid region. Fig. 5.3 shows the Hauser diagram. Compression is hazardous since leakages may generate explosive atmospheres. Hydrogen is transported by pipes, and in bottles under supercritical conditions, but it can also be transported as a liquid in cryogenic containers. The advantage is its high density. For instance, at 20K its density is 850 times higher than the gas phase, and therefore it has been used as fuel in rockets Reinmert et al. (1998). The typical uses of hydrogen as a raw material are the following:
H bonding is strong, 436 kJ/mol. H2 is slightly soluble in water, but reacts with most elements, generating hydrides with those less electronegative. Its small size allows its diffusion across steel. Furthermore, with carbon steel it generates methane, reducing the strength of the material. This quick diffusivity determines the design of the units that process it. With air it generates explosive mixtures; however, they result in a pressure decrease. The process generates implosions instead of explosions. It is not considered to be toxic. It is difficult to liquefy, and at 1 atm the melting and boiling points are −259°C and −253°C, respectively. The critical temperature and pressure are 12.8 atm and −240°C. It has a peculiar characteristic—its Joule–Thompson coefficient is negative above 100K—so that it heats up upon expansion for a wide range of temperatures. The liquefaction requires the use of liquid nitrogen so that we can reach 80K for the expansion to allow entering the gas–liquid region. Fig. 5.3 shows the Hauser diagram. Compression is hazardous since leakages may generate explosive atmospheres. Hydrogen is transported by pipes, and in bottles under supercritical conditions, but it can also be transported as a liquid in cryogenic containers. The advantage is its high density. For instance, at 20K its density is 850 times higher than the gas phase, and therefore it has been used as fuel in rockets Reinmert et al. (1998). The typical uses of hydrogen as a raw material are the following:
• Production of ammonia with nitrogen.
• Production of hydrocarbons with CO and/or CO2.

In the following pages the main methods for the production of hydrogen from hydrocarbons are presented. Remember that water electrolysis has already been covered in this book (see Chapter 4: Water). The method of choice depends on the economy of the raw material and its availability. Therefore, it is a dynamic problem.
5.2.1.1 Gas generator—water gas method
This method, developed by Bosch in 1920, is characterized by two distinct reactions for processing coal into syngas. On the one hand, the partial oxidation of the coal, and on the other hand, its processing with steam. Each of the main reactions is also affected by the chemical equilibrium among the species involved, Boudouard in the case of carbon oxidation, and water gas shift (WGS) in the case of steam processing.
5.2.1.1.1 Partial oxidation (gas generator)
This stage consists of flowing oxygen through a bed of incandescent coal. Limited air and a certain bed height are required for the production of CO and CO2 together. In the first 15 cm of the bed C is combusted into CO and CO2. When oxygen is no longer available, Boudouard equilibrium occurs so that the CO2 reacts with the bed to produce CO (see the reactions below). The global process is exothermic:

The Boudouard reaction is of particular interest. It is endothermic,
with an equilibrium constant given by the following expression: Ortuño (1999)
(5.1)
Pressure and temperature have an effect on the composition of the gas. High temperatures favor the production of CO (it is an endothermic reaction), while pressure reverts the equilibrium into CO2; the number of moles is higher on the right-hand side. Let ni be the moles of species i, X the conversion, and PT the total pressure. Note that the solid coal does not take part in the equilibrium constant given by Eq. (5.2). Fig. 5.4 shows the effect of pressure and temperature in the equilibrium.
(5.2)

Thus, for the production of CO, we need limited availability of oxygen, a certain bed height, and high temperature (at the risk of melting the ash).
5.2.1.1.2 Steam processing (water gas)
The other stage in the process for syngas production from coal using this method is the use of steam. The main reaction produces CO and H2. It is an endothermic reaction (![]() ). Thus, CO is favored at high temperature:
). Thus, CO is favored at high temperature:
The reaction is an equilibrium whose constant can be written as follows:
(5.3)
 (5.3)
(5.3)The second reaction that occurs is the well-known water gas shift reaction (WGSR), given by the following equation:
It is an exothermic reaction affected by temperature. The wide application of this reaction deserves more attention. Thus, a more detailed discussion is needed.
The equilibrium between the four species is as follows:
It is widely used for modulating the concentration of CO and hydrogen in a stream, in the production of hydrogen from steam reforming of hydrocarbons, or in carbonous mass gasification. The equilibrium is reversible, and the reverse WGS can also be used if needed. The reaction is an equilibrium whose constant has been widely evaluated in the literature. The following are several correlations by Graaf et al. (1986), eq. (5.4) and by Susanto and Beenackers (1996), eqs. (5.5) and (5.6):
(5.4)
(5.5)
(5.6)
There is some flexibility for locating the WGS reactor within the processes, depending on the presence of sulfur compounds in the gas. It can be located either before the sulfur removal step (sour shift) or after sulfur removal (sweet shift).
Sweet operation of the WGSR occurs in two steps at high and low temperature, respectively. They are known as high-temperature shift (HTS) and low-temperature shift (LTS).
A conventional high-temperature sweet shifting operates between 315°C and 530°C and uses chromium- or copper-promoted, iron-based catalysts. The catalysts are calcinated over 500°C so that the Fe reaches α phase. Next, they are reduced at temperatures between 315°C and 460°C. Their half-time life is around three years. The difficulty in removing the energy generated in the reaction makes them work adiabatically. Thus, the feed is at around 310–360°C and 10–60 atm, and it is allowed to heat up. The conversion of CO is over 96%. The spatial velocity of the gas is typically 300–4000/h.
Low-temperature sweet shifting (up to 370°C) uses copper–zinc–aluminum catalysts. For instance, ICI catalyst contains 30% by weight of CuO, 45% of ZnO, and 13% of Al2O3. Furthermore, the use of supported Cu over chromium oxide (15–20% of CuO, 68–73% of ZnO, and 9–14% of Cr2O3) constitutes the Haldor Tøpsoe commercial catalyst that operates from 220°C to 320°C. The aim of this catalyst is to achieve 99% conversion of CO operating at 3–40 atm. The feed enters the reactor at 200–220°C and operates adiabatically. The spatial velocity of the gas is typically 300–4000/h. The half-life time of the catalyst ranges from two to four years.
A second type of WGSR is sour WGSR. For processing gases containing H2S, a catalyst based on cobalt–molybdenum is used. It is possible to add Li, Na, Cs, or K. The reaction is typically located after the water scrubber, where syngas is saturated with water at about 200–250°C. Furthermore, this catalyst can also convert carbonyl sulfide and other organic sulfur compounds into H2S. The reactor operates adiabatically, reaching conversions of CO of around 97%. Apart from packed beds, lately membrane reactors are gaining attention. They are based on the particularly high diffusivity of hydrogen through metals; see Fig. 5.5. Thus, the reaction occurs in the inner pipe and the hydrogen crosses the palladium-based wall. The purity of the hydrogen produced reaches 99.99% (Osenwengie Uyi, 2007).

Let us illustrate the operation and yield of WGS reactors in a numerical example.
Example 5.1
A WGS reactor works at 600K and the feed consists of 36% CO, 30% CO2, 20% steam, and 14% hydrogen.
Hint: use the correlation for Kp given by the following equation:
Solution
a. We write the equation of the constant (see Eq. 5.4) as follows:

Solving for X we choose the lowest solution: ![]() .
.
With respect to the limiting reactant, H2O, the conversion is ![]() .
.
b. For a range of temperatures, we compute the conversion following the same procedure as before (Fig. 5E1.1).

Now that both reactions, the gas generator, and the water gas path have been evaluated, the production of syngas consists of using both to process the coal and adjust the composition of the syngas.
Fig. 5.6 shows the scheme for the process dividing the use of coal between the two processes. In Example 5.2 we evaluate the performance of such a process.

Unfortunately, at pressures above atmosphere and low temperatures, methane is produced following this reaction:
When the temperature rises, the equilibrium reverses. The equilibrium constants for the reaction for a couple of temperature values are Log10 Kp (25°C)=9 and Log10 Kp (100°C)=−2. Table 5.1 shows the effect of temperature on methane production.

Example 5.2
In a syngas production facility, 40% of the coal follows the gas generator cycle and 60% the water gas cycle. Coal consists of 90% coke and 10% ash. Ignoring the loss of coke with the ashes and assuming the air is dry, and assuming that in the gas generator cycle 50% of the coal goes to CO and the rest to CO2, and assuming that in the water gas cycle only 75% of the steam injected reacts, compute the following:
A. Flowrates of air gas and water gas produced.
B. Energy available in the two gas streams.
C. Fraction of the energy in the coal remaining at each gas flow.
D. Amount of air and water needed to process 10 t of coal.
E. Repeat the example assuming humid air at Ts=25°C, φ=0.65, and PT=720 mmHg.
Solution
Each cycle is analyzed separately.
Air Cycle (Gas Generator)
In the first case, the air is dry. Therefore, the only reaction that takes place is that given by the combustion of C. We assume that half of the C forms CO and the other half produces CO2. The stoichiometry is as follows:

We use 1 kg of coal as the basis. Thus, 0.9 kg of C and 0.1 kg of ash are processed; 40% is processed through the air cycle. Therefore, the carbon burnt is equal to 0.4×0.9 kg=0.36 kg of C. Based on the stoichiometry of the reaction, the mass balances to the species are as follows:

The composition of the gas produced is given in Table 5E2.1.
Table 5E2.1
| Air Gas | ||||
| Species | kmol | kg | m3 (c.n.) | % |
| N2 | 0.0846 | 2.3688 | 1.894 | 73.8 |
| CO2 | 0.0150 | 0.66 | 0.336 | 13.1 |
| CO | 0.0150 | 0.42 | 0.336 | 13.1 |
| Total | 0.1146 | 3.4488 | 2.565 | 100.00 |

In the water cycle case, the reaction that takes place is the following, where we assume that no WGSR occurs (Table 5E2.2):

Table 5E2.2
| Water Gas | ||||
| Species | kmol | kg | m3 (c.n.) | % |
| H2 | 0.045 | 0.090 | 1.007 | 42.85 |
| CO | 0.045 | 1.260 | 1.007 | 42.85 |
| H2O | 0.015 | 0.270 | 0.336 | 14.29 |
| Total | 0.105 | 1.620 | 2.457 | 100.00 |

The ratio between both is defined by this equation:
Energy in Gas Generator
The energy available in the gas is that resulting from burning the CO:

The energy per unit volume is given as:

For the energy in water gas, we can burn hydrogen and CO:
Per unit volume it is as follows:

For the hydrogen, the combustion energy is the enthalpy of formation of steam:

Given the per unit volume we have the following:

Fraction of Energy in Original Raw Materials
Our raw material was coal that when completely burned could produce the following amount of energy:
Using the same basis:

Coal Processing
To process 10 t of coal, simply multiply all the previous results by 104:

The air needed (Table 5E2.3) is this:
Table 5E2.3
| Dry Air per kg of Coal | |||
| Component | kmol | kg | m3cN |
| O2 | 0.0225 | 0.72 | 0.503 |
| N2 | 0.1128 | 3.15 | 2.525 |
| Total | 0.353 | 3.87 | 3.028 |

In case the air is humid, the reactions taking place are not only those corresponding to burning C to CO and CO2, but also those of the water gas cycle:

For the initial basis of calculation of 1 kg of coal (90% of C), 40% is processed using this cycle; thus 30 mol of C are processed. We assume that the moisture of the air is completely consumed. The moisture in the air is computed as follows:

The elementary mass balance proceeds as follows:

Solving the system we have the following:
The air required for this case—assuming ideal gases (PV=nRT)—is 2.304 Nm3. The gas produced has a volume of 2.508 Nm3. Thus, the energy contained in the gas is again due to the presence of hydrogen and CO:


The part of the problem corresponding to the water cycle does not change. Therefore the total power for the generator gas is 1215 kcal, representing 17.2% of the energy in the coal.
5.2.1.2 Coal distillation
Coal distillation is the chemical process that decomposes a carbonous material by heating it up to high temperatures in the absence of air. It is basically a pyrolysis that allows the production of a number of species, from coke to coal gas, gas carbon, Buckmisterfullerene, and hydrogen—when operating from 800°C to 1000°C. As the coal is heated, several processes take place:
• Up to 100°C gases such as O2, N2, and even CH4 and H2O, are desorbed.
• From 100°C to 300°C some gases, such as H2S, CO2, CO, and small hydrocarbons, are released due to the breakage of radicals, sulfur ligands, and acid groups.
• The first liquid fractions appear at around 310°C. Gases are also produced due to the breakage of the liquids.
• From 400°C to 450°C the coal starts to melt, becoming plastic, so that the volume of the mass contracts. Paraffinic chains melt above 500°C, and gases and liquid hydrocarbons are also produced.
• From 550°C melting finishes and the coal is no longer a plastic. The fraction of gases and liquids produced is lower, and we produce coke.
• From 500°C to 600°C component A depolymerizes, generating C12 particles; hydrogen is also released.
• From 700°C to 1000°C there is only cracking. The main component of the gases is hydrogen that, as it is released, generates porosity in the coal mass, providing mechanical resistance. Liquid production is low.
Typically, from 100 kg of coal we obtain 72 kg of coke, 22 kg of gas (hydrogen, ethylene, ethane, methane, CO, CO2, and nitrogen), and 6 kg of tar containing mainly benzene, toluene, xylene, phenol, naphthalene, anthracene, and liquor.
5.2.1.3 Gasification
Gasification is the partial oxidation of a carbon substrate into a gas with a low heating value; it proceeds via a series of reactions that occur in the presence of a gasification agent such as air, oxygen, and/or steam. To produce hydrogen, gas reforming after gasification is required. There are a number of designs for the gasifiers. They are first classified as either fixed or fluidized beds. Fig. 5.7 shows four designs: (a) a fixed bed with countercurrent solids and gas circulation; (b) a downdraft-type fixed bed where the carbonous material and the gases exit the unit from the bottom; (c) a bubbling-type fluidized bed where only one unit is involved; and (d) a circulating-type fluidized bed that requires solid gas separation to recycle the solids. The product gas composition is highly dependent on the configuration, the raw materials, and the operating conditions. Brigdwater (1995) presented some tables that gathered the yields of different designs. The operating temperatures range from 700°C to 1000°C and the pressure from slightly above atmospheric to 30 atm. Typically, the largest production capacity is obtained using fluidized beds.

Lately, gasification has been used to process biomass to obtain syngas. This has been used for the production of different biofuels such as ethanol, Fischer–Tropsch (FT) liquids, or hydrogen (Martín and Grossmann, 2013). The two basic designs are either the one based on the FERCO/Battelle design or the one by the Gas Technology Institute (GTI). Fig. 5.8 shows the scheme for the GTI gasifier. It is a bubbling-type gasifier that operates above atmospheric pressure (5–20 atm) and 800–900°C. It consists of one single unit, and in order to avoid gas dilution, oxygen (instead of air) and steam are used as fluidification agents. The gas produced has a low concentration of hydrocarbons, but the fraction of CO2 is large. It is called Renugas. Fig. 5.9 shows the scheme of the FERCO/Battelle gasifier. The system consists of two units: the gasifier and the combustor. In the gasifier, steam is mixed with the carbonous material. The energy for the gasification is provided by hot sand. The solids, sand and char, are separated in the cyclone, and both are sent to a combustor where air is used to burn the char and reheat the sand. A cyclone separates the flue gas from the solids (the sand), which are recycled to the gasifier. The syngas produced in this system has a higher concentration of hydrocarbons but typically lower concentration of CO2. Furthermore, since the combustion of the char takes place in a second unit, air can be used without diluting the syngas.


The main reactions can be divided into several types:


If gasification is the first stage to hydrogen production, after gas purification, a WGS stage is needed.
5.2.1.4 Thermal decomposition/partial oxidation
1. Hydrocarbon + Heat → H2 + Lamp Black
This reaction is of interest for the production of lamp black more than for hydrogen; the hydrogen is not pure enough.
2. Hydrocarbon + Heat → H2 + Unsaturated Hydrocarbon
For instance, the production of ethylene from methane:
Operating under limited availability of oxygen, this reaction not only produces energy, but also syngas. The yield to hydrogen is lower than when using steam. The oxygen needed can be fed as pure oxygen if the syngas is due to produce fuels, or air if nitrogen is required (eg, in the production of ammonia). The presence of nitrogen typically results in an increased size of all the units downstream, and it is not recommended.
5.2.1.5 Steam reforming of hydrocarbons
In the section on gasification, reforming was mentioned as a means to enhance the proportion of hydrogen by decomposing the hydrocarbons into CO and hydrogen. If the feedstock is already made of hydrocarbons, reforming is the first stage towards syngas:

The most representative case is methane steam reforming. The process involves a coupled equilibria, that of the decomposition of the methane and that of the WGS. The constants are presented below Davies and Lihou (1971):
(5.7)
(5.8)
Steam reforming is an endothermic process that requires a large amount of energy. Furthermore, the products show a larger number of moles. Therefore, pressure drives the equilibrium to the reactants, not to the product. The WGSR is exothermic and increases the proportion of hydrogen. Here we present the kinetics for this particular packed bed reactor, where y represents the molar fraction:
(5.9)
 (5.9)
(5.9)
The reforming of natural gas for the production of hydrogen consists of four stages, namely, purification, reforming, WGS, and gas purification. Fig. 5.10 shows the scheme of the process. The natural gas must be purified to remove sulfur compounds that are poisonous to the catalysts downstream. Typically a hydrodesulfurization stage transforms the organic sulfur compounds into H2S using as catalyst an alumina base impregnated with cobalt and molybdenum (usually called a CoMo catalyst) operating at 300–400°C and 30–130 atm in a fixed bed reactor. For example, ethanethiol (C2H5SH):

After that, a bed of ZnO, operating at 150–200°C, is used to remove H2S:
Alternatively, iron-based oxides (Fe2O3) operating at 25–50°C can also be used:
At this point, the gas is fed to the reformer. Remember that hydrocarbon reforming is endothermic and a fraction of the feed is used to provide that energy. The primary reformer uses Ni/Al2O3 as a catalyst, and the secondary one, if used, is Ni supported on ceramics. Around 10% of the feed is typically used as fuel. In the reforming reaction, CO is produced, as seen above. Thus WGS is carried out in two stages: an HTS at 350°C using Fe3O4 as a catalyst, and an LTS at 200°C using CuO as catalyst, operating adiabatically, to achieve more than 97% conversion. Finally, the CO2 generated is eliminated. Several technologies that will be presented in the following section can be used, such as absorption in ethanolamines or adsorption in fixed beds, pressure swing adsorption (PSA) systems. Finally, the traces of CO and CO2 are eliminated by methanation. The reaction consumes a small amount of hydrogen using Ni/Al2O3 as catalyst:
The purity achieved is above 99.95 mol%. Fig. 5.11 shows a scheme of the reformer furnace. The process typically requires 1.3 Mg/d of steam at 2.6 MPa, and produces 1.9 Mg/d at 4.8 MPa.
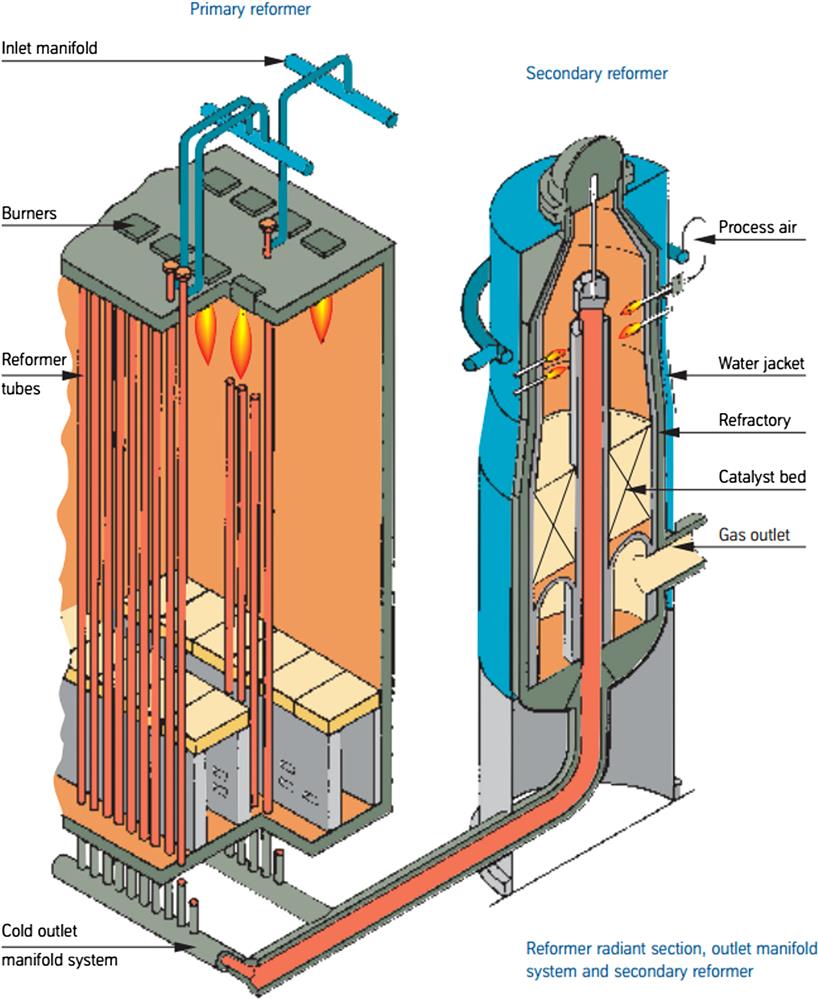
In the production of ammonia, the reforming system consists of two reformers (see Fig. 5.11). A primary reformer is fed with desulfurized gas that has been preheated to 400–600°C. The furnace consists of a number of high-nickel chromium alloy tubes filled with a nickel-based catalyst. The heat to the process is provided by burning fuel, typically a part of the supply, requiring from 7 to 8 GJ per ton of ammonia. In the secondary reformer, a packed bed reactor, the nitrogen needed for preparation of the synthesis gas is added. Air is compressed and heated on the convection section of the primary reformer and fed to the secondary reformer. Next, HTS and LTS are carried out to produce more hydrogen by reducing the CO generated in the reforming stage. Throughout the chapter, the complete process will be described.
In Table 5.2 the comparisons between fired furnaces and gas-heated reformers are presented, justifying the use of the second ones.
Table 5.2
Advantages of Gas-Heated Reformers
| Fired Furnace | Gas-Heated Reformers |
| Large volumes | Smaller volumes |
| Larger surface area and heat loss | Reduced surface area and heat loss |
| Complex instrumentation | Simplified instrumentation |
| High maintenance costs | Low maintenance costs |
| Large convection zone | No convection zone |
| Stack losses | No stack losses |
| High fixed capital costs | Low fixed capital costs |
| Reduced catalyst tube loss from high temperature and uneven heat distribution | Longer tube life due to uniform heat distribution |
| Increased downtime required for shutdown | Reduced downtime required for shutdown |
| Well-established process | Yet to gain wide acceptance |
Example 5.3
A novel process for the production of hydrogen from propane is being evaluated. In the reformer, two main reactions take place:
Propane steam reforming occurs in a reactor whose pipes are packed with nickel catalyst. The feed to the reactor consists of a mixture of steam–propane with a molar ratio of 6:1 at 125°C. The products of the reforming stage leave the reactor at 800°C. The excess of steam assures the complete consumption of propane.
To provide the energy for the endothermic reactions, flue gas consisting of N2 and 22% of CO2 is used. The gas is fed at a rate of 4.94 m3/mol of C3H8 at 1400°C and 1 atm, and exits the reactor at 900°C. Assume adiabatic operation. This stream is further integrated to produce low-pressure steam at 125°C from water at 25°C. The flue gas leaves the heat exchanger at 250°C. Determine the molar composition of the gas product and the amount of steam produced.
Solution
Since we are not given the equilibrium constants, we formulate the problem based on elementary balances and an energy balance as follows:

The elementary balances are as follows:

Using 1 kmol of propane as the basis for the calculations, we solve the problem (Table 5E3.1).

In EXCEL Solver, the model is written as in Fig. 5E3.1

5.2.1.6 Dry reforming and autoreforming
So far steam reforming and partial oxidation have been considered to produce syngas or hydrogen. There are two more alternatives. The first one is the combination of the previous two. Autoreforming uses the energy generated in the partial oxidation of a fraction of the feed to provide the energy required for the steam reforming reactions. In this way, the operation is adiabatic. The stoichiometry depends on the energy balances. For example:
Dry reforming is a novel technology in which CO2 is used to treat hydrocarbons to produce syngas. The reaction is endothermic and the yield to hydrogen is low, but it represents a process where CO2 becomes a carbon source to be reintegrated in the process:
5.2.2 Nitrogen Production
See Section 3.2, Air Separation.
5.3 Stage II: Gas Purification
Typically, in the production of syngas, apart from CO and hydrogen, a number of species are also produced. We have already discussed the processing of hydrocarbons through reforming for their decomposition. However, the presence of CO2 and sulfur compounds creates a poisonous environment for the reactions downstream (Reep et al., 2007). In this section, two cases are considered: the production of ammonia and the production of synthetic hydrocarbons and fuels.
5.3.1 Ammonia Production (Syngas N2+H2)
The CO2 in contact with ammonia and water produces carbonates. This was the desired reaction in the Solvay process, but not in this case since they deposit on the catalyst:
The sulfur compounds, if not eliminated before, poison the catalyst since they target Fe.
The presence of CO2, O2, and H2O also negatively affect the catalyst by deposition.
CO can react with the catalyst, producing copper formate.
5.3.2 Synthesis of ft type of fuels (Syngas CO+H2)
In this case the major concern is the removal of sour gases, CO2, and H2S, since the latter are poisonous to the catalyst and the former negatively affect the reaction.
5.3.2.1 Sour gas removal
Sour gas removal is a more general case of carbon capture. The technologies have been used at industrial scale over the last few decades, but only now are they attracting more attention Plasynski and Chen (1997), GPSA (2004).
5.3.2.1.1 Alkali solutions
These are used for the simultaneous removal of CO2 and H2S via absorption; Fig. 5.12 shows a scheme. The use of ethanolamines is based on a series of consecutive reactions between the sour gases and the alkali solution. The absorption occurs at low temperature (29°C) and moderate pressure (29 atm). To avoid dilution of the solution by the condensed water, it is separated upon cooling. There are a number of rules of thumb to determine the flow of amine as a function of the type. Typically, for monoethanolamine, a solution of 15–25% by weight with a correction factor of 0.25–0.4 based on a mol-to-mol-based reaction is used. The reaction is exothermic, and therefore the exit liquid heats up. The reactions for capturing the CO2 are as follows:


where the absorption kinetics are given by the equations below (Kierzkowska-Pawlak and Chacuk, 2010):
(5.10)
 (5.10)
As long as:
(5.11)
 (5.11)
The solution is regenerated by distillation. The column operates at 1.7 atm and is fed with the solution at 93°C. The distillate exits at 54°C and the bottoms at 125°C. The energy involved in the different heat exchangers can be computed based on rules of thumb as a function of the flow of amine in gallons per minute, see Figure 5.12 (GPSA, 2004)
Example 5.4
A stream of 40 kmol/s at 34.5 atm and 298K of syngas with 10% CO2 is processed to remove 99.5% of it before further stages. The equilibrium data for the system CO2–amine are given in the table below. The L/G ratio is 1.5, the minimum. Determine the number of stages in a gas–liquid absorption tower for the removal of CO2 from syngas assuming 25% efficiency per stage (Table 5E4.1).
Table 5E4.1
| mol CO2/mol Amine | PCO2(Pa) |
| 0.025 | 65 |
| 0.048 | 197 |
| 0.145 | 1204 |
| 0.276 | 3728 |
| 0.327 | 4815 |
| 0.45 | 8253 |
| 0.9 | 26,325 |
| 10 | 1,480,620 |
| 15 | 2,918,315 |
| 20 | 4,722,992 |
Solution
We first draw the XY curve where X represents the moles of gas per mol of solution free of gas and Y is the moles of CO2 in the gas per mol of stream free of CO2:

Since yn+1=0.1 and y1=0.005, the corresponding Ys are as follows (Table 5E4.2):
Table 5E4.2
| mol CO2/mol Amine | PCO2(Pa) | mol CO2/mol Inert |
| 0.025 | 65.4479554 | 1.89705E-06 |
| 0.048 | 197 | 5.71018E-06 |
| 0.145 | 1204 | 3.48998E-05 |
| 0.276 | 3728 | 0.00010807 |
| 0.327 | 4815 | 0.000139585 |
| 0.45 | 8252.67269 | 0.000239265 |
| 0.9 | 26,324.9963 | 0.000763626 |
| 10 | 1,480,619.55 | 0.044840925 |
| 15 | 2,918,315.23 | 0.092405305 |
| 20 | 4,722,991.64 | 0.158612026 |
If we plot the equilibrium data for Yn+1, we have Xmax=16.5, and thus:

We also plot the operating line (triangles) and the minimum operating line (squares) (Fig. 5E4.1).

Therefore, we need three stages. With an efficiency of 0.25, 12 trays are needed for the operation.
5.3.2.1.2 Physical absorption
For operating pressures above 50 atm, physical absorption is widely extended using different solvents that define the processes, such as Selexol (using polyethylene glycol dimethyl ether, UOP) or Rectisol (using methanol, Lurgi). In general, these processes operate at very low temperatures and high pressures. Thus, only if the gas is already at high pressure is it interesting to use them. The flowsheet is similar to the one presented for the use of alkali solutions, an absorber and a desorber column.
Currently, the Selexol process operates on a license by UOP LLC. The solvent, a mixture of dimethyl esters of polyethylene glycol, absorbs or dissolves the sour gases at 20–140 atm. The solvent is regenerated by reducing the pressure. The Selexol process can selectively separate CO2 and H2S so that the latter can be sent to the Claus process to obtain elementary sulfur and from it sulfuric acid; the CO2 can be further used. Below 2 MPa the absorption capacity of the solvent is greatly reduced and alkali-based processes are more interesting.
The Rectisol process (Lurgi) uses methanol under cryogenic conditions (−40°C) and from 27.6 atm to 68.9 atm for the removal of H2S and CO2. It is also selective with the gases.
Fig. 5.13 shows the comparison between physical and chemical sorbents. Physical sorbents show a linear absorption capacity with the partial pressure of the gas, and for them to be competitive, the pressure must be higher than when using alkali solutions. However, the energy involved in the regeneration of the solvent is lower.

5.3.2.1.3 Pressure swing adsorption (PSA)
The operation of PSA systems for the removal of sour gases is similar to the one presented in Chapter 3, Air, where they were used to separate nitrogen and oxygen. The difference is the adsorbent bed. The operating conditions are low temperatures (25°C) and moderate pressures (4–6 atm). Typically, CO2 is the one removed. In Fig. 5.14 the adsorption capacity for molecular sieve carbon is shown. Zeolites can also be used.

5.3.2.1.4 Membrane separation
The use of membranes is based on the different diffusion rate of the gases through the membranes; see Chapter 3, Air, for further discussion. The materials of the membranes are typically the same as those used as adsorbent beds so that the membranes are of the type known as gas absorption membranes. On the other side of the membrane, a carrier is used to withdraw the CO2 molecules that diffuse through it. No hydrostatic pressure is required. The drawback is that the carrier must be regenerated, similar to when using alkali solutions.
5.3.2.1.5 Cryogenic separation
It is possible to liquefy and condense CO2 by compression and cooling. However, the compression rates required and the small fraction of CO2 in the gas result in high energy consumption. This method is only recommended for streams with concentrations over 60% in CO2.
5.3.2.1.6 Mineral storage and capture
This process was described in Chapter 4, Water, when the equilibrium for the decomposition of the calcium carbonate was presented. Calcium carbonate as well as other chemicals can be used.
5.3.2.2 Removal of H2S
This was briefly depicted for the reforming of natural gas. This stage takes place from 150°C to 400°C following the reaction below in an adsorbent bed or in a scrubber:
Instead of using a bed of ZnO, it is possible to use iron compounds. They operate optimally at 25–50°C. Condensation of water on the catalyst should be avoided since it reduces the contact area.
In the Claus process the recovered H2S can be further processed to recover the S in it and produce H2SO4. This process was discovered by Carl Friedrich Claus, who obtained a patent in 1883. The process has a thermal and a catalytic stage.
In the thermal stage, the H2S is burned to produce SO2 that reacts with the feed of H2S to produce sulfur, as in the following reactions:

Two thirds of the H2S are converted to elementary sulfur.
In the catalytic stage, the Al2O3 or titanium oxide IV is used as catalyst. The reaction progresses as follows:
The sulfur obtained can be in the form of S6, S7, S8, or S9. This stage can be subdivided into three phases: heating up, catalytic reaction, and cooling with condensation. Heating up avoids condensation of sulfur on the catalytic bed. The first catalytic stage operates at 315–330°C. For the next two stages, the bottom of the bed is at 240°C and 200°C, respectively, since the conversion is favored. Finally, the gas is cooled down to 130–150°C and the excess energy is used to produce steam. Fig. 5.15 shows the scheme of the process.

5.3.2.3 Removal of CO (ammonia synthesis)
The WGSR is used to convert CO into CO2. A two-step method for sweet gases is employed. First the gas stream is passed over a Cr/Fe3O4 catalyst at 360°C, and later over a Cu/ZnO/Cr catalyst at 210°C.
The remaining CO can be separated at low temperatures or by absorption in copper solutions. In the first case, after the removal of CO2, methane and CO are cooled down to −180°C at 40 atm, condensing both. The mixture is expanded to 2.5 atm and distilled to obtain CO from the top and methane from the bottom. The second method can use several copper aqueous solutions such as CuCl in HCl (at 300 atm, recovering the CO by expansion at 50°C), and solutions of CuCl and AlCl3 in toluene operating at 25°C and 20 atm. The CO is recovered at 100°C and 1–4 atm.
5.3.2.4 Water removal (ammonia synthesis)
The gas mixture is cooled to 40°C, at which temperature the water condenses out and is removed.
5.3.2.5 Removal of carbon oxides: methanation (ammonia synthesis)
The remaining CO2 and CO after carbon capture are converted to methane (methanation) using an Ni/Al2O3 catalyst at 325°C:
The water produced in the reactions is removed by condensation at 40°C.
5.4 Stage III: Synthesis
5.4.1 Ammonia
5.4.1.1 Introduction
History: Ammonia was already known back in ancient times. There are up to three possible origins for the word ammonia. It is typically related to the discovery of sal ammoniac (ammonium chloride) near the Temple of Zeus Ammon, in the Siwar Oasis, Libya. The word means “sand” in Greek. It was reported that the salt was found beneath the sand. Pliny also reported the existence of another hammoniacum close to the oracle of Ammon. It was a plant secretion deposited in the sand as droplets. The last possible origin is also related to the Temple of Zeus Ammon since the priest, while burning camel dung for fuel, observed the formation of some white crystals. It was not until 1716 that ammonia was linked to rotten food. A few years later, in 1727, it was obtained from lime and ammonium chloride, as reported in the Solvay process:

Free ammonia was first prepared in 1774 by J. Priestly using ammonium carbonate, and in 1785, the chemical formula was discovered by C. Berthollet. In the 1840s ammonia was a byproduct in coke production. The current process for the production of ammonia is based on the research by Fritz Haber from 1880 to 1900 on the equilibrium of the reaction between nitrogen and hydrogen. In 1908 BASF and Haber came to an agreement to design an industrial plant. In the 5 years working with Karl Bosch, they developed the so-called Haber–Bosch process. The first plant dates back to 1913 in Ludwigshafen, with a capacity of 30 t/day, a process that displaced the use of coal and charcoal as sources for ammonia. In 1953, 143 facilities were already in operation (The HaberBosch Heritage. 1997, www.science.uva.nl).
Properties: Ammonia is a colorless gas with a characteristic odor whose density is 0.7714 g/cm3. However, it can easily be liquefied at moderate pressure. In Table 5.3 we can see some values for the vapor pressure as a function of the temperature. The heat of vaporization is 5580 cal/mol and the critical temperature is 132.9°C. It is highly soluble in water, in particular at high pressure and low temperature. At 20°C and 1 atm, a solution of 28% can be obtained; it is sold commercially. It solidifies at −78°C in the form of colorless crystals.

From a health and safety point of view, a feature worth mentioning is the fact that ammonia–air mixtures may explode with a hot point. Furthermore, in the gas phase it is toxic since it increases the blood pressure if breathed in. The eyes are sensitive to it, and it burns the skin.
Production: Ammonia is naturally produced from rotten, nitrogenated organic species. For decades it was obtained from the distillation of carbonous materials. It is currently produced from the reaction of nitrogen and hydrogen. This is the process that will be analyzed below.
Usage: Ammonia is the basic raw material for the nitrogen industry. Nitrogen fertilizers are the most widely used fertilizers, which constitute 80% of the ammonia market. The increase in consumption is 18% over the several last years. Urea, caprolactama, and explosives, as well as nitric acid, are other well-known products.
Storage: Ammonia is stored as a compressed liquid in sphere tanks made of chromium–nickel stainless steel; the use of Zn or Cu would produce soluble amines.
5.4.1.2 Stage III reaction (H2+N2)
The reaction is shown below. We are going to evaluate its thermodynamics and kinetics as well as the design of the converter Appl (1998). Finally, we will describe different commercial processes for the production of ammonia.
5.4.1.2.1 Thermodynamics of the reaction
Ammonia production is an exothermic reaction and thus low temperatures favor conversion. However, the kinetics sets the lower bound of the operating temperature. On the other hand, there is a decrease in the number of moles as the reaction progresses. Therefore, the higher the pressure, the larger the conversion. The ideal operation would be isothermal, since high conversions could be achieved. However, removing the energy generated as the reaction advances is a technical challenge and the design of the reactors look for an optimal operating line. The typical pressures and temperatures are 100–1000 atm and 400–600°C (Vancini, 1961). In Table 5.4 we see some values of the equilibrium constant as a function of both pressure and temperature. Alternatively, in the literature we can find correlations (Eqs. 5.12 and 5.13) to compute the equilibrium constant either for atmospheric pressure, or as a function of it; the parameters b and u can be seen in Table 5.5.
(5.12)
(5.13)
Table 5.4
Values for the Equilibrium Constant
| Temperature (°C) | |||||
| P (atm) | 325 | 350 | 400 | 450 | 500 |
| 1.0 | 0.0401 | 0.0266 | 0.0129 | 0.0060 | 0.0038 |
| 100 | 0.0137 | 0.0072 | 0.0040 | ||
| 300 | 0.0088 | 0.0049 | |||
| 600 | 0.0130 | 0.0065 | |||
| 1000 | 0.0233 | 0.0099 | |||

Table 5.5
| P (atm) | b | u |
| 300 | 1.256×10⁻⁴ | 2.206 |
| 600 | 1.0856×10⁻⁴ | 3.059 |
| 1000 | 2.6833 | 4.473 |
The equilibrium constant is a pseudoconstant since it is computed with partial pressures instead of fugacities. Thus, for the stoichiometry presented, the equilibrium is as follows Reklaitis (1983):
(5.14)
(5.15)
(5.16)
Example 5.5
Compute the ammonia fraction at equilibrium for an operating pressure equal to 1 atm. The reaction for the production of ammonia is given as follows:
The feed enters the reaction in stoichiometric proportions. Assume that no inerts accompany the feed and that the correlation for the equilibrium constant is given by the following equation:

Solution
For this example, we use the following nomenclature: T=temperature, PT=P, and the molar fraction for the species involved is detoned as x, y and z for NH3, N2 and H2 respectively. Therefore:


Thus:

We can solve the equation for x as follows:

We compute, for different temperatures, the fraction of ammonia given by the variable x (Table 5E5.1).
Table 5E5.1
| P (atm) | T (K) | Kp | x |
| 1 | 473 | 0.59515055 | 0.14221511 |
| 1 | 523 | 0.17715127 | 0.051733 |
| 1 | 573 | 0.06429944 | 0.02005278 |
| 1 | 623 | 0.02717032 | 0.00867146 |
| 1 | 673 | 0.01293599 | 0.00416616 |
| 1 | 723 | 0.00677637 | 0.00219106 |

Assuming that the correlation is valid for different pressures, Fig. 5E5.1 presents the ammonia fraction of the product gas as a function of the pressure and temperature. As predicted by Le Chatelier’s principle, the conversion increases with the pressure and for lower temperatures. As described above, the optimal operation in the reaction would be isothermal, since high conversion could be obtained in one stage. Adiabatic operation leads us to find the limit given by the equilibrium line. The reader can also use the values for Kp given in Table 5.4 to compute the ammonia fraction obtained.

5.4.1.2.2 Reaction kinetics
The kinetics are based on the process of adsorption of the molecules on the surface of the catalyst and subsequent desorption. The mechanisms can be divided into four stages; the scheme can be seen in Fig. 5.16:
1. Diffusion of the nitrogen and hydrogen from the bulk of the gas to the surface of the catalyst and the porosity of the grain.
2. Chemical adsorption of the gases on the catalyst.
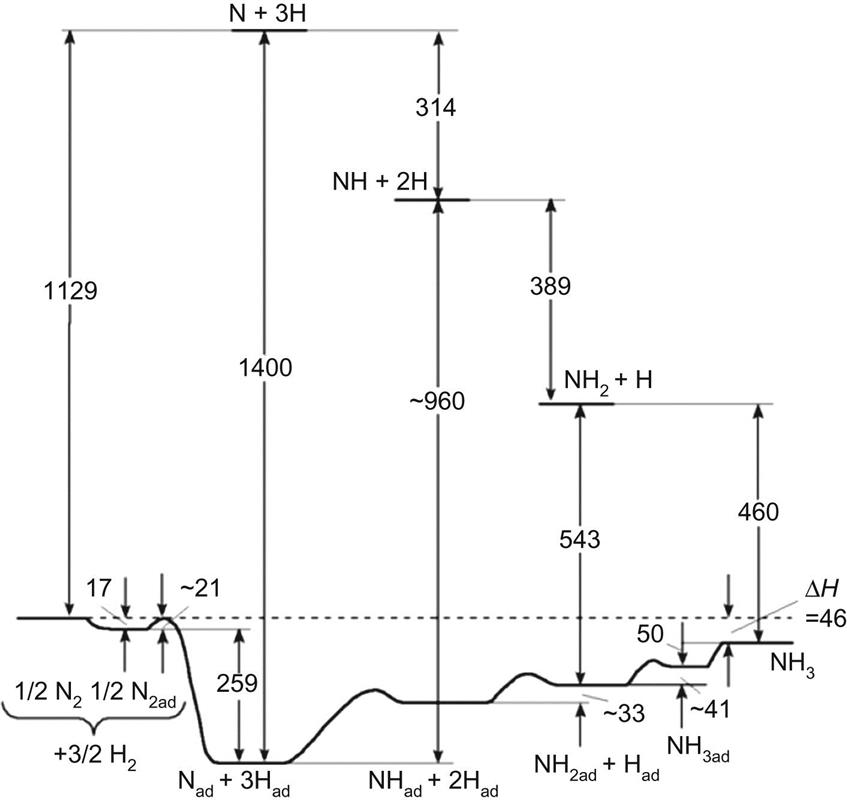
3. Interaction between the atoms of nitrogen and hydrogen. The nitrogen accepts the electrons from the catalyst and the hydrogen atom gives them away to compensate for the charge. In a sequence, imide (NH), amide (NH2), and ammonia (NH3) are produced.

The mechanism can be described as follows:

where the relative stability of the species can be seen in Fig. 5.17.
The main challenges of the kinetics are the following: (1) there is a high dependence on the dissociation of the nitrogen molecules; (2) there is an effect of the diffusion on the process, which relies on the catalyst structure; (3) the limiting stage is either the physical or chemical adsorption and ammonia desorption; and (4) the relative distance to equilibrium has impact (ie, the greater the distance, the quicker rate).
Although the kinetics is complex, it is widely assumed that the slowest stage is ammonia desorption. Thus, calling r′ the formation rate of ammonia and r″ the desorption rate, we have as the global rate of ammonia produced:
Tiomkin and Pyzhev (Wallas, 1959) suggested the rate of production of ammonia as per Eq. (5.17):
(5.17)
In Fig. 5.18 we see that the rate increases with the temperature up to 500°C but there is a maximum due to the equilibrium, and with pressure, since higher pressure helps in the gas adsorption. The kinetic constants depend on the catalyst used. It is assumed that r′ is limited by the chemical adsorption of nitrogen on the catalyst, while r″ is controlled by the desorption of the ammonia produced.

The catalysts used for the production of ammonia, unlike what is expected, are not those appropriate for hydrogenation processes, but are those capable of producing nitrates. Typically, transition metals such as W, Os, Fe, Mo, and U can be used, but for economic reasons Fe is used in its crystalline α structure. The structure of Fe depends on the temperature:
Due to the high operating temperature during the reaction, it would be possible to reach the more compact structure γ, which represents a problem in terms of species diffusion. To avoid that compaction, and to stabilize the catalyst, small amounts of Al2O3 are added to the bulk. Thus, the preparation of the catalyst is as follows:
1. Production of the catalytic mass by oxidation of melted Fe under a flow of O2 to which small amounts of Al2O3 are added.
2. Activation of the catalytic mass by reduction with synthetic H2.
These catalysts are sensitive to CO2 and H2S, and therefore both must be eliminated before synthesis. It is also possible to poison a catalyst in a previous reactor so that FeS and CH4 are produced at low temperature in a controlled stage.
5.4.1.2.3 Converter design
Operation with hydrogen under high pressure is what defines reactor structure and design. Hydrogen under the reaction pressure conditions is capable of removing carbon from carbon steel and producing hydrocarbons such as methane. As a result, the material loses resistance, and over time can crack and even explode. Furthermore, iron at high temperature is permeable to hydrogen. This permeability increases with pressure. To address these challenges, the converter is made of iron with almost no carbon. Since this material cannot handle high pressure or even maintain the hydrogen inside, the internal structure is surrounded by a second structure made of chromium–nickel stainless steel. As the designs will show, a flow of gas between both tubes will drag along the hydrogen that has escaped the inner structure, similar to current designs for energy efficient buildings where a flow of air prevents cold or hot flows from entering.
The operating conditions are from 400°C to 500°C, as seen in Fig. 5.18. Therefore, the feedstock must be heated up. This is carried out in the bottom part of the reactor where a heat exchanger kind of design is allocated using hot products as hot stream. The reaction in the catalytic bed is highly exothermic. Thus, the energy generated must be removed. A number of alternative designs are available in the industry, as will be presented below. The gas exiting the reactor contains 8–12% ammonia. The product is recovered by condensation, and the unreacted gas is recycled. The various designs can be classified as either multibed or tubular converters (Couper et al., 2009, Appl, 1999).
Multibed designs
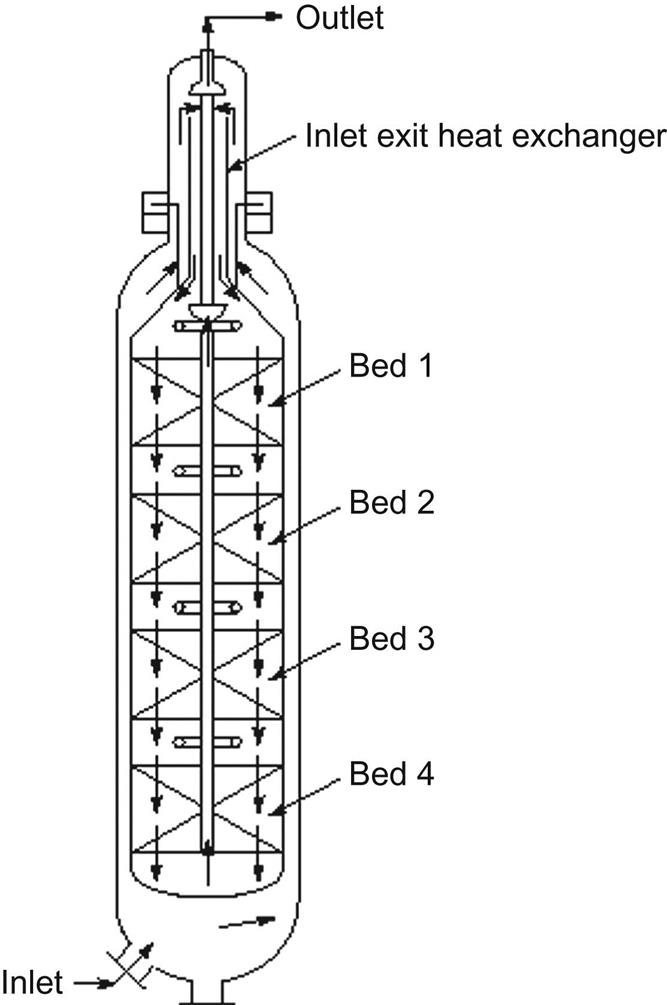
Multibed reactors with direct cooling, also known as quench converters, are devices that consist of a series of catalytic beds operating adiabatically. The various beds are separated by mixing areas where the hot converted gas is cooled down with cold fresh feed gas. Therefore, only a fraction of the feed is heated up to 400°C. The packed bed is designed so that the final temperature of the gases is around 500°C. This gas is cooled down to 400°C using cold, unconverted gas. One of the main drawbacks of the system is that the feed flow does not cross the catalytic beds, and therefore most of the ammonia is produced within a flow already containing ammonia. This means that the reaction rate is lower and a larger amount of catalyst is required.
In Fig. 5.19 it can be seen that the last bed is larger than the previous ones. In the reactor, the feed enters from the top, it is guided between the inner and outer tubes, heated in the bottom heat exchanger up to 400°C, and then rises through an internal pipe to be fed to the first bed. In Fig. 5.19 we see that the gas has been gradually heated up along the way. The conversion in the first bed increases the temperature and the amount of ammonia. Once the gas reaches 500°C, it is cooled down with unconverted gas. Furthermore, the unconverted gas dilutes the concentration of ammonia before entering the second bed; see the third picture in Fig. 5.19. We see that the profile of ammonia concentration tries to follow a path parallel to the equilibrium line. After the fourth bed, the gas is used as a hot stream for the initial heating of the feedstock. Heat integration is inherent in the design of these reactors, and these converters are used in high-capacity facilities. One of the most famous designs of the quench converter is the four-bed Kellogg converter, which has been installed more than 100 times (see Fig. 5.20). We can classify different designs of multibed reactors based on the flow direction across the catalytic beds.

Axial flow converters, such as the one shown in Fig. 5.20, cannot increase their capacity by increasing their diameter because of economic and technical reasons, and therefore they can achieve high yield only by increasing the depth of the catalytic bed. However, this solution increases the pressure drop. In order to mitigate it, larger catalytic particles are used, but they have lower activity. Radial flow converters do not demonstrate this problem, so they can increase their production capacity using smaller particles with low-pressure drop and moderate diameters. The drawback of this design is the need for better sealing to avoid leakages across the materials.
Casale presented the concept of axial and radial flow to address the problem of radial flow converters. In these kinds of converters, the annular catalyst bed is left open at the top to permit a portion of the gas to flow axially through the catalyst. The remainder of the gas flows radially through the bulk of the catalyst bed. Crossflow presents an alternative design to allow for a low-pressure drop, even with small catalytic particles. It was used by Kellogg in their horizontal quench converter. The catalysis beds are arranged side-by-side in a removable cartridge so that it is easy to load and unload catalyst. The gas flows from top to bottom.
Multibed reactors with indirect cooling are known by the classical Montecatini process. The design uses pipes with hot pressure water in a closed circuit to cool down the gases. Fig. 5.21 shows the operation. The gas is fed from the bottom and the feedstock is heated up in the lower heat exchanger and led to the first bed through the interspace between the inner and outer tubes. In the first bed, the gas reacts and is allowed to heat up until its temperature reaches 500°C, at which point the catalytic bed ends and the gas is cooled using hot water (Appl, 1999). Since there is no contact between the cooling agent and the gas (first picture of Fig. 5.21), after each bed the composition in ammonia remains constant. After four beds, the hot converted gas is used as a hot stream to heat up the feedstock. Heat integration is therefore already part of the reactor design.

Apart from this basic design, there are some modified converters that also use indirect cooling such as the Topsoe Series 200, a radial flow reactor that has internal heat exchangers (Fig. 5.22A), the Topsoe Series 300 (Fig. 5.22B), the Casale design (Fig. 5.22C), and the Kellogg alternative horizontal design for indirect cooling (Fig. 5.22D).

Multibed reactors such as the ones depicted in Figs. 5.19 and 5.21 can be analyzed following Example 7.7 by means of an adiabatic energy balance to each of the beds and the mass balance provided by the equilibrium.
Tube converters
Tube converters provide an alternative design for the removal of the energy generated in the reaction. In this case the catalyst is packed into pipes that are the ones responsible for heating up the feed. The designs available are appropriate for low-capacity facilities. Furthermore, temperature control is slow and it is difficult to mitigate oscillations in the temperature. Two designs are presented, Fig. 5.23 for countercurrent flow, and Fig. 5.24 for concurrent flow. In the first design, the main feed stream enters from the bottom of the converter. It is heated up in the lower heat exchanger using the hot product gases, and ascends through pipes as it is further used to cool down the reaction gases. Then it is fed to the catalytic pipes where it reacts. The heat integration, as seen in the central picture of Fig. 5.23, is carried out with the same gas as that which is going to react later. Additional feed is used to cool down the vessel walls. The conversion accelerates across the pipes and there is a peak in temperature along the catalyst. In Example 5.6, a simplified version of this reactor is modeled.


Fig. 5.24 shows an alternative design where the cooling gas and the reacting mixture flow parallel and in the same direction. The feed enters the reactor from the top. It is also used to control the leakages of hydrogen by forcing its flow between the inner and outlet structures of the reactor. Next, it is heated up to reaction temperature in the lower heat exchanger, and by means of a system of pipes, fed parallel to the pipes containing the catalyst so that both gases descend and exchange heat. The hot feed is then guided to enter the catalyst. In the second picture of Fig. 5.24 is the profile of temperature across the reactor, which presents two peaks due to the change in direction of the feed. In the third picture of the same figure, the content of ammonia is presented as it matches a subequilibrium line.
Example 5.6
The original problem was described by Murase et al. (1970) and models the operation of an ammonia reactor with the configuration shown in Fig. 5E6.1. It is assumed that there is no axial mass or heat transfer, that the temperature at the catalytic region is the same as at the catalytic particle, the heat capacities of the gases are constant, and the activity of the catalyst is 1. We also assume that the pressure drop can be computed using Ergun’s Equations. This example is well-known in the literature, however, in this text the model is solved in gProms.

Energy balance to the feed:
U: Overall heat transfer coefficient (500 kcal/m2 h·°C)
S1: Surface area of cooling tubes per unit length of reaction, 10 m
Tg: Temperature of reacting gas (°C)
Tf: Temperature of the feed (°C)
Reactant gas energy balance: