

4 Techniques
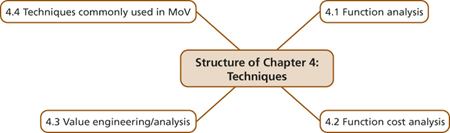
Figure 4.1 Structure of Chapter 4
This chapter describes the techniques supporting MoV processes and has been split in two parts:
![]() MoV-specific techniques, forming the first three sections
MoV-specific techniques, forming the first three sections
![]() Those techniques that are commonly used in MoV but also used elsewhere, forming the remainder of the chapter.
Those techniques that are commonly used in MoV but also used elsewhere, forming the remainder of the chapter.
4.1 FUNCTION ANALYSIS
Function analysis is a key technique in MoV and underpins its second principle – analysing what things do rather than what they are and avoiding looking at ideas until functions are visibly mapped. As used in MoV, function analysis is very closely focused on customer needs and wants.
A function consists of an active verb and a measurable noun. A qualifying adjective or phrase, including a performance metric if possible, may be used if this adds clarity (for example ‘Implement system’, ‘Implement computerized system’ and ‘Implement web-based system’ are significantly different, spanning a considerable range of complexity), but generally the simpler the statement, the better it will be for generating alternatives. The introduction of the qualifying adjective or phrase is, however, critical when using function analysis to define a project and the expected levels of quality and performance (for example, ‘Implement grade A computerized system’ where grade A provides specification of performance characteristics).
There are several methods of function analysis. The objectives of the analysis are:
1 To gain clarity of understanding of the project aims and to identify what needs to be done in order to achieve those aims
2 To stimulate creativity in the search for different ways to perform the identified functions.
The fundamental logic underlying all function analysis is to ask ‘Why (do we want to do this)?’ to move from Leans to higher-order functions and to ask ‘How (do we propose to do it)?’ to move in the opposite direction.
There are two main methods of function analysis: Function Analysis Systems Technique (FAST) and value trees.
4.1.1 Function Analysis Systems Technique (FAST)
FAST is a diagrammatic representation of functions and their hierarchy. FAST works by asking how the functions relate to each other. There are three main forms of FAST diagram:
![]() Traditional: designed to describe what the component parts of the study subject must do. It can be applied at any level.
Traditional: designed to describe what the component parts of the study subject must do. It can be applied at any level.
![]() Technical: similar to traditional FAST, but, in addition, seeks to capture a time-based relationship, and functions that happen all the time sit separately from the critical path functions. It is generally used at subsystem or component levels.
Technical: similar to traditional FAST, but, in addition, seeks to capture a time-based relationship, and functions that happen all the time sit separately from the critical path functions. It is generally used at subsystem or component levels.
![]() Customer: focuses on customer requirements or needs. Functions describe what the customer expects to get, rather than exactly what the product or service does.
Customer: focuses on customer requirements or needs. Functions describe what the customer expects to get, rather than exactly what the product or service does.
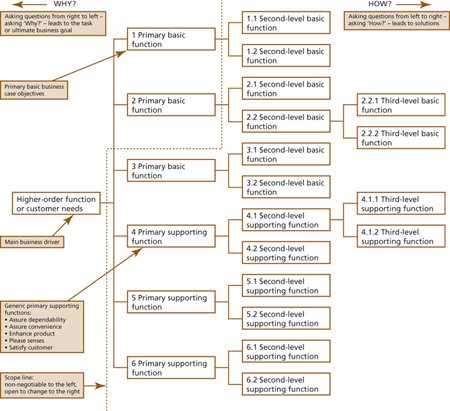
Figure 4.2 A customer FAST diagram
Figure 4.2 shows a generic customer FAST diagram. The business or project objective (or customer need) is on the left and the primary functions stem from it by asking the question ‘How (do we do this)?’ The organizational objective for a product never changes unless the business case changes in response to a change in policy. This would also apply to each project within a programme, which would relate to the organizational objective for that programme. The project objective or customer need may also be known as the higher-order function of the project. Each of the primary functions contributes to fulfilling the higher-order function. Primary basic functions are essential to the existence of a product. Primary support functions are those that differentiate one product from another similar one.
Generic supporting functions may be categorized under five headings: assure dependability; assure convenience; enhance product; please senses; satisfy customer. These are grouped together if all have been identified as necessary and sufficient to achieve the project objectives in full. Repeatedly asking the question ‘How?’ generates secondary, tertiary and further Leans. Reading the diagram from left to right shows how the primary functions will be delivered. The diagram stops at the right-hand side when the next answer ‘How’ would not be a function but a technical solution or product.
As read from right to left, it shows why the Leans are needed. As a result, changing a higher-order function will lead to change in Leans, as the reasons for the functions have changed.
Functions on the left-hand side (closest to the project objectives or higher-order function) are said to have the highest levels of abstraction (see also section 2.2.3). Moving towards the right-hand side of the diagram, the functions have a lower level of abstraction. The lowest level of abstraction is a tangible solution or product. The higher the level of abstraction, the greater is the potential for adding value.
A complex project may give rise to a great number of functions to examine for inclusion in the diagram. To do this thoroughly, FAST diagrams need significant effort and time to develop. You cannot do them quickly!
It is often the case when developing a FAST diagram that Leans are confused with solutions to delivering the higher-order functions. This is not desirable, as potential solutions are generated later in the process (see section 4.4) so these entries are excluded from the diagram. The primary functions are normally arranged in priority order, with the more important nearer the top of the chart.
Classic FAST and technical FAST are seldom used for project MoV. They are very precise and provide an excellent way to describe the functions in a product or a process. It can be a rather laborious method of describing a whole project.
FAST diagrams have additional conventions, not shown in Figure 4.2:
![]() If two or more functions must be delivered simultaneously, a ‘When?’ connection will be inserted.
If two or more functions must be delivered simultaneously, a ‘When?’ connection will be inserted.
![]() If two or more lower-order functions must be satisfied for a higher-order function to be achieved, an ‘and’ connection will be used.
If two or more lower-order functions must be satisfied for a higher-order function to be achieved, an ‘and’ connection will be used.
![]() In some cases, there is more than one way to achieve a higher-order function, in which case the ‘or’ connection will apply.
In some cases, there is more than one way to achieve a higher-order function, in which case the ‘or’ connection will apply.
These connections are shown in Figure 4.3. Because a customer FAST diagram indicates a customer’s expectations, the ‘or’ connection is not usually relevant in MoV.
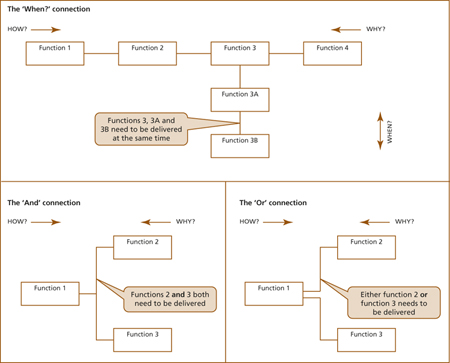
Figure 4.3 ‘When?’, ‘And’ ‘Or’ FAST diagram connections
Example
A contract with a government ministry involved the delivery and maintenance of multiple projects throughout the UK.
An integrated value management process was developed in collaboration with the ministry’s estates department, commencing with a workshop to identify the statement of requirements for each project. A series of value management workshops then followed to explore options and select the best-value solution as the basis of the project brief and then to optimize the design to ensure that the project designed represented value for money.
The process enabled year-on-year cost savings in addition to improvements in project delivery times and the quality of the finished buildings. The integrated value management process also reduced the amount of design iteration leading to greatly improved productivity during the design stage.
A summary of the function diagram developed for this programme is illustrated in Figure 4.4.
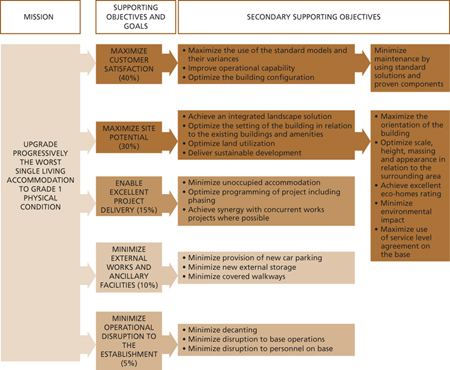
Figure 4.4 Function diagram for a government ministry contract (see example in text)
4.1.2 Value trees and useful derivatives
A value tree is a diagram that shows the relationship between, and the hierarchy of, value drivers. Arranging value drivers into a value tree greatly assists project team members in gaining a common understanding of the project imperatives.
Figure 4.5 illustrates a simplified value tree for a new hospital. Value drivers are normally expressed with an active verb, a qualifying adjective and a measurable noun. The project objectives should be expressed in SMART terms, that is to say: Specific, Measurable, Achievable, Realistic and Timebound. The value tree provides a simple but precise method of conveying the function that needs to be fulfilled and also the level of quality that is required.
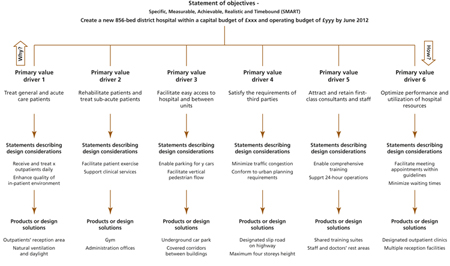
Figure 4.5 Value tree for a new hospital (simplified)
4.1.2.1 Value profiling
Once a value tree has been developed, it is possible to prioritize the relative importance of the primary value drivers to the client body and end users. The resulting diagram is called a value profile. This provides a powerful tool for making decisions and selecting options based on value. Because many of the judgements in prioritizing the value drivers may be subjective (albeit balanced by involvement of all key stakeholders) it is good practice to apply sensitivity analysis6 to the finished model.
The value profile may be used to quantify value and provides a means of analysing current performance against desired performance, thus focusing attention on where effort needs to be applied to improve value.
This exercise can be conducted at any level from portfolio to project. Chapter 7 describes how establishing an organization’s value profile informs the development of its MoV policy and implementation plans. An example of a project-level value profile is given in Figure 4.6.
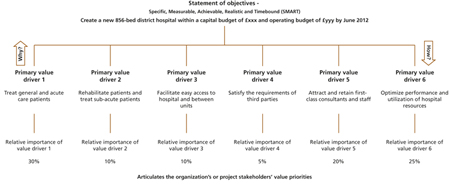
Figure 4.6 Value profile (for the same hospital as Figure 4.5)
The assessment of value priorities should be done by the programme owners or project sponsors and end users since it contributes to their organization’s strategy. It should not be done by third parties such as their advisers.
Clearly, the assessment of some of the figures in a value profile can be subjective. Whilst the methods described elsewhere for achieving consensus on such figures will remove some of the subjectivity, results should always be tested for sensitivity to establish confidence in the figures.
For example:
![]() What is the confidence in the assessment of relative importance?
What is the confidence in the assessment of relative importance?
![]() Has the impact of potential changes in programme or project requirements been taken into account?
Has the impact of potential changes in programme or project requirements been taken into account?
![]() What is the potential impact of foreseeable external change events?
What is the potential impact of foreseeable external change events?
In addition, those assessing the figures should take account of the risks that may be associated with the delivery of each value driver.
Principal uses for the value profile
![]() For the organization, at strategic or portfolio level, articulating the organization’s value priorities
For the organization, at strategic or portfolio level, articulating the organization’s value priorities
![]() For a programme, providing the means of achieving consistency across the contributing projects
For a programme, providing the means of achieving consistency across the contributing projects
![]() For a project, articulating project objectives and the key project requirements in plain language
For a project, articulating project objectives and the key project requirements in plain language
![]() Maximizing value consistent with an organization’s value priorities
Maximizing value consistent with an organization’s value priorities
![]() Making decisions based on maximizing value
Making decisions based on maximizing value
![]() Redistributing resources to where they add the greatest value
Redistributing resources to where they add the greatest value
![]() Trading off use of resources in one area with another to maximize value.
Trading off use of resources in one area with another to maximize value.
4.1.2.2 Simple multi-attribute rating technique
This technique uses similar logic to the value profile. It is a method of distilling meaningful measures of value by use of a ‘simple, multi-attribute rating technique’ or SMART (not to be confused with the identical acronym in the previous section for describing project objectives!). It combines traditional value engineering with soft-systems thinking. It is used both at the concept stage and, once the concept has been developed, later in the project lifecycle, to simplify the value tree such that value drivers are limited to those that can be measured. In the latter case, for example, it is a given that a building must conform to safety standards and so all value drivers relating to safety will be removed, as these will have to be present in all the options. Further references on SMART are given in Appendix B.
4.1.2.3 Value index
The value index provides a measure of how well an option, project or product satisfies an individual value driver or the aggregate of all value drivers. It represents a measure of customer satisfaction. Once the value profile has been formed, the team needs to agree an appropriate metric for each value driver. For some, such as ‘enhance productivity’, this is simple because they can be related to a tangible measure such as income. For others, such as ‘satisfy community expectations’, a less tangible measure such as the result of a survey may be necessary. For each metric the team needs to agree a range, from ‘unacceptable’ (if performance is below this level, improvements must be made or the project will fail) to ‘delight’ (if performance is at this level, it will satisfy the most optimistic expectations). This range, from 1 (unacceptable) to 10 (delight), provides a relatively simple method of assessing performance.
The product of the value driver weighting and the performance rating provides a number which is known as a value score. The sum of all value scores across all value drivers is the value index. By adopting the ranges indicated above, the value index must lie between 100 and 1,000. As a rule of thumb, a value index of 350 or less indicates poor performance, which must be improved, signalling an urgent need to carry out a formal MoV study. A value index exceeding 750 is regarded as good. Perfection at 1,000 is, unfortunately, most unlikely.
Table 4.1 illustrates the calculation of the value index for the new hospital example used earlier in this chapter.
Table 4.1 Value index (for the same hospital as in Figure 4.5)
| Value driver | Relative importance (weight, as %) | Metric | Performance (scale of 1 to 10) | Value score (= weight × performance) |
|
Treat general and acute care patients |
30 |
Capacity for treating patients successfully |
8 |
240 |
|
Rehabilitate patients and treat sub-acute patients |
10 |
Time to appropriate discharge |
5 |
50 |
|
Facilitate easy access to hospital and between units |
10 |
Time to access hospital and between units |
4 |
40 |
|
Satisfy the requirements of third parties |
5 |
Obtaining statutory and other consents |
7 |
35 |
|
Attract and retain first-class consultants and staff |
20 |
Quality of facilities |
6 |
120 |
|
Optimize performance utilization of hospital resources |
25 |
Management procedures, departmental adjacencies and operating costs |
5 |
125 |
|
Value index (= sum of all value scores) |
610 | |||
Principal uses of the value index
![]() Providing a measure of how well objectives are being met, at organizational, programme or project levels and the level of effort required for a formal MoV study.
Providing a measure of how well objectives are being met, at organizational, programme or project levels and the level of effort required for a formal MoV study.
![]() Enabling the measurement of overall value, including monetary and non-monetary value drivers (but not showing whether the benefits represent value for money).
Enabling the measurement of overall value, including monetary and non-monetary value drivers (but not showing whether the benefits represent value for money).
![]() Indicating the contribution of each value driver to the overall value index, thus showing where to concentrate effort to improve value.
Indicating the contribution of each value driver to the overall value index, thus showing where to concentrate effort to improve value.
Whilst the value index demonstrates how well a project satisfies the requirements of key stakeholders (represented by the value drivers), it does not provide any indication of whether value for money is delivered, by either the individual value drivers or by the project as a whole.
4.1.2.4 Value metrics
When setting metrics on which to assess performance or base targets, it is preferable that they should be as objective as possible and essential that existing reporting systems are capable of producing them regularly. Metrics may be set for hard and soft attributes and for monetary or non-monetary benefits.
One person should also be tasked with monitoring all metrics reported to the organization, as proliferating measures can lead to extra work without this coordination. Best results will be produced if the relationship between value drivers, or key performance indicators, and the specified measure is made clear.
In defining metrics to use against a given value driver, there is a useful checklist of questions:
![]() What measurable factors influence this outcome?
What measurable factors influence this outcome?
![]() How do changes in achievement of the value driver affect performance measures? Can these differences be detected incrementally?
How do changes in achievement of the value driver affect performance measures? Can these differences be detected incrementally?
![]() Are any of these changes measured by other means (e.g. via a regular report that can be used for this purpose)?
Are any of these changes measured by other means (e.g. via a regular report that can be used for this purpose)?
Once metrics have been defined, the following process (or a similar series of steps) is very helpful in ensuring efficient monitoring:
![]() State the value driver
State the value driver
![]() Name the metric
Name the metric
![]() Define and describe the metric
Define and describe the metric
![]() Name a metric owner, responsible for ensuring this data is gathered and reported
Name a metric owner, responsible for ensuring this data is gathered and reported
![]() Describe a method of capturing the metric information
Describe a method of capturing the metric information
![]() Identify possible sources of benchmark data (this is useful for future studies)
Identify possible sources of benchmark data (this is useful for future studies)
![]() Report frequency
Report frequency
![]() Decide who needs to see it.
Decide who needs to see it.
For each project type, there should be fewer than ten value drivers, so the number of metrics should be manageable. The value metrics will form part of the lessons-learned database, if there is one, in order to develop improved feedback.
Once it has been confirmed that the metric is appropriate, it can be used to measure the same value driver in future MoV studies.
4.1.2.5 Value for money ratio
The value for money ratio7 shows an assessment of value for money, taking into account monetary and non-monetary benefits. To calculate it, the value index should be divided by the total estimated project cost, preferably in whole-life terms, to provide a value for money ratio as shown in Table 4.2. A project with a very high value index may not give best value for money if it costs significantly more than an alternative that provides only slightly lower performance.
The value for money ratios for individual value drivers provide a means of focusing MoV effort on those value drivers that provide least value for money and enable the team to redistribute resources to where they will provide greater value.
A value for money ratio can be used in option selection. It is also helpful to monitor progress during the development of a project and should be conducted at key project milestones. There is a need to ensure consistency of cost measure (here, £ m) to result in a figure that attracts the attention of senior management.
Table 4.2 The value for money ratio (for the same hospital as in Figure 4.5)
|
Value driver |
Relative importance (weight, as %) |
Metric |
Performance (scale of 1 to 10) |
Value score |
Cost of delivery (£ m) |
Value for money ratio (= value score or index/cost) |
|
Treat general and acute care patients |
30 |
Capacity for treating patients successfully |
8 |
240 |
133 |
1.80 |
|
Rehabilitate patients and treat sub-acute patients |
10 |
Time to appropriate discharge |
5 |
50 |
60 |
0.83 (lowest value for money) |
|
Facilitate easy access to hospital and between units |
10 |
Time to access hospital and between units |
4 |
40 |
30 |
1.33 |
|
Satisfy the requirements of third parties |
5 |
Obtaining statutory and other consents |
7 |
35 |
20 |
1.75 |
|
Attract and retain first-class consultants and staff |
20 |
Quality of facilities |
6 |
120 |
24 |
5.00 |
|
Optimize performance utilization of hospital resources |
25 |
Management procedures, departmental adjacencies and operating costs |
5 |
125 |
13 |
9.62 (highest value for money) |
|
Total |
610 |
280 |
2.18 |
Principal uses for the value for money ratio
![]() Dividing individual value scores by the total cost of delivering each value driver provides a measure of value for money.
Dividing individual value scores by the total cost of delivering each value driver provides a measure of value for money.
![]() Providing a value for money ratio for each value driver and the project as a whole helps to focus value-improving effort on those parts which are delivering lowest value for money.
Providing a value for money ratio for each value driver and the project as a whole helps to focus value-improving effort on those parts which are delivering lowest value for money.
![]() Selecting options.
Selecting options.
Example
The Californian transport authority, Caltrans, regularly uses the above methods to maximize value on its infrastructure projects. In one such example, a value engineering study on the Antlers Bridge replacement project resulted in a 10% reduction in capital costs and a 35% increase in value, taking all factors (including operational, construction, environmental and performance) into consideration.
This case study is reproduced in full in the OGC document Value Management in Construction Case Studies, available on the OGC website:
4.2 FUNCTION COST ANALYSIS
The ability to estimate the costs of value drivers (or functions), in conjunction with the relative importance of the value drivers, enables the MoV team to assess whether a particular value driver represents good value for money. Whilst fulfilling a value driver is essential to achieving the project objectives, this should not be done at any cost.
Some methods of estimating project costs are based on elemental or product costs. In such cases, one method of estimating function costs is to draw up a matrix of elemental costs on one axis and functions on the other. The total cost of each component is then distributed across the functions to which they contribute. In manufacturing and construction, the information to do this is reasonably accessible. In other situations, for example service delivery, activity-based costing8 is needed to avoid excessive subjectivity.
Effectively, when applying costs to a function model, one is converting component cost drivers (generally arising from the use of the resources consumed in delivering them) into activity-based costs, if this is not already their format.
4.2.1 Cost/worth
Sometimes known as ‘cost to function’, cost/worth is a method of function analysis which examines the cost of performing each function shown in a FAST diagram. The team then decides the lowest cost at which each of the necessary functions could be performed, which is then taken as the function’s worth. Comparing the current cost to the assigned worth reveals subjects for further discussion. The cost of performing each function is estimated from the cost of the elements or products that are necessary to deliver the function. There is a risk that if a function is taken in isolation, it may lead to unacceptable cost-cutting. This is because some of the supporting functions must also be delivered to meet customers’ needs.
The most effective way to avoid the risk of inappropriate cost-cutting leading to value reduction is to apply costs to a full function diagram, where all relationships will be more apparent.
4.3 VALUE ENGINEERING/ANALYSIS
This is a defined application of recognized techniques for generating alternative actions to improve value through balancing function and cost without detriment to quality. It is sometimes also called value analysis9.
Value engineering (VE) is a method that brings many of the above processes together into one coordinated study. It is the original process introduced in the USA shortly after the Second World War and, whilst it too has evolved in sophistication, it remains the most commonly used method within the MoV family.
Its primary purpose is to improve value in an existing design or set of circumstances by studying in detail two fundamental questions:
![]() What functions must be delivered?
What functions must be delivered?
![]() How else can they be performed?
How else can they be performed?
VE comprises eight steps, usually referred to as phases. Together they form the VE job plan illustrated in Figure 4.7.
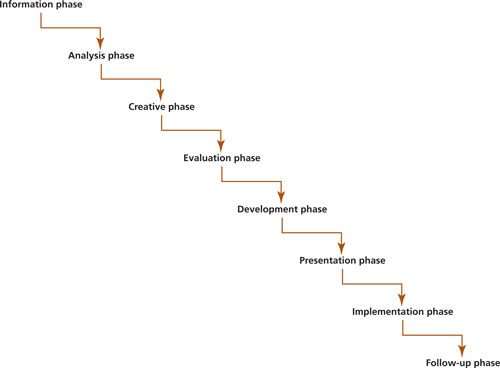
Figure 4.7 The value engineering job plan
The VE study will be arranged and facilitated by a skilled study leader and normally comprises a period of gathering and analysing information before convening a workshop at which all key project stakeholders will be present. At the end of the workshop or shortly thereafter, the team will present their findings and recommendations to a decision-making panel and agree an implementation plan. Value-improving proposals will then be implemented by the project team.
4.3.1 Information phase
This initial phase contains all of the processes discussed in section 3.2. It is initiated by a meeting with a few key stakeholders to gain an understanding of the project in question, the challenges faced, the purpose of the study, those who should be present, and other logistical details. This meeting may be run in workshop format and is often named the ‘pre-event’. If the information needed is not available at this initial meeting, the study leader will gather it over the next few days, whilst also arranging the venue and inviting participants to the workshop.
4.3.2 Analysis phase
This phase is started before the workshop and completed during it. It contains many of the processes given under section 3.3. Before the workshop, the study leader will review the information and ensure that it is consistent and up to date. This may involve reconciling differences between, for example, drawings and cost estimates. Items that will aid the workshop team’s understanding of the issues involved, such as cost models, are prepared. It is also possible to prepare a draft function analysis in advance of the workshop, although this is ideally done with the team. The latter approach, although it extends the workshop duration, ensures that all workshop team members have the opportunity to contribute fully to its creation, thus increasing their buy-in and understanding of the functions that drive the project. The study leader will, with assistance from the project cost analysts, allocate costs to the function model if appropriate or practical.
Function analysis identifies four classes of potential value mismatches:
![]() Those functions which add cost but do not add to stakeholder benefits – delete if possible or minimize
Those functions which add cost but do not add to stakeholder benefits – delete if possible or minimize
![]() Those functions that add appropriate stakeholder benefits but at an excessive cost – reduce cost
Those functions that add appropriate stakeholder benefits but at an excessive cost – reduce cost
![]() Those functions that do not perform adequately to meet stakeholder benefits – improve
Those functions that do not perform adequately to meet stakeholder benefits – improve
![]() Required stakeholder benefits that are not being met – create functions to fill the shortcomings.
Required stakeholder benefits that are not being met – create functions to fill the shortcomings.
A workshop handbook is prepared by the study leader to guide all workshop team members through the workshop processes. At the beginning of the workshop the study leader will brief the team as to what to expect during the workshop and the roles they need to play, if this has not already been done in the information phase. Key project team members brief the team on any new information and the issues to be addressed.
4.3.3 Creative (or speculation) phase
Using the function (cost) analysis as a framework, the study leader will first invite the workshop team to highlight any areas of the project that hold particular potential for value improvement. The study leader then conducts a creative session with the team, usually through brainstorming, to capture as many ideas as possible for improving value.
4.3.4 Evaluation phase
The workshop team will then use the methods described later in this chapter to evaluate the ideas and select those that warrant further effort to develop into value-improving proposals.
4.3.5 Development phase
Either during the workshop or immediately after it, the workshop team will take the selected ideas and develop them into full value-improving proposals.
4.3.6 Presentation phase
The team will present their recommendations to a decision-making panel to agree which should be included in the project and agree an implementation plan. This session is chaired by the study leader and attended by the workshop team who developed the proposals. These processes are described in section 3.7 of this guide.
4.3.7 Implementation phase
After the agreement of the implementation plan, the study leader will compile a report on the VE study as a record of the event and a guide for the project team who will implement the value-improving proposals.
4.3.8 Follow-up phase
The full benefits arising from the VE study will only be realized if the implementation plan is rigorously followed through, progress monitored and appropriate remedial action taken if expectations are not being realized.
4.4 TECHNIQUES COMMONLY USED IN MOV
4.4.1 Information analysis
4.4.1.1 Benchmarking
This is defined as comparing performance or cost of an attribute of a project (or process) with other examples with similar characteristics. It is very useful to focus on anomalies identified by this process to define whether good value is being delivered or not.
There are many sources of information on techniques in this field. It is worth noting that, whilst any external comparison will be very informative, benchmarking exclusively with same-type organizations can mask opportunities for innovation. Benchmarking against a wider pool of other industries whose only common feature lies in the type of process being compared can yield some startling results.
4.4.1.2 Process mapping
Process mapping provides a method for understanding what is ‘business as usual’ and then illustrating potential future alternatives. It is particularly useful for representing processes diagrammatically to aid understanding in MoV studies aimed at improving operational efficiency. Different methods tend to emphasize different aspects of a process – for example responsibilities, information flows and product stages.
For each step in the process the analyst needs to understand information flows, roles, responsibilities and controls, an approximation of the resources it uses and the outputs that indicate the purposes which the process step serves (see Figure 4.8). Each process step may then be linked in a logical manner to provide a map of the whole process. Some processes may stretch beyond the organization and external parties will have to be involved in the mapping activity.
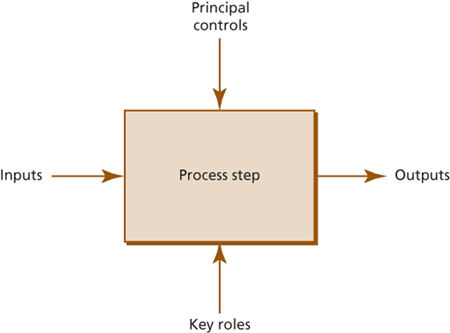
Figure 4.8 Typical process step
4.4.1.3 Root cause analysis
Root cause analysis is a combination of several techniques aimed at drilling down to the root of a problem in order to develop an appropriate solution. It involves five steps (see Figure 4.9). Repeated use of the question ‘Why?’ provides a rapid way to establish the root cause of a problem.
![]()
Figure 4.9 Root cause analysis
Root cause analysis focuses on underlying issues, rather than solving specific problems. It can be applied to a number of situations: for example, in improving processes, it will find unnecessary constraints and inadequate controls; in risk management, it can find unrecognized hazards. The technique can provide vital information on what needs changing and how to change it. It is helpful to quantify the impact of the problem. This provides a measure of the realizable benefit if the problem is resolved and assists in prioritizing where the effort should be applied.
The steps shown in Figure 4.9 can be undertaken in a number of ways, including use of ‘five whys’ (repeated use of the question ‘Why’ provides a rapid way to establish the root cause of a problem) and ‘fishbone analysis’ (which analyses a given problem under the headings of all factors affecting it). In both cases, a hierarchy of causes and effects can be established as a focus for developing improvements.
4.4.1.4 Discounted cash flow analysis
Discounted cash flow (DCF) analysis is a method of expressing future cash flows at current equivalent values. These flows can be sales, interest or dividends. The basic calculation is made by reference to the following formula:
![]()
where r is the discount rate and n the number of years.
This is normally the rate of inflation, but sometimes is a hurdle rate used within an organization.
There are many methods, but all do the same thing, which is to estimate the return on investment adjusted for the effect of time.
In any project there are three types of cost to be considered:
![]() Capital or one-off costs required to purchase the resources used to deliver the project.
Capital or one-off costs required to purchase the resources used to deliver the project.
![]() Periodic costs incurred in maintaining or replacing things once the project is complete and in use.
Periodic costs incurred in maintaining or replacing things once the project is complete and in use.
![]() Regular costs such as staff or consumables for operations.
Regular costs such as staff or consumables for operations.
When calculating the total cost of a project, these cannot be simply added together. DCF provides a method of calculating the total costs of a capital investment as it takes account of present and future cash flows. DCF may be used for estimating the net present value (NPV) of future cash flows. The present value (PV) of future cash flows will be heavily influenced by the discount rate applied, as the higher the rate the lower the value of future cash flows. The appropriate discount rate must be agreed with the project executive or manager. The PV for each cash flow may then be added to capital costs to arrive at the total net present value.
Care must be taken when estimating future cash flows since these are notoriously unreliable. (Who can forecast the cost of staff employment in ten years’ time with any accuracy?) Small changes in cash flow and the discount rate used can result in large differences in the final NPV. For this reason, DCF is usually used for a relatively short finite period, rather than just continuing to zero.
This method should be used when evaluating all value-improving proposals where the benefits are monetary, for example:
![]() The proposal may result in positive or negative future cash flows
The proposal may result in positive or negative future cash flows
![]() Comparison between alternative investments or projects is needed
Comparison between alternative investments or projects is needed
![]() Comparison is made between alternative investments or projects which have differing cash flow timing.
Comparison is made between alternative investments or projects which have differing cash flow timing.
The technique may be used in conjunction with the value index to take account of non-monetary benefits as well as monetary benefits. Ideally the costs used in calculating the value for money ratio should be expressed in NPV terms, but this is not always practical.
4.4.2 Idea generation
4.4.2.1 Brainstorming
Also known as braindumping, boardstorming, mind showering – this involves encouraging people to think up an idea and share it without prejudice. The method is capable of generating a large number of ways to improve value, varying in merit.
The study leader simply invites team members to come up with solutions and records these ideas in the originator’s own words in a way visible to all team members. By keeping ideas visible, other possibilities may be sparked off in people’s minds. This visibility of output helps generate further ideas, sometimes later in the session. Additional solutions can be added outside the workshop and still be included in the total for the study. Brainstorming can generate a large volume of ideas in a short period of time and will generally ensure that all parties are involved.
The function analysis model selected by the project should be used as a guide to ensure that all eligible areas for improvement are brainstormed. Focusing on other ways to perform functions also leads to more innovation than focusing on products. Sometimes it can help to give some guidelines for this – e.g. how can we satisfy two functions in one process?
Care must be taken not to discount any idea, no matter how foolish it appears at first. A unique identifier must be given to each proposal: this is essential to permit the tracking of suggestions from inception to implementation and also for use by future workshops. Although an idea may not be practicable at the time, if the situation changes in the future it could be developed into a very effective solution.
References to other creative techniques are provided in Appendix B.
4.4.3 Evaluation and option selection
The following techniques provide ways to select the most advantageous ideas from a number that may have been generated during the idea generation stages of an MoV study.
4.4.3.1 Option evaluation matrix
The value profile provides an excellent way to assess the merits of different options using an option evaluation matrix (see Table 4.3). This method is appropriate where there are a small number of options from which to choose.
The relative performance of each option against the weighted primary value drivers is assessed by the MoV team. This enables calculation of a value score for each option, the highest score indicating the option that best satisfies the project objectives (represented by the weighted value drivers). Division of the value score by the cost of delivering the option provides a measure of value for money known as the value index. The option resulting in the highest value index is likely to provide the best value for money.
The above analysis needs to be reviewed carefully and tested for sensitivity in assessing the performance of each option against the value drivers, since this may be subjective. The results of this method should be regarded as a guide to selection and further validated by other methods.
A form for an option evaluation matrix is given in Appendix A. A simplified example of the use of this form is given in Table 4.3.
Table 4.3 An example of an option evaluation matrix
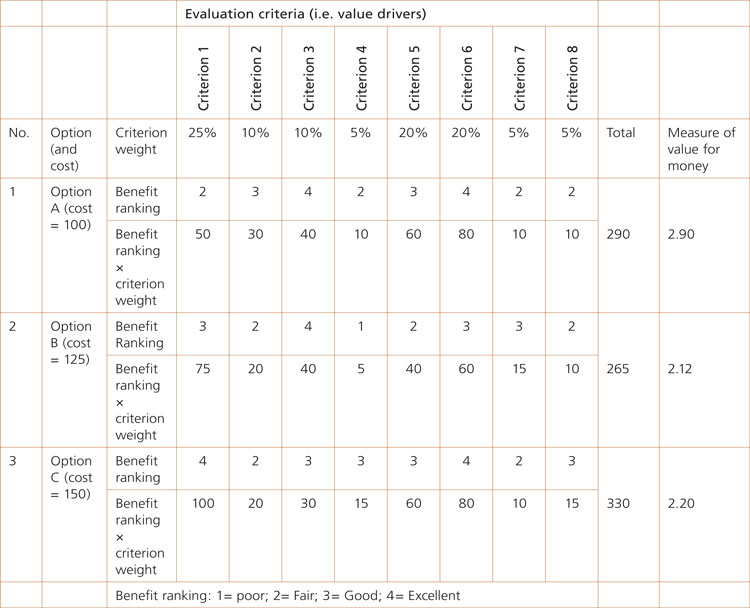
The following six actions should be considered before reaching the option selection stage of a given study:
![]() Select criteria (usually the primary value drivers)
Select criteria (usually the primary value drivers)
![]() Define scale of improvement required and sensitivity ranges
Define scale of improvement required and sensitivity ranges
![]() Establish weights for relative importance
Establish weights for relative importance
![]() Rank the benefit of each option against the criteria
Rank the benefit of each option against the criteria
![]() Calculate benefit ranking × weight
Calculate benefit ranking × weight
![]() Apply sensitivity analysis to confirm robustness of value index.
Apply sensitivity analysis to confirm robustness of value index.
The most feasible options in terms of costs, benefits and risks are presented for decision during the decision-building meeting. In this meeting, the owner of each idea or scenario presents their proposal to those with decision-making power. This ensures ownership of the idea and its implementation, if agreed. The recommendation will include a detailed description of both the existing situation and the solution, together with advantages and drawbacks of all the alternatives considered. Each of these will show assessed impacts in terms of cost, time and quality: there is a checklist in Appendix A for a value-improving proposal development form to ensure completeness. The owner will describe the implementation plan.
4.4.3.2 Allocation to categories
Where there are a large number of ideas from which to select, an effective technique is to identify a number of criteria against which each idea is assessed. In the resulting discussion, the study leader will broker a consensus with the MoV team to categorize each idea. Typical categories might be:
![]() Unanimous agreement that the idea warrants further development starting now.
Unanimous agreement that the idea warrants further development starting now.
![]() The idea has potential but there is insufficient information to develop it now. It requires further research or testing.
The idea has potential but there is insufficient information to develop it now. It requires further research or testing.
![]() The idea has potential but cannot, for reasons which should be recorded, be developed in this project. Record the idea for possible use in other similar projects.
The idea has potential but cannot, for reasons which should be recorded, be developed in this project. Record the idea for possible use in other similar projects.
![]() The idea is not appropriate and should be discarded.
The idea is not appropriate and should be discarded.
This technique is quick and allows plenty of discussion around the merits and demerits of the idea, which promotes sound selection.
4.4.3.3 Idea selection matrix
An even quicker way to select the most promising ideas from a large number of suggestions is to use a selection matrix (see Figure 4.10).
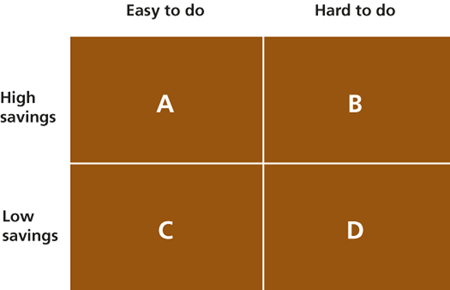
Figure 4.10 Idea selection matrix
The axes of the matrix reflect the grounds on which decisions will be based, for example easy or hard to implement with high or low cost savings.
Ideas are placed in one of the four quadrants of the matrix.
Clearly, ideas that are easy to implement and result in high cost savings will normally warrant development. Those that are easy to develop and result in low cost savings may be worth the effort to develop. Likewise those that are hard to implement but could result in high savings may also warrant development. Those that are hard to implement and would result in low savings are unlikely to be worth developing.
4.4.4 Weighting techniques
In order to prioritize value drivers, it is necessary to have an objective method of weighting them. It is important to choose a method that minimizes the contributors’ ability to bias the results.
All weighting methods involve a measure of subjectivity and should therefore be used as a guide to decision-making rather than be interpreted as fact.
4.4.4.1 Paired comparisons
This method ranks items by comparing all possible pairs in a given list of attributes and selecting one from each pair at each comparison. It enables option selection and alternatives to be reviewed in order to support decision-making. This technique requires that team members compare the relative performance of two items at a time, creating a chart of all responses and totalling the results (see Figure 4.11). These results are then translated into percentages. This method provides a robust and reasonably objective means of assessing the relative weighting of attributes. Whilst it can be quite time-consuming to implement, it is highly effective in achieving consensus.
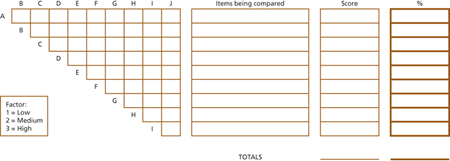
Figure 4.11 Paired comparison matrix
4.4.4.2 Points distribution
The team is given 100 points to allocate between ideas. The total points allocated are divided by the number of contributors and then converted to percentage weightings for each.
Care must be taken that the contributors are truly representative of all decision-makers. For this reason, the study leader needs to agree on a fair representation for each stakeholder before starting the comparison.
If individual weightings are very disparate, the average cannot be taken as representative and a convergence tool, such as Delphi10, should then be used.
4.4.5 Developing value-improving proposals
The outputs from the selection techniques above will be a list of ideas or options that warrant development into a detailed value-improving proposal (VIP). It is the responsibility of the owner of each selected idea or option (allocated during the selection process) to develop each proposal.
These should be summarized in a standard format, such as that provided in Appendix A, which contains all the information needed for the decision makers to exercise their judgement as to whether to implement the VIP in total, partially or not at all.
4.4.5.1 Cost benefit analysis
This is a method of assessing the cost of implementing a proposal against the benefits it will deliver over the long term. Normally used in conjunction with discounted cash flow, it assists business case decisions. Often used in MoV in studies of process or procedure, it can be combined with many other tools, e.g. process mapping and option selection.
In the UK, the approach to cost benefit analysis (CBA) in central government is set out in HM Treasury’s Green Book, which recommends that ‘all new policies, programmes and projects … should be subject to comprehensive but proportionate assessment, wherever it is practicable, so as best to promote the public interest.’
4.4.5.2 Decision-building meeting
The study leader should convene and chair a decision-building meeting at which proposal owners present their suggestions to a panel of senior managers. The purpose of this meeting is to discuss the findings of each proposal and agree whether or not it should be implemented in whole or in part. Each of the value-improving proposals selected for implementation is allocated to an owner who is responsible for its implementation.
The decisions are recorded and form the basis of the proposal implementation plan. This plan provides the project managers with details of proposals, how and when they will be implemented and the expected value improvements (or benefits). This allows them to monitor and manage the implementation process (described in section 3.7).
4.4.6 Implementing VIPs and follow-up
4.4.6.1 Implementation plans
Once the value-improving proposal form has been presented and accepted for further development, a method is needed for the study team to implement its value enhancement. At this stage, there are usually some guesstimates in cost benefit values, and the practicalities of a delivery plan may not be fully considered. It may therefore be necessary to add another step to the process.
Building on the value-improving proposal form template given in Appendix A, the proposal owner will need (in liaison with the study leader as coordinator, as there will be other proposal owners) to:
![]() Revisit the proposal to ensure that claimed advantages, drawbacks and cost calculations are robust
Revisit the proposal to ensure that claimed advantages, drawbacks and cost calculations are robust
![]() Develop an implementation plan, with assigned human resources
Develop an implementation plan, with assigned human resources
![]() Draw up a timetable for delivery, giving milestones as appropriate
Draw up a timetable for delivery, giving milestones as appropriate
![]() Agree the progress-reporting schedule.
Agree the progress-reporting schedule.
The proposal owners are responsible for ensuring that their proposals are implemented. The project executive or manager should take overall responsibility for their implementation. Regular progress reports should be included as part of the overall project-reporting system.
4.4.6.2 Feedback
The MoV study report and regular updates feed back lessons learned (both for the MoV approach taken to a project and for the outcomes it provides). This feedback can be communicated as appropriate across the organization.
Involving people from across the organization and externally is a key strength of MoV: the best solutions to a given topic come from involving all relevant disciplines. Their positive contribution is essential and they should not merely become involved because it makes a change from normal day-to-day activities. The study leader must make it clear to the study team what they need to do, the study objectives, what may and what may not be challenged and the processes to be used. The study handbook will explain to them the resources that will be available, the timetable and the agenda for the study. If required, participants will be trained in the process, at least to awareness level, so that they can contribute fully. This applies equally to staff, consultants, suppliers and other stakeholders. The improved communication flowing from this collaborative work not only enhances the effectiveness of MoV in the study but will also have long-term benefits for the organization in building an appropriate culture.
4.4.6.3 Tracking benefits
It is worth noting that improvements arising from MoV proposals may need to be monitored for a considerable length of time, so that individual benefits can be clearly tracked, quantified and communicated to the organization. Whether this activity is managed via a benefits realization plan or simply via the regular MoV report, the method of monitoring and metric used must be sufficiently objective to stand up to independent review.
6 Sensitivity analysis involves testing the robustness of the model by varying the inputs (to reflect the risks that the assessments may not be accurate) and observing whether such variations make a significant difference to the outputs.
7 Optimization of value for money ratio fulfils the requirement of UK’s HM Treasury Green Book when affordability is an issue [ref clause 6.4]. If money is unlimited [ref clause 6.3] the relevant MoV measure is the value index.
8 Activity- based costing measures the cost and performance of activities, resources and the objects which that consume them in order to generate more accurate and meaningful information for decision-making. It tends to be driven by timesheets to gain a picture of activities, the time to undertake them and any other costs associated with their achievement.
9 Some literature draws a distinction between value engineering and value analysis, the former being applied to improve evolving designs and the latter being applied to improve existing products. The process for each is the same.
10 Delphi is a technique in which if there is significant disparity between contributors’ assessments of certain variables, they will discuss the reasons for their individual assessments. Having heard the arguments put forward by others they will reassess the variables. This usually leads to consensus after a few iterations. Further references to the Delphi technique are signposted in Appendix B.