Chapter 12
DSP Optimization – Memory Optimization
Chapter Outline
Compiler flags and flag mining
Target ISA for size and performance tradeoffs
Caveat emptor: compiler optimization orthogonal to code size!
Overview of memory optimization
Vectorization and the dynamic code-compute ratio
Data structures, arrays of data structures, and adding it all up!
Loop optimizations for memory performance
Introduction
Optimization metrics for compiled code are not always measured in resulting execution clock cycles on the target architecture. Consider modern cellular telephone or wireless device which may download executables over a wireless network connection or backhaul infrastructure. In such cases, it is often advantageous for the compiler to reduce the size of the compiled code which must be downloaded to the wireless device. By reducing the size of the code needed to be downloaded, savings are achieved in terms of bandwidth required for each wireless point of download.
Optimization metrics such as the memory system performance of compiled code are another metric which are often important to developers. These are metrics correlated to the dynamic runtime behavior of not only the compiled code on the target processor, but also the underlying memory system, caches, DRAM, and busses etc. By efficiently arranging the data within the application, or more specifically, the order in which data and corresponding data structures are accessed by the application dynamically at runtime, significant performance improvements can be gained at the memory system level. In addition, vectorizing compilers can also improve performance due to spatial locality of data when SIMD instruction sets are present and varying memory system alignment conditions are met.
The next section illustrates optimization techniques that may be used to improve application code size. The first techniques presented fall under the category of compiler ‘flag mining,’ which is the means by which different permutations of compile time options are used to achieve the desired results on generated code. In addition, the subject of lower level system details are presented such as application binary interfaces, and multiple encoding instruction set architectures as vehicles to further reduce code size in the presence of resource constrained systems.
Code size optimizations
Compiler flags and flag mining
In compiling a source code project for execution on a target architecture, it is often desirable for the resulting code size to be reduced as much as possible. Reasons for this pertain to the amount of space in memory the code will occupy at program runtime, as well as potentially reducing the amount of instruction cache needed by the device. In reducing the code size of a given executable, a number of factors can be tweaked during the compilation process to accommodate this.
Typically, users will first begin by configuring the compiler to build the program for size optimization, frequently using a compiler command line option such as –Os as is available in the GNU GCC compiler as of version 4.5. When building for code size, it is not uncommon for the compiler to disable other optimizations that frequently result in improvements in the runtime performance of the code. Examples of these might be loop optimizations such as loop unrolling, or software pipelining, which typically are performed in an attempt to increase the runtime performance of the code at the cost of increases in the compiled code size. This is due to the fact that the compiler will insert additional code into the optimized loops such as prolog and epilog code in the case of software pipelining, or additional copies of the loop body in the case of loop unrolling.
In the event that users do not want to disable all optimization or build exclusively at optimization level –O0 with code size optimization enabled, users may also want to disable functionality such as function inlining via either a compiler command line option or compiler pragma, depending on the build tools system and functionality supported. It is often the case that at higher levels of program optimization, specifically when optimizing for program runtime performance, compilers will attempt to inline copies of a function, whereby the body of the function code is inlined into the calling procedure, rather than the calling procedure being required to make a call into a callee procedure, resulting in a change of program flow and obvious system side effects. By specifying at either the command line option, or via a customer compiler pragma, the user can prevent the tools from inadvertently inlining various functions which would result in the increase in the overall code size of the compiled application.
When a development team is building code for a production release, or a user case scenario when debugging information is no longer needed in the executable, it may also be beneficial to strip out debugging information and symbol table information. In doing this, significant reductions in object file and executable file sizes can be achieved. Furthermore, in stripping out all label information, some level of IP protection may be afforded to the user in that consumers of the executable will have a difficult time reverse engineering the various functions being called within the program.
Target ISA for size and performance tradeoffs
Various target architectures in the embedded and DSP spaces may afford additional degrees of freedom when trying to reduce code size of the input application. Quite often it is advantages for the system developer to take into consideration not only the algorithmic complexity and software architecture of their code, but also the types of arithmetic required and how well those types of arithmetic and system requirements map to the underlying target architecture. For example, an application that requires heavy use of 32-bit arithmetic may run functionally correctly on an architecture that is primarily tuned for 16-bit arithmetic; however, an architecture tuned for 32-bit arithmetic can provide a number of improvements in terms of performance, code size, and perhaps power consumption.
Variable length instruction encoding is one particular technology that a given target architecture may support, which can be effectively exploited by the build tools to reduce overall code size. In variable length instruction coding schemes, certain instructions within the target processors ISA may have what is referred to as ‘premium encodings,’ whereby those instructions most commonly used can be represented in a reduced binary footprint. One example of this might be a 32-bit embedded Power Architecture device, whereby frequently used instructions such as integer addition are also represented with a premium 16-bit encoding. When the source application is compiled for size optimization, the build tools will attempt to map as many instructions as possible to their premium encoding counterpart in an attempt to reduce the overall footprint of the resulting executable.
Freescale Semiconductor supports this feature in the Power Architecture cores for embedded computing, as well as their StarCore line of DSPs. Other embedded processor designs such as those by ARM Limited and Texas Instruments’ DSPs have also employed variable encoding formats for premium instructions, in an effort to curb the resulting executable’s code size footprint. In the case of Freescale’s Power Architecture, Freescale states that both standard 32-bit code and 16-bit premium encoded code can be mixed interchangeably within the executable within a flash page size access basis. Other architecture may opt to specify the encoding within some format of prefix bits, allowing an even finer level of code intermingling.
It should be mentioned than often the reduced footprint premium encoding of instructions in a variable length encoding architecture often comes at the cost of reduced functionality. This is due to the reduction in the number of bits that are afforded in encoding the instruction, often reduced from 32 bits to 16 bits. An example of a non-premium encoding instruction versus a premium encoding instruction might be an integer arithmetic ADD instruction. On a non-premium encoded variant of the instruction, the source and destination operations of the ADD instruction may be any of the 32 general purpose integer registers within the target architecture’s register file. In the case of a premium encoded instruction, whereby only 16 bits of encoding space are afforded, the premium encoded ADD instruction may only be permitted to use R0-R7 as source and destination register, in an effort to reduce the number of bits used in the source and register destination encodings. Although it may not readily be apparent to the application programmer, this can result in subtle, albeit minor, performance degradations. These are often due to additional copy instructions that may be required to move source and destination operations around to adjacent instructions in the assembly schedule due to restrictions placed on the premium-encoded variants.
As evidence of the benefits and potential drawbacks of using variable length encoding instruction set architectures as a vehicle for code size reduction, benchmarking of typical embedded codes when targeting Power Architecture devices has shown that VLE (variable length encoding) enabled code has been shown to be approximately 30% smaller in code footprint size than standard Power Architecture code while only exhibiting a 5% reduction in code performance. Resulting minor degradations in code performance are typical, due to limitations in functionality when using a reduced instruction encoding format of an instruction.
Floating point arithmetic and arithmetic emulation may be another somewhat obfuscated source of code size explosion. Consider the case in which the user’s source code contains loops of intensive floating point arithmetic when targeting an architecture lacking native floating point functionality in hardware. In order to functionally support the floating point arithmetic, the build tools will often need to substitute in code to perform floating point arithmetic emulation at program runtime. This typically entails trapping to a floating point emulation library that provides the required functionality, such as floating point division, using the existing non-floating point instructions natively supported on the target architecture.
As one might predict, it is not uncommon for a given floating point emulation routine to require hundreds of target processor clock cycles to emulate the floating point operation, which execute over tens if not hundreds of floating point emulation instructions. In addition to the obvious performance overhead incurred versus code targeting a processor with native floating point support in hardware, significant code size increases will occur due to the inclusion of floating point emulation libraries or inlined floating point emulation code. By correctly matching the types of arithmetic contained in the source application with the underlying native hardware support of the target architecture, reductions in the overall resulting executable size can be achieved with some effort.
Tuning the ABI for code size
In software engineering, the application binary interface, or ABI, is the low level software interface between a given program and the operating system, system libraries, and even inter-module communication within the program itself. The ABI itself is a specification for how a given system represents items such as: data types, data sizes, alignment of data elements and structures, calling conventions and related modes of operations. In addition, a given ABI may specify the binary format of object files and program libraries. The calling convention and alignment may be areas of interest to those wishing to reduce the overall code size of their application by using a custom calling convention within their particular application.
A given target processor and related ABI will often specify a calling convention to be used between functions within the application, as well as calls to the underlying operating system, runtime libraries, and so forth. It is often desirable for a vendor to specify a default calling convention that affords a reasonable level of performance for the general use case when making calls between caller and callee procedures within an application. At the same time, such a default calling convention may also attempt to make reasonable reductions in the code size generated at both the caller and callee procedures for maintaining machine level state consistency between both the caller and callee. Oftentimes, however, this is not ideal for an application developer who demands either tight restrictions on code size, or in other cases, high levels of compiled code performance in key system kernels of hot paths within the call graph.
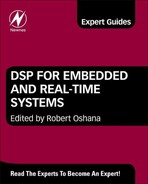
Consider for example the function in Figure 12-1 below, which passes a large number of 16-bit integer values from the caller to the callee procedure.
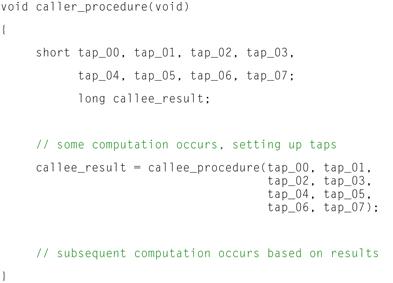
Figure 12-1: Caller procedure in C.
Looking at this example, it can be seen that the caller procedure computes a number of 16-bit values that must be passed as input parameters to the callee procedure. The callee procedure shown in Figure 12-2 will then use these input values to compute some result that is passed back to the caller procedure to use in subsequent computation.
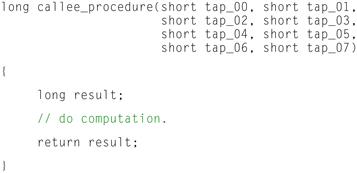
Figure 12-2: Callee Procedure in C.
Let’s also assume that we are dealing with a somewhat trivialized ABI that is succinct for this illustrative example. The ABI assumes a 32-bit general purpose embedded architecture that has a 32-bit general purpose register file. The default calling convention for this ABI states that the first two char, short, or integer, values that are passed to a callee procedure get passed in general purpose register R00 and R01, with subsequent parameters being passed from the caller to the callee via the stack. This might be typical for a processor targeting a mobile embedded device sensitive to both performance and code size. The resulting assembly might look something like what is shown in Figures 12-3 and 12-4.
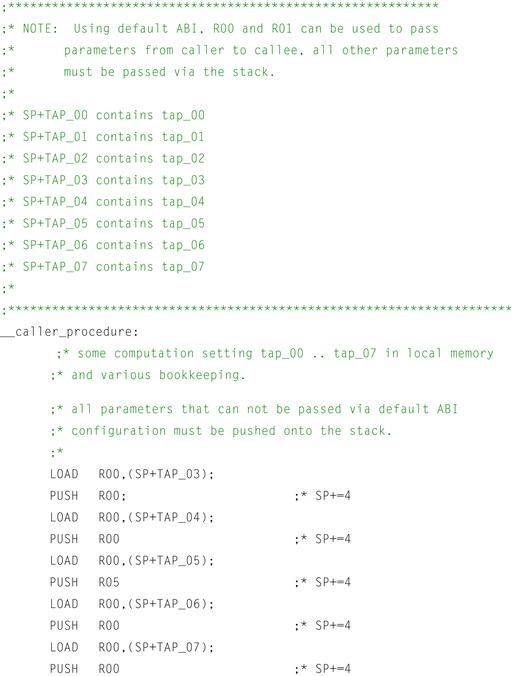
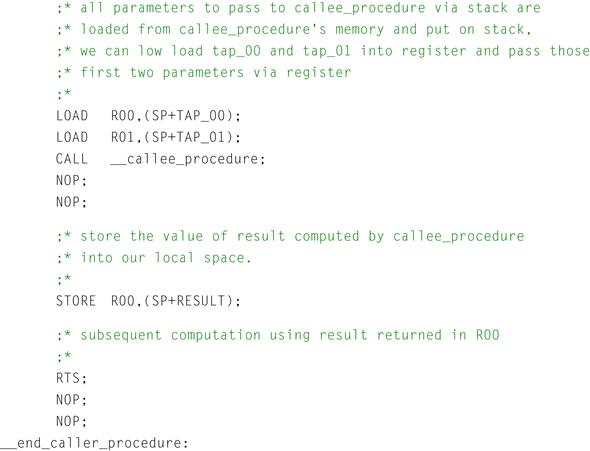
Figure 12-3: Caller procedure in assembly.
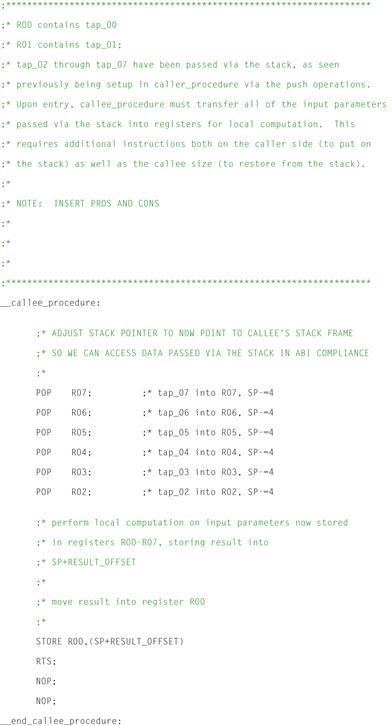
Figure 12-4: Callee procedure in assembly.
We can see here that the default ABI has been used as the vehicle for communications between both the caller and callee procedures named caller_procedure() and callee_procedure() respectively. Looking at the assembly code generated for the caller_procedure, we can see that the local variables computed within caller_procedure, namely tap_00 through tap_07, are loaded from memory within the local procedure, and copied onto the stack for passing to the callee routine, namely callee_procedure. Because the default calling convention as specified by this example ABI states that the first two char, short, or integral type parameters may be passed via registers from the caller to the callee procedures, the compiler has taken the liberty of passing tap_00 and tap_01 using target processor registers R00 and R01 respectively.
It is interesting to note that fewer instructions are required for setting up parameters to be passed via registers than those to be passed via the stack. Additionally, it can be seen from the callee procedure that significantly more instructions must be inserted into the callee procedure by the compiler to restore parameters passed via copy on the stack from the caller function into registers for local computation within the callee routine. While this affords a very nice abstraction of computation between the caller and the callee routines, clearly if the user wishes to reduce the code size of their resulting executable, one might consider alternative means of communication between caller and callee routines.
This is where custom calling conventions may be used with a given ABI to further improve performance, or in the case of this example to further reduce the code size and increase performance as well. Suppose that now the user has altered the calling convention within the ABI to use for these two procedures. Let’s call this new calling convention as specified by the user ‘user_calling_convention.’ The user has now stated that rather than pass only the first two parameters from the caller function to the caller in registers, with subsequent parameters being passed via the stack, that the user_calling_convention may pass up to eight parameters from the caller to the callee function via registers, namely R00–R07. In doing this, the tools will need to account for additional registers being used for parameter passing, and the bookkeeping required on both sides of the caller/callee world, however for this user’s example code which passes large numbers of parameters from caller to callee, a benefit can be gained. Figure 12-5 illustrates what assembly code the user could expect to be generated using this user_calling_convention customization as specified by the developer.
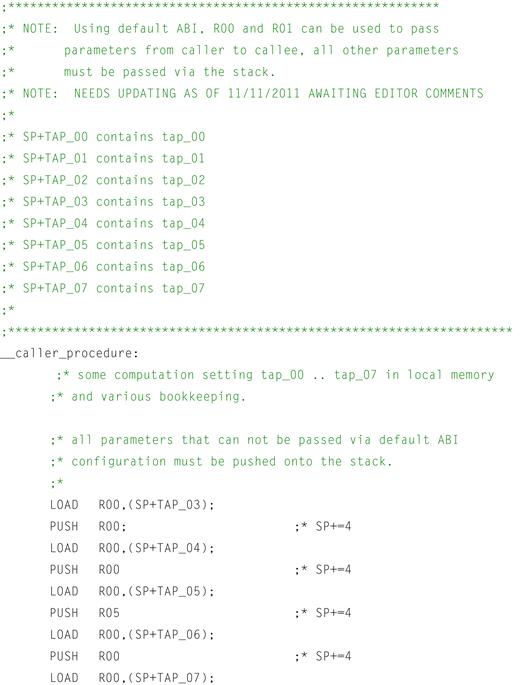
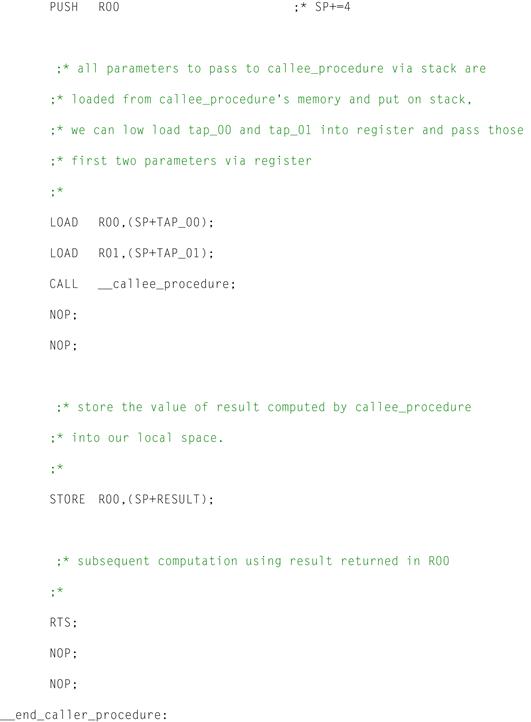
Figure 12-5: Sample caller assembly code using user_calling_convention.
Referring to the figure above, it can be seen that by using the user_calling_convention, the resulting assembly generated by the compiler looks quite different from that of the default calling convention. By permitting the build tools to pass additional parameters between caller and callee functions using registers, a drastic reduction in the number of instructions generated for each procedure is evident. Specifically, the callee_procedure can be shown to require far fewer moves to the stack before the call to the callee_procedure (Figure 12-6). This is due to the fact that additional hardware registers are now afforded to the calling convention, whereby values from the caller’s memory space may simply be loaded into registers before making the call rather than loading into registers and then copying onto the stack (and possibly adjusting the stack pointer explicitly).
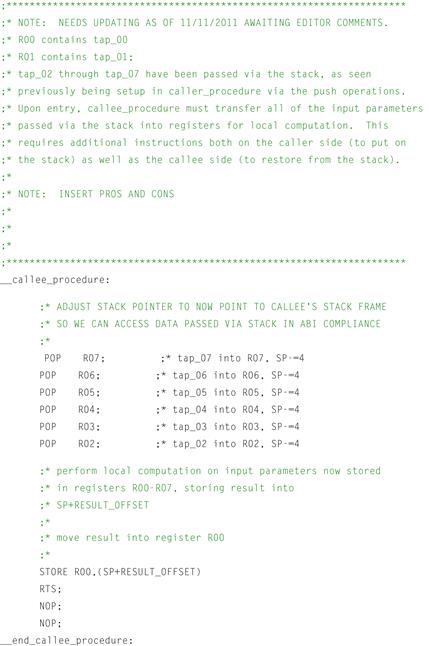
Figure 12-6: Sample callee assembly code using user_calling_convention.
Similarly, referring to the callee_procedure, it can be seen that a number of instructions have been removed from the previous example’s generated assembly. Once again, this is due to the fact that parameters are now being passed from the caller to the callee function via the register file, rather than pushing onto and pulling off of the stack. As such, the callee does not need the additional instruction overhead to copy local copies from the stack into registers for local computation. In this particular example, not only is it likely that performance improvements will be seen due to fewer instructions required to execute dynamically at runtime, but code size has also been reduced due to the number of instructions statically reduced in the executable.
While this example has shown how custom calling conventions can be used as part of an embedded system’s larger ABI to reduce code size, and tailor memory optimization, there are a number of other concepts that may also play into this. Subjects such as spill code insertion by the compiler, the compiler’s ability to compute stack frame sizes to utilize standard MOVE instructions to/from the stack frame rather than PUSH/POP style instructions, and also SIMD style move operations to the stack whereby increased instruction density is obtained further increasing performance and reducing code size overhead are left as further reading and considered beyond the scope of this example.
Caveat emptor: compiler optimization orthogonal to code size!
When compiling code for a production release, developers often want to exploit as much compile time optimization of their source code as possible in order to achieve the best performance possible. While building projects with –Os as an option will tune the code for optimal code size, it may also restrict the amount of optimization that is performed by the compiler due to such optimizations resulting in increased code size. As such, a user may want to keep an eye out for errant optimizations performed typically around loop nests and selectively disable them on a one by one use case rather than disable them for an entire project build. Most compilers support a list of pragmas that can be inserted to control compile time behavior. Examples of such pragmas can be found with the documentation for your target processor’s build tools.
Software pipelining is one optimization that can result in increased code size due to additional instructions that are inserted before and after the loop body of the transformed loop. When the compiler or assembly programmer software pipelines a loop, overlapping iterations of a given loop nest are scheduled concurrently with associated ‘set up’ and ‘tear down’ code inserted before and after the loop body. These additional instructions inserted in the set up and tear down, or prolog and epilog as they are often referred to in the compiler community, can result in increased instruction counts and code sizes. Typically a compiler will offer a pragma such as ‘#pragma noswp’ to disable software pipelining for a given loop nest, or given loops within a source code file. Users may want to utilize such a pragma on a loop by loop basis to reduce increases in code size associated for select loops that may not be performance critical or on the dominant runtime paths of the application.
Loop unrolling is another fundamental compiler loop optimization that often increases the performance of loop nests at runtime. By unrolling a loop so that multiple iterations of the loop reside in the loop body, additional instruction level parallelism is exposed for the compiler to schedule on the target processor; in addition fewer branches with branch delay slots must be executed to cover the entire iteration space of the loop nest, potentially increasing the performance of the loop as well. Because multiple iterations of the loop are cloned and inserted into the loop body by the compiler, however, the body of the loop nests typically grows as a multiple of the unroll factor. Users wishing to maintain a modest code size may wish to selectively disable loop unrolling for certain loops within their code production, at the cost of compiled code runtime performance. By selecting those loop nests that may not be on the performance critical path of the application, savings in code size can be achieved without impacting performance along the dominant runtime path of the application. Typically compilers will support pragmas to control loop unrolling related behavior, such as the minimum number of iterations a loop will exist for various unroll factors to pass to the compiler. Examples of disabling loop unrolling via a pragma are often of the form ‘#pragma nounroll.’ Please refer to your local compiler’s documentation for correct syntax on this and related functionality.
Procedure inlining is another optimization that aims to improve the performance of compiled code at the cost of compiled code size. When procedures are inlined, the callee procedure that is the target of a caller procedures callee invocation site is physically inlined into the body of the caller procedure. Consider the example in Figure 12-7.
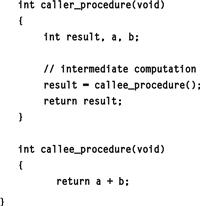
Figure 12-7: Procedure inlining.
Instead of making a call to callee_procedure() every time caller_procedure() is invoked, the compiler may opt to directly substitute the body of callee_procedure into the body of caller_procedure to avoid the overhead associated with the function call. In doing this, the statement a + b will be substituted into the body of caller_procedure in the hopes of improving runtime performance by eliminating the function call overhead, and hopefully proving better instruction cache performance. If this inlining is performed for all call sites of callee_procedure within the application, however, one can see how multiple inlinings quickly can lead to an explosion in the sizes of the application especially for examples where callee_procedure contained more than a simple addition statement. As such, users may wish to manually disable function inlining for their entire application or for selective procedures via a compiler provided pragma. Typical pragmas are of the form ‘#pragma noinline’ and will prevent the tools from inlining the procedure marked at compilation time.
Memory layout optimization
In order to obtain sufficient levels of performance, application developers and software systems architects must not only select the appropriate algorithms to use in their applications, but also the means by which those applications are implemented. Quite often this also crosses the line into data structure design, layout, and memory partitioning for optimal system performance. It is true that senior developers often have insight into both algorithms and their complexity, as well a toolbox of tips and tricks for memory optimization and data structure optimization. At the same time, the scope of most embedded software engineering projects prohibits manual code and data hand optimization due to time, resource, and cost constraints. As such, developers must often rely on the tools as much as possible to optimize the general use cases, only resorting to hand level tuning and analysis to tweak performance on those performance critical bottlenecks after the initial round of development. This last round of optimization often entails using various system profiling metrics to determine performance critical bottlenecks, and then optimizing these portions of the application by hand using proprietary intrinsics or assembly code, and in some cases rewriting performance critical kernel algorithms and/or related data structures. This section details design decisions that may prove useful for embedded system developers concerned with those topics mentioned above.
Overview of memory optimization
Memory optimizations of various types are often beneficial to the runtime performance and even power consumption of a given embedded application. As was mentioned previously, these optimizations can often be performed to varying degrees by the application build tools such as compilers, assemblers, linkers, profilers, and so forth. Alternately, it is often valuable for developers to go into the application and either manually tune the performance, or design in consideration of memory system optimization a priori for either given performance targets, or so as to design the software architecture to be amenable to automated tools optimization at subsequent phases in the development cycle.
In tuning a given application, quite often the baseline or ‘out of box’ version of the application will be developed. Once functionality is brought online, the development team or engineers may select to profile the application for bottlenecks that require further optimization. Often these are known without profiling, if certain kernels within the application must execute within a given number of clock cycles as determined by a spreadsheet or pen and paper exercise during system definition. Once these key kernels are isolated or key data structures are isolated, optimization typically begins by those experts with knowledge of software optimization techniques, compiler optimizations, the hardware target, and perhaps details of the hardware target instruction set.
Focusing optimization efforts
Amdahl’s law plays an interesting role in the optimization of full application stacks, yet is not always appreciated by the software system developer. If only 10% of the dynamic runtime of a given application can benefit from SIMD or instruction level parallel optimizations versus the 90% of dynamic runtime that must be executed sequentially, then inordinate amounts of effort on parallelizing the 10% portion of the code will still only result in modest performance improvements. Conversely, if 90% of the total applications dynamic runtime is spent in code regions exhibiting large amounts of instruction level parallelism and data level parallelism, it may be worthwhile to focus engineering effort on parallelizing these regions to obtain improved dynamic runtime performance.
In determining those portions of the code which dominate the dynamic application runtime, and may be the best candidate for either hand optimization or hand adjustment for applicability to automated tools optimization, application developers typically use a software profiler in conjunction with either the silicon target or software based system simulation. Intel’s VTUNE is one such example of a profiling framework; alternately the GNU GCC compiler and GPROF are open source solutions that provide dynamic runtime information. Many silicon vendors such as Freescale Semiconductor and Texas Instruments also offer their own proprietary solutions for use with their respective silicon targets, allowing for either traces collected on software based simulation platforms, or alternately larger application level traces that can be collected on the native silicon target.
Vectorization and the dynamic code-compute ratio
Vectorization of loops is an optimization whereby computation performed across multiple loop iterations can be combined into single vector instructions, effectively increasing the instruction to compute ratio within the applications dynamic runtime behavior. Consider the example in Figure 12-8.
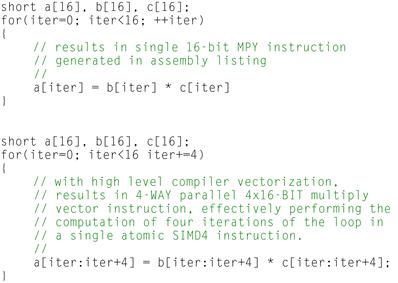
Figure 12-8: Vectorization of loops.
In the first loop nest, we can see that each iteration of the loop contains a single 16-bit by 16-bit multiply instruction whose result is written to the a[] array as output. One multiplication instruction is performed for each iteration of the loop, resulting in 16 16-bit multiplies. The second loop, however, shows pseudo-code for how the compiler or application developer might vectorize the loop when targeting and architecture that supports a 4-way SIMD multiply instruction over 16-bit integer elements. In this case, the compiler has vectorized multiple iterations of the loop together into the multiply instruction, as denoted by the array[start_range:end_range] syntax denoted in the second loop nest. Note that the loop counter is incremented by the vectorized length for each iteration of the loop now. Clearly only four iterations over the loop are now needed to compute the resulting a[] output array, as each iteration of the loop now contains a single vector multiply instruction that computes four elements of the output vector in parallel.
There are many benefits to vectorizing code in this manner, either by hand in the event that the application developer uses intrinsics that are proprietary with respect to the target architecture, or in the event that the compiler is able to vectorize the code. One such benefit is the increase in performance, as the code now exploits dedicated SIMD hardware, often providing a multiplication in improvement over the vectorized loop on the order of the underlying SIMD vector hardware. Other benefits are the reduction in code size, as loops are no longer unrolled resulting in explosions in the code size, but rather more dense instructions of vector format are used rather than atomic scalar instructions. This may have secondary benefits in reducing the number of instruction fetch transactions that go out to memory as well. Lastly, the overall ratio of dynamically issued instructions to computation performed within the application is also increased.
There are a number of challenges to the development tools as well as the application developers when trying to vectorize code at the loop level. One such challenge is the code shape of loop nests that are candidate for vectorization. Typically, build tools need to understand the loop iteration space of a loop, so using constant loop bounds rather than runtime computed values may be beneficial depending on the advancement of the underlying compiler’s vectorization technology. Secondly, the types of computation performed within the loop nest must be amenable to vectorization. For example, in the example above simple 16-bit integer multiplication is performed for a target architecture supporting a supposed 16-bit 4-way SIMD multiply instruction. If the underlying target architecture only supports 8-bit SIMD multiplication, it may be advantageous to avoid 16-bit multiplication wherever possible if vectorization is desired.
Loop dependence analysis is another concern when vectorizing or parallelizing loop nests, in the compiler must be able to prove the safety of loop transformations. Loop dependence analysis is the means by which the compiler or dependence analyzer determines whether statements within a loop body form a dependence with respect to array accesses and data modifications, various data reduction patterns, simplification of loop independent portions of the code and management of various conditional execution statements within the loop body.
As an example, consider the fragment of C-language code in Figure 12-9.
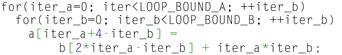
Figure 12-9: Loop dependence analysis.
For the loop next above, the compiler’s data dependence analyzer will attempt to find all dependences between the statements reading the array b[] and writing the array a[]. The challenge for the data dependence analyzer is to find all possible dependences between the statements that write to array a[] and read from array b[]. To ensure safety, the data dependence analyzer must ensure that it can explicitly prove safety, or in other words, any dependence that cannot be proven false must be assumed to be true to ensure safety!
The data dependence analysis shows independence between references by solving that no two instances of statements to array a[] and array b[] access or modify the same spot in array a[]. In the event that a possible dependence is found, loop dependence analysis will make an attempt to characterize the dependences as some types of optimizations over loop nests may still be possible and profitable. It may also be possible to further transform the loop nests so as to remove the dependence.
In summary, writing loop nests so that a minimum of data dependences exist between array references will benefit vectorization and other loop transforms as much as possible. While the compiler technology used in analyzing data dependences and auto-vectorizing serial code for vector hardware stems from the supercomputing community, improperly written code with troublesome data dependences and loop structure may still thwart the vectorization efforts of the most advanced tool sets. At a high level, simply writing code which is easiest for humans to understand is usually the easiest for the vectorizer to understand; in addition the vectorizer and data dependence analyzers can easily recognize what the programmer intended. In other words, highly hand tuned code with a priori knowledge of the underlying target architecture is not the best candidate for automated vectorization at the tools level.
There are a number of things that application developers may want to keep an eye out for when developing code with the intent of auto-vectorization by the build tools.
Pointer aliasing in C
One challenge for vectorizers and data dependence analysis is the user of pointers in the C language. When data is passed to a function via pointers as parameters, it is often difficult or impossible for the data dependence analyzer and subsequent vectorizer to guarantee that the memory regions pointed to by the various pointers do not overlap in the interaction spaces of the loops in which they are computed. As the C standard has evolved over time, support for the ‘restrict’ keyword has been added as can be seen in the example in Figure 12-10.
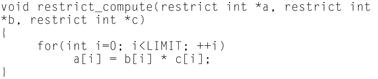
Figure 12-10: Use of the ‘restrict’ keyword.
By placing the restrict keyword qualifier on the pointers passed to the procedure, this ensures to the compiler that the data accessed by a given pointer with the restrict keyword does not alias with anything else the function may modify using another pointer. Note that this only applies to the function at hand, not the global scope of the application itself. This permits the data dependence analyzer to recognize that arrays are not aliased or modified by references with other side effects, and allows more aggressive optimization of the loop nest including vectorization amongst other optimizations.
Data structures, arrays of data structures, and adding it all up!
Appropriate selection of data structures, before the design of kernels, which compute over them, can have significant impact when dealing with high performance embedded DSP codes. This is often especially true for target processors that support SIMD instruction sets and optimizing compiler technology as was detailed previously in this chapter. As an illustrative example, this section details the various tradeoffs between using an array-of-structure elements versus a structure-of-array elements for commonly used data structures. As an example data structure, we’ll consider a set of six dimensional points that are stored within a given data structure as either an array-of-structures or a structure-of-arrays as detailed in Figure 12-11.
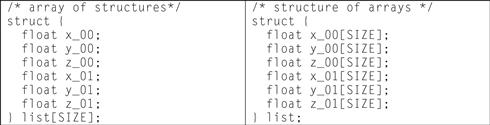
Figure 12-11: Example data structure.
The array of structures, as depicted on the left hand side of the table in Figure 12-11, details a structure which has six fields of floating point type, each of which might be the three coordinates of the ends of a line in three dimensional space. The structures are allocated as an array of size elements. The structure of arrays, which is represented on the right hand side above, creates a single structure which contains six arrays of floating point data types, each of which is of size elements. It should be noted that each of the data structures above are functionally equivalent, but have varying system side effects in regard to memory system performance and optimization.
Looking at the array of structures example above, it can be seen that for a given loop nest that is known to access all of the elements of a given struct element before moving onto the next element in the list, good locality of data will be exhibited. This will be due to the fact that as cache lines of data are fetched from memory into the data caches, adjacent elements within the data structure will be fetched contiguously from memory and exhibit good local reuse.
The downside when using the array of structures data structure, however, is that each individual memory reference in a loop that touches all of the field elements of the data structure do not exhibit unit memory stride. For example, consider the illustrative loop in Figure 12-12.
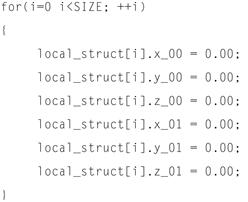
Figure 12-12: Data structure that does not exhibit unit memory stride.
Each of the field accesses in the loop above access different fields within an instance of the structure, and do not exhibit unit stride memory access patterns which would be conducive to compiler level auto-vectorization. In addition, any loop that traverses the list of structures and accesses only one or few fields within a given structure instance will exhibit rather poor spatial locality of data within the cases, due to fetching cache lines from memory that contain data elements which will not be reference within the loop nest.
We can contrast this rather bleak use case depicted above by migrating the array-of-structures format to the structure-of-arrays format, as depicted in the loop nest in Figure 12-13.
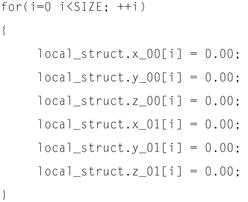
Figure 12-13: Structure of arrays format.
By employing the structure-of-arrays data structure, each field access within the loop nest exhibits unit stride memory references across loop iterations. This is much more conducive to auto-vectorization by the build tools in most cases. In addition, we still see good locality of data across the multiple array streams within the loop nest. It should also be noted that in contrast to the previous scenario, even if only one field is accessed by a given loop nest, locality within the cache is achieved due to subsequent elements within the array being prefetched for a given cache line load.
While the examples presented previously detail the importance of selecting the data structure that best suites the application developer’s needs, it is assumed that the developer or system architect will study the overall application hot spots in driving the selection of appropriate data structures for memory system performance. The result may not be a clear case of black and white, however, and a solution that employs multiple data structure formats may be advised. In these cases, developers may wish to use a hybrid type approach that mixes and matches between structure-of-array and array-of-structure formats. Furthermore, for legacy code bases which are tightly coupled to their internal data structures for various reasons beyond the scope of this chapter, it may be worthwhile to runtime convert between the various formats as needed. While the computation required to convert from one format to another is non-trivial, there may be use cases where the conversion overhead is dramatically offset by the computational and memory system performance enhancements achieved once the conversion is performed.
Loop optimizations for memory performance
In addition to structuring loops for targetability by auto-vectorizing compiler technology, and tailoring data structures over which loops compute, there are loop transformations themselves which may benefit the memory system performance of an application as well. This section details various loop transformation that can be performed either manually by the application developer, or automatically by the development tools to improve system performance.
Data alignment’s rippling effects
The alignment of data within the memory system of an embedded target can have rippling effects on the performance of the code, as well as the development tools’ ability to optimize certain use cases. On many embedded systems, the underlying memory system does not support unaligned memory accesses or such accesses are supported with a certain performance penalty. If the user does not take caution in aligning data properly within the memory system layout, performance can be lost. In summary, data alignment details the manner in which data is accessed within the computer’s memory system. When a processor reads or writes to memory, it will often do this at the resolution of the computer’s word size which might be 4 bytes on a 32-bit system. Data alignment is the process of putting data elements at offsets that are some multiple of the computers word size so that various fields may be accessed efficiently. As such, it may be necessary for users to put padding into their data structures or for the tools to automatically pad data structures according to the underlying ABI and data type conventions when aligning data for a given processor target.
Alignment can play an impact on compiler and loop optimizations such as vectorization. For instance, if the compiler is attempting to vectorize computation occurring over multiple arrays within a given loop body, it will need to know if the data elements are aligned so as to make efficient use of packed SIMD move instructions, and to also know whether certain iterations of the loop nest must be peeled off that execute over non-aligned data elements. If the compiler cannot determine whether or not the data elements are aligned, it may opt to not vectorize the loop at all thereby leaving the loop body sequential in schedule. Clearly this is not the desired result for the best performing executable. Alternately, the compiler may decide to generate multiple versions of the loop nest with runtime test to determine at loop execution time whether or not the data elements are aligned. In this case the benefits of a vectorized loop version are obtained; however, the cost of a dynamic test at runtime is incurred and the size of the executable will increase due to multiple versions of the loop nest being inserted by the compiler.
Users can often do multiple things to ensure that their data is aligned, for instance padding elements within their data structures and ensuring that various data fields lie on the appropriate word boundaries. Many compilers also support sets of pragmas to denote that a given element is aligned. Alternately, users can put various asserts within their code to compute at runtime whether or not the data fields are aligned on a given boundary before a particular version of a loop executes.
Selecting data types for big payoffs
It is important that application developers also select the appropriate data types for their performance critical kernels in addition to the aforementioned strategies of optimization. When the minimal acceptable data type is selected for computation, it may have a number of secondary effects that can be beneficial to the performance of the kernels. Consider, as an example, a performance critical kernel that can be implemented in either 32-bit integral computation or 16-bit integral computation due to the application programmer’s knowledge of the data range. If the application developer selects 16-bit computation using one of the built-in C/C++ language data types such as ‘short int,’ then the following benefits may be gained at system runtime.
By selecting 16-bit over 32-bit data elements, more data elements can fit into a single data cache line. This allows fewer cache line fetches per unit of computation, and should help alleviate the compute to memory bottleneck when fetching data elements. In addition, if the target architecture supports SIMD style computation, it is highly likely that a given ALU within the processor can support multiple 16-bit computations in parallel versus their 32-bit counterparts. For example, many commercially available DSP architectures support packed 16-bit SIMD operations per ALU, effectively doubling the computational throughput when using 16-bit data elements versus 32-bit data elements. Given the packed nature of the data elements, whereby additional data elements are packed per cache line or can be placed in user managed scratchpad memory, coupled with the increased computational efficiency, it may also be possible to improve the power efficiency of the system due to the reduced number of data memory fetches required to fill cache lines.