
Once the model parameters have been estimated, the mean of the posterior for a new example can be calculated, which can then serve as a reduced dimensional representation for it. The mathematics (though still perhaps daunting) is greatly simplified by the fact that marginalizing, multiplying and dividing Gaussians distributions produces other Gaussian distributions that are functions of observed values, mean vectors, and covariance matrices. In fact, many more sophisticated methods and models for data analysis rely on the ease with which key quantities can be computed when the underlying model is based on linear Gaussian forms.
Marginal log-likelihood for PPCA
Given a probabilistic model with hidden variables, the Bayesian philosophy is to integrate out the uncertainly associated with them. As we have just seen, linear Gaussian models make it possible to obtain the marginal probability of the data, p(x), which takes the form of a Gaussian distribution. Then, the learning problem is tantamount to maximizing the probability of the given data under the model. The probability that variable x is observed to be ![]() is indicated by
is indicated by ![]() . The log (marginal) likelihood of the parameters given all the observed data
. The log (marginal) likelihood of the parameters given all the observed data ![]() can be maximized using this objective function:
can be maximized using this objective function:
where the parameters ![]() , consist of a matrix, a vector, and a scalar. We will assume henceforth that the data has been mean-centered:
, consist of a matrix, a vector, and a scalar. We will assume henceforth that the data has been mean-centered: ![]() . (However, when creating generalizations of this approach there can be advantages to retaining the mean as an explicit parameter of the model.)
. (However, when creating generalizations of this approach there can be advantages to retaining the mean as an explicit parameter of the model.)
Expected log-likelihood for PPCA
Section 9.4 showed that the derivative of the log marginal likelihood of a hidden variable model with respect to its parameters equals the derivative of the expected log joint likelihood, where the expectation is taken with respect to the exact posterior distribution over the model’s hidden variables. The underlying Gaussian formulation of PPCA means that an exact posterior can be computed, which provides an alternative way to optimize the model based on the expected log-likelihood. The log joint probability of all data and all hidden variables H under the model is
Notice that while the data ![]() is observed, the hidden variables hi are unknown, so for a given parameter value
is observed, the hidden variables hi are unknown, so for a given parameter value ![]() this expression does not evaluate to a scalar quantity. It can be converted into a scalar-valued function using the expected log-likelihood, which can then be optimized. As we saw in Section 9.4, the expected log-likelihood of the data using the posterior distribution of each example for the expectations is given by
this expression does not evaluate to a scalar quantity. It can be converted into a scalar-valued function using the expected log-likelihood, which can then be optimized. As we saw in Section 9.4, the expected log-likelihood of the data using the posterior distribution of each example for the expectations is given by
Expected gradient for PPCA
Gradient descent can be used to learn the parameter matrix W using the expected log-likelihood as the objective, an example of the expected gradient approach discussed in Section 9.4. The gradient is a sum over examples, and a fairly lengthy derivation shows that each example contributes the following term to this sum:
(9.2)
 (9.2)
(9.2)
where in all cases the expectations are taken with respect to the posterior, ![]() , using the current settings of the model parameters. This partial derivative has a natural interpretation as a difference between two expectations. The second term creates a matrix the same size as W, consisting of an observation and the hidden variable representation. The first term simply replaces the observation with a similar Wh factor, which could be thought of as the model’s prediction of the input. (We will revisit this interpretation when we examine conditional probability models in Section 9.7 and restricted Boltzmann machines in Section 10.5.)
, using the current settings of the model parameters. This partial derivative has a natural interpretation as a difference between two expectations. The second term creates a matrix the same size as W, consisting of an observation and the hidden variable representation. The first term simply replaces the observation with a similar Wh factor, which could be thought of as the model’s prediction of the input. (We will revisit this interpretation when we examine conditional probability models in Section 9.7 and restricted Boltzmann machines in Section 10.5.)
This shows that the model reconstructs the data as it ascends the gradient. If the optimization converges to a model that perfectly reconstructs the data, the derivative in (9.2) will be zero. Other probabilistic models examined show similar forms for the gradients for key parameters, consisting of differences of expectations—but different types of expectation are involved.
To compute these quantities, note that the expected value ![]() can be obtained from the mean of the posterior distribution for each example given by (9.1). The E[hhT] term can be found using the fact that E[hhT]=cov[h]+E[h]E[h]T, where cov[h] is the posterior covariance matrix, which we also know from (9.1) is
can be obtained from the mean of the posterior distribution for each example given by (9.1). The E[hhT] term can be found using the fact that E[hhT]=cov[h]+E[h]E[h]T, where cov[h] is the posterior covariance matrix, which we also know from (9.1) is ![]() .
.
EM for PPCA
An alternative to gradient ascent using the expected log-likelihood is to formulate the model as an expected gradient-based learning procedure using the classical EM algorithm. The M-step update can be obtained by setting the derivative in (9.2) to zero and solving for W. This can be expressed in closed form: W in the first term is independent of the expectation and can therefore be moved out of the expectation and terms re-arranged into a closed-form M-step. In a zero mean model with ![]() and some small value for
and some small value for ![]() , the E and M steps of the PPCA EM algorithm can be rewritten
, the E and M steps of the PPCA EM algorithm can be rewritten
where all expectations are taken with respect to each example’s posterior distribution, ![]() , and, as above,
, and, as above, ![]() .
.
The EM algorithm can be further simplified by taking the limit as ![]() approaches zero. This is the zero input noise case, and it implies M=WWT. Define the matrix Z=E[H], each column of which contains the expected vector from
approaches zero. This is the zero input noise case, and it implies M=WWT. Define the matrix Z=E[H], each column of which contains the expected vector from ![]() for one of the hidden variables hi, so that
for one of the hidden variables hi, so that ![]() . This yields simple and elegant equations for the E and M steps:
. This yields simple and elegant equations for the E and M steps:
where both equations operate on the entire data matrix ![]() .
.
The probabilistic formulation of principal component analysis permits traditional likelihoods to be defined, which supports maximum likelihood based learning and probabilistic inference. This in turn leads to natural methods for dealing with missing data. It also leads on to the other models discussed below.
Latent Semantic Analysis
Chapter 8, Data transformations, introduced principal component analysis, which, as we have seen above, can be viewed as a form of linear Gaussian latent variable model. We now discuss an influential early form of data driven document analysis known as “latent semantic analysis” (LSA), which uses singular value decomposition to decompose each document in a collection into topics. If documents and terms are projected into the topic space, comparisons can be made that capture semantic structure in the documents resulting from the cooccurrence of words across the collection. Characterizing documents in this way is called “latent semantic indexing.” Probabilistic LSA (pLSA) addresses similar goals but applies a statistical model based on multinomial distributions. Latent Dirichlet allocation is a related model that uses a hierarchical Bayesian approach in which Dirichlet priors are placed on the underlying multinomial distributions.
To motivate the introduction of these techniques, let us examine the relationship between the original LSA method and singular value decomposition. Imagine a term by document matrix X, with t rows and d columns, each element of which contains the number of times the word associated with its row occurs in the document associated with its column. LSA decomposes X into a product X=USVT, where U and V have orthogonal columns and S is a diagonal matrix containing the singular values, which are conventionally sorted in decreasing order. This factorization is known as the singular value decomposition, and has the property that for every value k, if all but the k largest singular values are discarded the data matrix can be reconstructed in a way that is optimal in a least squares sense. For any given approximation level k, we can write ![]() .
.
Fig. 9.10 illustrates how this works. The Uk matrix can be thought of as k orthogonal “topics” that are combined according to the appropriate proportions for each document, encoded in the ![]() matrix
matrix ![]() . The matrix
. The matrix ![]() represents the activity level of the topics associated with each document. Thus the learning phase of LSA simply performs singular value decomposition on the data matrix.
represents the activity level of the topics associated with each document. Thus the learning phase of LSA simply performs singular value decomposition on the data matrix.

The dot (or scalar) product of any two columns of the approximated data matrix ![]() provides a measure of the similarity of term usage in the two documents. The dot products between all pairs of documents used to compute the singular value decomposition are
provides a measure of the similarity of term usage in the two documents. The dot products between all pairs of documents used to compute the singular value decomposition are
To analyze a new document (or query) xq that is not in the original collection used for the decomposition, it can be projected into the semantic space of topic activity defined by the model using
(9.3)
Using Principal Component Analysis for Dimensionality Reduction
The singular value decomposition is widely used to project data into a space of reduced dimensions, often before applying other analysis techniques. For instance, data can be projected into a lower dimensional space in order to effectively apply nearest neighbor techniques, which tend to break down in high dimensional spaces.
LSA is in fact a form of principal component analysis. When viewed as a probability model, the projection of a document into a lower dimensional semantic space is, in effect, a latent variable representation for the document. The equivalent quantity in PPCA is given by the expected value of the posterior distribution over the hidden variables. This gives an intuitive view of what it means to project a document or query vector into a lower dimensional space.
For a PPCA model with no noise in the observed variables x, we have seen that an input vector x can be projected into a reduced dimensional random vector z by computing the mean value of the posterior for the latent variables using ![]() . Appendix A.2 details the relationships between PCA, PPCA, the singular value decomposition and eigendecompositions, and shows that for mean-centered data the U matrix in (9.3) equals the matrix of eigenvectors
. Appendix A.2 details the relationships between PCA, PPCA, the singular value decomposition and eigendecompositions, and shows that for mean-centered data the U matrix in (9.3) equals the matrix of eigenvectors ![]() of the eigendecomposition of the corresponding covariance matrix of the data, i.e.
of the eigendecomposition of the corresponding covariance matrix of the data, i.e. ![]() . The diagonal matrix S in (9.3) is related to the diagonal matrix of eigenvalues
. The diagonal matrix S in (9.3) is related to the diagonal matrix of eigenvalues ![]() by
by ![]() . Furthermore, the eigendecomposition of the covariance matrix implies that
. Furthermore, the eigendecomposition of the covariance matrix implies that ![]() in the corresponding PPCA. Thus, under the probabilistic interpretation of principal component analysis with no noise for observed variables,
in the corresponding PPCA. Thus, under the probabilistic interpretation of principal component analysis with no noise for observed variables,![]() . Using the fact that U is orthogonal and S is diagonal, this means that computing a principal component analysis of mean-centered data using the singular value decomposition and interpreting the result as a linear Gaussian hidden variable model yields the following expression for projecting results into the reduced dimensional space based on the mean of the posterior:
. Using the fact that U is orthogonal and S is diagonal, this means that computing a principal component analysis of mean-centered data using the singular value decomposition and interpreting the result as a linear Gaussian hidden variable model yields the following expression for projecting results into the reduced dimensional space based on the mean of the posterior:

This is the same expression as the LSA projection in (9.3) to compute aq, the semantic representation of a document, and it represents a general expression for dimensionality reduction using principal component analysis. This means that principal component analysis can be performed using the singular value decomposition of the data matrix, or an eigendecomposition of the covariance matrix, the EM algorithm, or even expected gradient descent. When working with large datasets or data with missing values there are advantages and disadvantages to each method.
The input data X need not arise from documents: LSA is just a concrete example of applying singular value decomposition to a real problem. Indeed, the general idea of computing such projections is widely used across machine learning and data mining. Because of the relationships discussed above the methods are often discussed using different terminology, even when they refer to the same underlying analysis.
Probabilistic LSA
PPCA is based on continuous valued representations of data and an underlying Gaussian model. In contrast, the pLSA approach, also known as an “aspect model,” is based on a formulation using the multinomial distribution; it was originally applied to the cooccurrences of words and documents. The multinomial distribution is a natural distribution for modeling word occurrence counts. In the pLSA framework one considers the index of each document as being encoded using observations of discrete random variables di for i=1,…,n documents. Each variable di has n states, and over the document corpus there is one observation of the variable for each state. Topics are represented with discrete variables zij, while words are represented with random variables wij, where mi words are associated with each document and each word is associated with a topic. There are two variants: an asymmetric and a symmetric formulation.
Fig. 9.11A illustrates the asymmetric formulation; the symmetric formulation reverses the arrow from d to z. D is a set of random variables for the document index observations, and W is a set of random variables for all the words observed across the documents. The asymmetric formulation corresponds to

Because d, an index over the training documents, is a random variable in the graph, pLSA is not a generative model for new documents. However, it does correspond to a valid probabilistic model with hidden variables, so the EM algorithm can be used to estimate parameters and obtain a representation of each document in a corpus in terms of its distribution over the topic variables.
Latent Dirichlet Allocation
pLSA can be extended into a hierarchical Bayesian model with three levels, known as latent Dirichlet allocation. We refer to this as LDAb (“b” for Bayesian) to distinguish it from linear discriminant analysis which is commonly referred to as LDA. LDAb was proposed in part to reduce the overfitting that has been observed with pLSA, and has been extended in many ways. Extensions of LDAb can be used to determine trends over time and identify “hot” and “cold” topics. Such analyses are particularly interesting today, with the recent explosion of social media and the interest in analyzing it.
Latent Dirichlet allocation is a hierarchical Bayesian model that reformulates pLSA by replacing the document index variables di with the random parameter ![]() , a vector of multinomial parameters for the documents. The distribution of
, a vector of multinomial parameters for the documents. The distribution of ![]() is influenced by a Dirichlet prior with hyperparameter
is influenced by a Dirichlet prior with hyperparameter ![]() , which is also a vector. (Appendix A.2 explains Dirichlet distributions and their use as priors for the parameters of the discrete distribution.) Finally, the relationship between the discrete topic variables zij and the words wij is also given an explicit dependence on a hyperparameter, namely, the matrix
, which is also a vector. (Appendix A.2 explains Dirichlet distributions and their use as priors for the parameters of the discrete distribution.) Finally, the relationship between the discrete topic variables zij and the words wij is also given an explicit dependence on a hyperparameter, namely, the matrix ![]() . Fig. 9.11B shows the corresponding graphical model. The probability model for the set of all observed words W is
. Fig. 9.11B shows the corresponding graphical model. The probability model for the set of all observed words W is

which marginalizes out the uncertainty associated with each ![]() and zij.
and zij. ![]() is given by a k-dimensional Dirichlet distribution, which also leads to k-dimensional topic variables zij. For a vocabulary of size V,
is given by a k-dimensional Dirichlet distribution, which also leads to k-dimensional topic variables zij. For a vocabulary of size V, ![]() encodes the probability of each word given each topic, and prior information is therefore captured by the
encodes the probability of each word given each topic, and prior information is therefore captured by the ![]() dimensional matrix
dimensional matrix ![]() .
.
The marginal log-likelihood of the model can be optimized using an empirical Bayesian method by adjusting the hyperparameters ![]() and
and ![]() via the variational EM procedure. To perform the E-step of EM, the posterior distribution over the unobserved random quantities is needed. For the model defined by the above equation, with a random
via the variational EM procedure. To perform the E-step of EM, the posterior distribution over the unobserved random quantities is needed. For the model defined by the above equation, with a random ![]() for each document, word observations
for each document, word observations ![]() , and hidden topic variables z, the posterior distribution is
, and hidden topic variables z, the posterior distribution is
which, unfortunately, is intractable. For the M-step it is necessary to update hyperparameters ![]() and
and ![]() , which can be done by computing the maximum likelihood estimates using the expected sufficient statistics from the E-step. The variational EM procedure amounts to computing and using a separate approximate posterior for each
, which can be done by computing the maximum likelihood estimates using the expected sufficient statistics from the E-step. The variational EM procedure amounts to computing and using a separate approximate posterior for each ![]() and each zij.
and each zij.
A method called “collapsed Gibbs sampling” turns out to be a particularly effective alternative to variational methods for performing LDAb. Consider first that the model in Fig. 9.11B can be expanded to that shown in Fig. 9.11C, which was originally cast as the smoothed version of LDAb. Then add another Dirichlet prior with parameters given by ![]() on the topic parameters of
on the topic parameters of ![]() , a formulation that further reduces the effects of overfitting. Standard Gibbs sampling involves iteratively sampling the hidden random variables zij, the
, a formulation that further reduces the effects of overfitting. Standard Gibbs sampling involves iteratively sampling the hidden random variables zij, the ![]() ’s and the elements of matrix
’s and the elements of matrix ![]() . Collapsed Gibbs sampling is obtained by integrating out the θi’s and
. Collapsed Gibbs sampling is obtained by integrating out the θi’s and ![]() analytically, which deals with these distributions exactly. Consequently, conditioned by the current estimates of
analytically, which deals with these distributions exactly. Consequently, conditioned by the current estimates of ![]() ,
, ![]() , and the observed words of a document corpus, the Gibbs sampler proceeds by simply iteratively updating each zij to compute the required approximate posterior. Using either samples or variational approximations it is then relatively straightforward to obtain estimates for the θi’s and
, and the observed words of a document corpus, the Gibbs sampler proceeds by simply iteratively updating each zij to compute the required approximate posterior. Using either samples or variational approximations it is then relatively straightforward to obtain estimates for the θi’s and ![]() .
.
The overall approach of using a smoothed, collapsed LDAb model to extract topics from a document collection can be summarized as follows: first define a hierarchical Bayesian model for the joint distribution of documents and words following the structure of Fig. 9.11C. We could think of there being a Bayesian E-step that performs approximate inference using Gibbs’ sampling to sample from the joint posterior over all topics for all documents in the model, or ![]() , where the θi’s and
, where the θi’s and ![]() have been integrated out. This is followed by an M-step that uses these samples to update the estimates of the θi’s and
have been integrated out. This is followed by an M-step that uses these samples to update the estimates of the θi’s and ![]() , using update equations that are functions of
, using update equations that are functions of ![]() ,
, ![]() , and the samples. This procedure is performed within a hierarchical Bayesian model, so the updated parameters can be used to create a Bayesian predictive distribution over new words and new topics given the observed words.
, and the samples. This procedure is performed within a hierarchical Bayesian model, so the updated parameters can be used to create a Bayesian predictive distribution over new words and new topics given the observed words.
Table 9.1 shows the highest probability words from a sampling of topics mined by Griffiths and Steyvers (2004) through applying LDAb to 28,154 abstracts of papers published in the Proceedings of the National Academy of Science from 1991 to 2001 and tagged by authors with subcategory information. Analyzing the distribution over these tags identifies the highest probability user tags for each topic, which are shown at the bottom of Table 9.1. Note that the user tags were not used to create the topics, but we can see how well the extracted topics match with human labels.
Table 9.1
Highest Probability Words and User Tags From a Sample of Topics Extracted From a Collection of Scientific Articles
| Topic 2 | Topic 39 | Topic 102 | Topic 201 | Topic 210 |
| Species | Theory | Tumor | Resistance | Synaptic |
| Global | Time | Cancer | Resistant | Neurons |
| Climate | Space | Tumors | Drug | Postsynaptic |
| Co2 | Given | Human | Drugs | Hippocampal |
| Water | Problem | Cells | Sensitive | Synapses |
| Geophysics, geology, ecology | Physics, math, applied math | Medical sciences | Pharmacology | Neurobiology |

Factor Graphs
Bayesian networks are a special kind of probability model that factorize a joint probability distribution into the product of conditional and unconditional distributions. Factor graphs provide an even more general framework for representing general functions by factoring them into the product of local functions, each of which acts on a subset of the full argument set:
where Xj is a subset of the original set of arguments {x1,…,xn}, fj(Xj) is a function of Xj, and j=1,…,S enumerates the argument subsets. A factor graph consists of variable nodes—circles—for each variable xk and factor nodes—rectangles—for each function, with edges that connect each factor node to its variables.
Fig. 9.12A and B shows a Bayesian network and its factor graph corresponding to the factorization

Factor graphs make concepts such as the Markov blanket for a given variable in a Bayesian network easy to identify. For example, Fig. 9.13 shows the Markov blanket for variable x6 in a factor graph that corresponds to the Bayesian network in Fig. 9.3: it consists of all nodes that are connected to it through a factor. Factor graphs are more powerful than Bayesian networks because they can represent a wider class of factorizations and models. These include Markov random fields, which we will meet shortly.

Factor graphs, Bayesian networks, and the logistic regression model
It is instructive to compare the factor graph for a naïvely constructed Bayesian model with the factor graph for a Naïve Bayes model of the same set of variables (and, later, with the factor graph for a logistic regression formulation of the same problem). Fig. 9.14A and B shows the Bayesian network and its factor graph for a network with a child node y that has several parents xi, i=1,…,n. Fig. 9.14B involves a large conditional probability table for ![]() , with many parameters that must be estimated or specified, because in
, with many parameters that must be estimated or specified, because in
the number of parameters increases exponentially with the number of parent variables. In contrast, Fig. 9.14C and D shows the Bayesian network and its factor graph for the Naïve Bayes model. Here the number of parameters is linear in the number of children because the model breaks down into the product of functions involving y and just one xi, because the underlying factorization is

The factor graphs show the different complexities very clearly. The graph in Fig. 9.14B has a factor involving n+1 variables, while the factors in Fig. 9.14D involve no more than two variables.
Factor graphs can be extended to clarify an important distinction for conditional models. The Bayesian network of Fig. 9.15A involves a large table for the conditional distribution of y given many xi’s, but a logistic regression model could be used to reduce the number of parameters for ![]() from exponential to linear, depicted in Fig. 9.15B.
from exponential to linear, depicted in Fig. 9.15B.

Let us assume that all variables are binary. Given a separate function fi(y,xi) for each binary variable xi, the conditional distribution defined by a logistic regression model has the form

where the denominator Z is a data-dependent normalization term that makes the conditional distribution sum to 1, and ![]() . This corresponds to a factor graph that resembles the Naïve Bayes model, but with the factorized conditional distribution shown in Fig. 9.15B. Here, curved rectangles represent variables that are not explicitly defined as random variables. This graph represents the conditional probability function
. This corresponds to a factor graph that resembles the Naïve Bayes model, but with the factorized conditional distribution shown in Fig. 9.15B. Here, curved rectangles represent variables that are not explicitly defined as random variables. This graph represents the conditional probability function ![]() , and the number of parameters scales linearly because each function is connected to just a pair of variables.
, and the number of parameters scales linearly because each function is connected to just a pair of variables.
Markov Random Fields
Markov random fields define another factorized model for a set of random variables X, where these variables are divided into so-called “cliques” Xc and a factor Ψc(Xc) is defined for each clique:
A clique is a group of nodes in an undirected graph that all connect to every other node in the clique. Z, known as the partition function, normalizes the model to ensure that it is a probability distribution, and consists of a sum over all possible values for all variables in the model. It could be written
Fig. 9.16A and B shows an undirected graph corresponding to a Markov random field, and its factor graph. Again the factor graph makes explicit the nature of the underlying functions used to create the model. For example, it shows that functions are associated with each node, which is not clear from the undirected graph notation. The Markov random field structure in Fig. 9.16 has been widely used for images: this general structure is typically repeated over an entire image, with each node representing a property of a pixel—e.g., a label, or its depth.

Fig. 9.16 factorizes the joint probability for four variables as follows:

where ![]() represents a set of unary functions of just one variable, while
represents a set of unary functions of just one variable, while ![]() represents a set of pairwise functions of two variables. Subscripts u and v index both the functions and the sets of single variables
represents a set of pairwise functions of two variables. Subscripts u and v index both the functions and the sets of single variables ![]() and variable pairs
and variable pairs ![]() that serve as their arguments.
that serve as their arguments.
This representation can equivalently be expressed using an energy function F(X) of this form:
Then a Markov random field can be written
Since Z is constant for any assignment of the variables X, the negative log probability under the model can be written
This leads to the commonly used strategy of minimizing an energy function in this form to perform tasks such as image segmentation and entity resolution in text documents. When such minimization tasks are “submodular,” a term that denotes a particular category of optimization problems, an exact minimum can be found using algorithms based on graph-cuts; otherwise methods such as tree-reweighted message passing are used.
Computing Using the Sum-Product and Max-Product Algorithms
Key quantities of interest for any probability model are the marginal probabilities and the most probable explanation of the model. For tree-structured graphical models, exact solutions for these can be found efficiently by the sum-product and max-product algorithms. When applied to the hidden Markov models discussed in Section 9.8, these are known as the forwards-backwards and Viterbi algorithms, respectively. We begin with some simple examples for motivation, and then present the algorithms themselves.
Marginal probabilities
Given a Bayesian network, an initial step is to determine the marginal probability of each node given no observations whatsoever. These single node marginals differ from the conditional and unconditional probabilities that were used to specify the network. Indeed, software packages for manipulating Bayesian networks often take the definition of a network in terms of the underlying conditional and unconditional probabilities and show the user the single node marginals for each node in a visual interface. The marginal for variable xi is
where the sum is over the states of all variables xj ≠xi, and can be computed by the sum-product algorithm. In fact, the same algorithm serves in many other situations, such as when some variables are observed and we wish to compute the belief of others, and also for finding the posterior distributions needed for learning—e.g., using the EM algorithm.
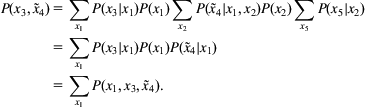
Consider the task of computing the marginal probability of variable x3 given the observation ![]() from the Bayesian network in Fig. 9.12A. Since we are conditioning on a variable, we need to compute a marginal conditional probability. This corresponds to the practical notion of posing a query, where the model is used to infer an updated belief about x3 given the state of variable x4.
from the Bayesian network in Fig. 9.12A. Since we are conditioning on a variable, we need to compute a marginal conditional probability. This corresponds to the practical notion of posing a query, where the model is used to infer an updated belief about x3 given the state of variable x4.
Since other variables in the graph have not been observed, they should be integrated out of the graphical model to obtain the desired result:
Here the key probability of interest is

However, this sum involves a large data structure containing the joint probability, composed of the products over the individual probabilities. The sum-product algorithm refers to a much better solution: simply push the sums as far as possible to the right before computing products of probabilities. Here, the required marginalization can be computed by
The sum-product algorithm
The approach illustrated by this simple example can be generalized into an algorithm for computing marginals that can be transformed into conditional marginals if desired. Conceptually, it is based on sending messages between the variables and functions defined by a factor graph.
Begin with variable or function nodes that have only one connection. Function nodes send the message ![]() to the variable connected to them, while variable nodes send
to the variable connected to them, while variable nodes send ![]() . Each node waits until it has received a message from all neighbors except the one it sent its message to. Then function nodes send messages of the following form to variable x:
. Each node waits until it has received a message from all neighbors except the one it sent its message to. Then function nodes send messages of the following form to variable x:
where N(f)x represents the set of the function node f’s neighbors, excluding the recipient variable x; we write these variables of the K other neighboring nodes as x1,…,xK. If a variable is observed, messages for functions involving it no longer need a sum over the states of the variable, the function is evaluated with the observed state. One could think of the associated variable node as being transformed into the new modified function. There is then no variable to function message for the observed variable.
Variable nodes send messages of this form to functions:
where the product is over the messages from all neighboring functions N(x) other than the recipient function f; i.e., ![]() . When the algorithm terminates, the marginal probability of each node is the product over all incoming messages from all functions connected to the variable:
. When the algorithm terminates, the marginal probability of each node is the product over all incoming messages from all functions connected to the variable:
This is written as a product over K+1 function messages to emphasize its similarity to the variable-to-function-node messages. After sending a message to any given function f consisting of the product of K messages, the variable simply needs to receive one more incoming message back from f to compute its marginal.
If some of the variables in the graph are observed, the algorithm yields the marginal probability of each variable and the observations. The marginal conditional distribution for each variable can be obtained by normalizing the result by the probability of the observation, obtainable from any node by summing over xi in the resulting distributions, which have the form ![]() where O is the set of indices of the observed variables.
where O is the set of indices of the observed variables.
As is often the case with probability models, multiplying many probabilities quickly leads to very small numbers. The sum-product algorithm is often implemented with rescaling. Alternatively, the computations can be performed in log space (as they are in the max-product algorithm; see below), leading to computations of the form ![]() . To help prevent loss of precision when computing the exponents, note that
. To help prevent loss of precision when computing the exponents, note that
and pick the expression with the smaller exponent.
Sum-product algorithm example
The idea behind the sum-product algorithm is to push sums as far to the right as possible, and this is done efficiently for all variables simultaneously. When the algorithm is used to compute ![]() from the Bayesian network in Fig. 9.12A and the corresponding factor graph in Fig. 9.17, the key messages involved are:
from the Bayesian network in Fig. 9.12A and the corresponding factor graph in Fig. 9.17, the key messages involved are:


These numbered messages can be written

Keep in mind that the complete algorithm will yield all single-variable marginals in the graph using the other messages shown in Fig. 9.17, but not enumerated above. This simple example is based on a Bayesian network, which transforms into a chain-structured factor graph when ![]() is observed, and the message passing structure resembles the computations used for the hidden Markov models and conditional random fields discussed below. For long chains or large tree-structured networks, such computations are essential for computing the necessary quantities efficiently, without recourse to approximate methods.
is observed, and the message passing structure resembles the computations used for the hidden Markov models and conditional random fields discussed below. For long chains or large tree-structured networks, such computations are essential for computing the necessary quantities efficiently, without recourse to approximate methods.
Most probable explanation example
Finding the most probable configuration of all other variables in our example given ![]() involves searching for
involves searching for
for which
The joint probability is related to the conditional by a constant, so one could equally well find the maximum of ![]() . Because max behaves in a similar way to sum, we can take a tip from the sum-product and push the max operations as far to the right as possible, noting that
. Because max behaves in a similar way to sum, we can take a tip from the sum-product and push the max operations as far to the right as possible, noting that ![]() . Here,
. Here,
Consider the max over x5 at the far right, which seeks the greatest probability among the possible states of x5 for each of the possible states of x2. This involves creating a table giving the maximum values of x5 for each configuration of x2. The next operation to the left, the max over x2, involves multiplying the current maximum values in the table for x2 by the corresponding probabilities for ![]() . We thus need to find the maximum for each state of x2 for each state of x1, which can be modeled by producing a message over the states of x1 with the greatest values obtained for each possible state based on all information propagated so far from the right.
. We thus need to find the maximum for each state of x2 for each state of x1, which can be modeled by producing a message over the states of x1 with the greatest values obtained for each possible state based on all information propagated so far from the right.
This process continues until eventually we have a final max over x3. This gives a single value, the probability of the most probable explanation, which corresponds to the entry in the data structure with scores for each state of x3. By changing which variable is used to compute the final max, we can extract it from any variable, because this will lead to the same maximum value. However, taking the arg max for each variable will yield the desired most probable explanation ![]() —the configuration of all variables which has the greatest probability. Generalizing these ideas and performing them efficiently leads to the max-product algorithm, a general template for performing such computations exactly in arbitrary tree-structured graphs.
—the configuration of all variables which has the greatest probability. Generalizing these ideas and performing them efficiently leads to the max-product algorithm, a general template for performing such computations exactly in arbitrary tree-structured graphs.
The max-product or max-sum algorithm
The max-product algorithm can be used to find the most probable explanation in a tree-structured probability model. It is generally implemented in logarithmic space to alleviate problems with numerical stability, where it is better characterized as the max-sum algorithm. Since the log function increases monotonically, ![]() , and, as mentioned above,
, and, as mentioned above, ![]() . These properties allow the maximum probability configuration in a tree-structured probability model to be computed as follows.
. These properties allow the maximum probability configuration in a tree-structured probability model to be computed as follows.
As in the sum-product algorithm, variables or factors that have only one connection in the graph begin by sending either a function-to-variable message consisting of ![]() , or a variable-to-function message consisting of
, or a variable-to-function message consisting of ![]() . Each function and variable node in the graph waits until it has received a message from all neighbors other than the node that will receive its message. Then function nodes send messages of the following form to variable x
. Each function and variable node in the graph waits until it has received a message from all neighbors other than the node that will receive its message. Then function nodes send messages of the following form to variable x
where the notation N(f)x is the same as for the sum-product algorithm above. Likewise, variables send messages of this form to functions:
where the sum is over the messages from all functions other than the recipient function. When the algorithm terminates, the probability of the most probable configuration can be extracted from any node using
The most probable configuration itself can be obtained by applying this computation to each variable:
To understand how this works for a concrete example, follow the sequence of messages illustrated in Fig. 9.17, but use the max-product messages defined above and the final computations for the max and arg max in place of the sum-product messages we examined earlier.
The max-product algorithm is widely used to make final predictions for tree-structured Bayesian networks, as well as for sequences of labels in conditional random fields and hidden Markov models, discussed in Sections 9.7 and 9.8, respectively.
9.7 Conditional Probability Models
You may be surprised to learn that the regression models of Section 4.6 correspond to the simplest and most popular types of conditional probability model. The Linear and Polynomial Regression as Probability Models section views linear regression through the lens of probability, and we go on to examine the multiclass extension to logistic regression, expressing this in both scalar and matrix-vector forms. The leap to the matrix-vector form reveals that key aspects of modeling and learning can be expressed in compact and elegant ways. This allows computer implementations to be accelerated by using libraries—or hardware—for matrix-vector manipulation, which are highly optimized and exploit modern computing hardware. Graphics processing units (GPUs) can yield execution speeds that are orders of magnitude faster than standard implementations.
Linear and Polynomial Regression as Probability Models
Suppose the conditional probability distribution for the observations of a continuous variable yi given observations of another variable xi is a linear Gaussian:
where the parameters ![]() and
and ![]() represent the slope and intercept. The conditional distribution for the observed yi’s given the corresponding observed xi’s can be defined as
represent the slope and intercept. The conditional distribution for the observed yi’s given the corresponding observed xi’s can be defined as
As usual, we work with the log-likelihood instead:
This simplifies to

The first term is independent of the data. Thus to find the parameters that maximize the log-likelihood, it suffices to find the parameters that minimize the squared error: