Chapter 19

Solar Grid Parity and its Impact on the Grid

Jeremy Webb*
Clevo Wilson*
Theodore Steinberg*
Wes Stein**
*    Queensland University of Technology, Brisbane, QLD, Australia
**    CSIRO, Canberra, ACT, Australia

Abstract

Market forces, rather than subsidies, will drive a much more diverse mix of PV-based prosumers. Further cost reductions for PV and its urban locational flexibility means its spread to commercial and industrial usages is likely to be particularly rapid, as it will be for urban fringe and remote rural regions where grid connection is uneconomic. For many prosumers in the commercial sector reliance on the grid will be limited, as daylight PV power generation matches power demand. However as renewables reach a critical proportion of energy generation, concentrated solar power or other solutions will be needed for system reliability. In the long run the uptake of corporate prosumers will be an increasingly important variable in grid management as will purchasing power agreements with utilities.

Keywords

solar grid parity
prosumers
battery power
concentrated solar power
purchasing power agreements

1. Introduction

With the closing of the unsubsidized price gap between solar, wind and conventional power sources, photovoltaic (PV) solar is set to attract an increasingly dominant share of renewable power uptake. For the first time that uptake will be market driven with commercial, manufacturing, and large-scale residential buildings likely to figure prominently in this uptake. There is equally the prospect of a growing number of small- and medium-scale hybrid PV, wind, and concentrated solar power (CSP) plants located on city fringes and beyond where high grid infrastructure costs make dependence on renewable energy and storage competitive.
This chapter describes how such developments will promote increased distributed power generation and in doing so change the nature of the interface with power grids and, consequently, the commercial relationship between business customers and power utilities. In this environment, location, size, and type of business will increasingly determine the mix of renewable energy used, and the way in which it is supplied. The chapter explains the likely nature of the interface of remote and city fringe microgrids with utilities. Over the medium-to-long term the effect of future ongoing technological improvements in batteries and CSP solar will play a key role in determining the extent to which commercial and remote communities will remain reliant on the grid or become largely or even wholly independent of it.
Section 2 described the relative cost reductions occurring in renewable power generation-PV, wind, and CSP. Described in more detail are the specific drivers of PV uptake in the United States and Australia. Section 3 shows how the uptake of PV is creating a greatly expanded class of commercial and industrial prosumers. Section 4 describes the way purchasing power agreements (PPAs) are being shaped by PV uptake. The nature of Australia’s uptake of PV solar is outlined in Section 5 and that of California in Section 6. In Section 7 the financing and management of PV solar uptake by business clients is discussed, and in Section 8 the future of a largely PV/wind-based renewable energy system is examined. Section 9 looks at the need for community-based microgrids where PV solar is dominant in the power mix, followed by the chapter’s conclusions in Section 10.

2. The solar energy cost watershed

The current increasingly rapid uptake of solar—albeit from a low base of a little over 1% of global power generation—is being driven by the continuing and substantial fall in the cost of PV and storage installations. This is illustrated by the comparative analysis from the recent MIT Energy Initiative (2015) study on the future of solar energy (Table 19.1).

Table 19.1

Levelized Cost Of Electricity (LCOE) Estimates for Selected Generation Technologies (C/kWh)

Item California (C/kWh) Massachusetts (C/kWh)
Utility-scale PV 10.5 15.8
Residential-scale PV 19.2 28.7
Utility-scale CSP 14.1 33.1
Average over 22 US regions Maximum (C/kWh) Minimum (C/kWh)
Utility-scale PV 10.1 20.1
Utility-scale CSP 17.7 38.8
Onshore wind 7.1 9.0
Gas combined cycle 6.1 7.6
Conventional coal 8.7 11.4
Conventional gas turbine 10.6 14.9

Source: MIT Energy Initiative (2015) and Energy Information Agency (2014).

Note: Numbers are current cost estimates for specified locations in Southern California and Central Massachusetts. The EIA numbers are maximum and minimum 2019 costs across 22 US regions. CSP, Concentrated solar power; PV, photovoltaic.

Thus until very recently, renewable uptake has been almost entirely driven by legislative mandates, subsidies and feed-in tariffs, witnessed by the rapid adoption of highly subsidized residential PV power systems in countries and regions such as Australia, California, and Germany. “In Australia, where more than 1.6 million households are solar powered during the day—the highest globally—subsidies are generally no longer needed. In the US, the Consumer Energy Alliance (2016) is reporting that in some states the combination of incentives provided are now so significant that, they are approaching or exceeding a solar system’s total cost”. Now, with the continuing fall in renewable energy costs the drivers of PV uptake are increasingly market driven. However for different localities the extent to which there is parity with grid power varies. As Mountain & Harris note in Chapter 5, in Victoria, Australia, extremely high grid connection fees and the nature of peak and off-peak prices can push payback periods for rooftop solar out to an average of 12 years.

2.1. Solar Energy Grid Parity

The continuing speed of this cost reduction is illustrated by more recent US estimates (EnergyTrend, 2016), indicating that utility-scale PV costs had fallen 17% year on year for the third quarter of 2015 and are set to fall a further 15% during 2016 and 2017. That would put the Levelized Cost Of Electricity (LCOE) at just $0.07/kWh and, therefore, below coal and in many cases below that of natural gas power plants, as well as being marginally below the cost of wind (it is noted, however, that the LCOE does not adequately reflect capacity value). The narrowing of the LCOE solar/grid cost gap is also a global phenomenon. A Deutsche Bank study (Shah and Booream-Phelps, 2015) compared the retail price of electricity to that of PV solar, finding that in 30 markets grid parity had already been reached. Thus in Australia, USA, Germany, Spain, and China, they found that retail prices—$US0.63, 0.58, 0.50, 0.40, and 0.20 respectively—were below that of the LCOE of solar power, around $US0.50, 0.40, 0.35, 0.28, and 0.10, respectively.
The report which focuses on the potential of industrial solar points out: “In markets heavily dependent on coal for electricity generation, the ratio of coal-based wholesale electricity to solar electricity cost was 7:1 four years ago. This ratio is now less than 2:1 and could likely approach 1:1 over the next 12–18 months.” The report goes on to note that part of the reason for the narrowing has been the increase in grid electricity costs accounted for by transmission and distribution (T and D) estimated to be around 40% of the average electricity bill in the United States. Other studies (Wolfe, 2015) project overall grid parity (wholesale and retail) being reached for most countries between 2017 and 2020.

2.2. Drivers of Solar Power Uptake: USA and Australia

With the critical juncture of PV parity with new nonrenewable energy being reached, nonsubsidized commercial drivers are being added to existing subsidies. Thus in the United States the 30% Federal Government’s tax credit and the mandated Zero Net Energy (ZNE) for commercial buildings in California and a number of other states are creating a turning point in renewable uptake. That is already being reflected in a number of contracts in the United States (Fig. 19.1) following the estimated 73% decline in the cost of PV installations over the past decade.
image
Figure 19.1 Solar PV price and installed PV capacity in the USA. (Source: Solar Energy Industries Association/Gtm Research (2016).)
This particularly sharp increase projected in the graph for 2016 does, however, seem to reflect the fact that the 30% tax break offered by the US Federal Government for solar installations was due to end in 2017 and, therefore, induced frontloading.
However, with the extension of the full tax break in late 2015 to 2020 and a gradated reduction thereafter, this critical incentive plus the projected continuing fall in the cost of PV solar creates the environment for a rapid and increasingly market-driven future uptake. While 2017 uptake levels may, therefore, indicate tax break–induced frontloading in 2016, the projected continuing fall in solar PV below grid prices will provide an ongoing and broad-based incentive for PV uptake. Thus estimates suggest a continuing rapid increase, as illustrated in Fig. 19.2.
image
Figure 19.2 Projected new US solar uptake to 2020.
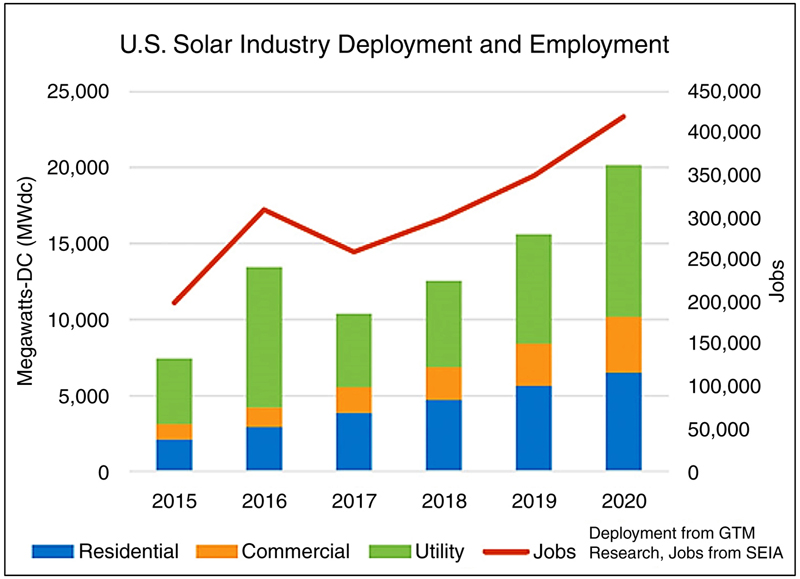
Note: The left to right order of the legend for power-use sectors is replicated in the figure’s bar charts from bottom to top. (Source: Solar Energy Industries Association/Gtm Research (2016).)
The market-driven rise of solar is also a result of its new cost parity with wind. Moreover, given the speed at which countries are now committed to raising their renewable energy mix, the lead-in time for projects is also becoming a critical issue. This is a relevant issue for wind power whose lead time is generally twice that of solar PV. A further emerging problem for wind power is that in a number of countries its installation is being subjected to increasing resistance from sections of the community on environmental grounds.
The way in which the global shift to PV solar as a result of its recently achieved cost parity with wind is clearly illustrated in countries such as Australia, where renewable energy uptake is driven by a mandated increase of renewable energy to 20% by 2020. The Australian Renewable Energy Authority (ARENA) short listed 20 projects for its $100 million large-scale funding round.1 While this was expected to support around 200 MW of solar, because of the dramatic cost reductions that occurred over the past several years, the 10 successful projects will achieve a power output of 480 MW, with an average size of 40 MW AC.
Industry experts, such as the head of First Solar, describe the ARENA tender as a watershed for commercial-scale solar in Australia describing it as “…the biggest tipping point in the industry we’ve seen...” (PV Magazine, 2016). Moreover as Fig. 19.2 projects for the United States, as PV solar falls below the LCOE of grid power in an increasingly wide number of countries, the rise in solar uptake is expected to continue unabated.

3. The rise of distributed commercial/solar

What has been less clearly articulated, however, is the likely nature of the accelerated uptake of PV-derived energy in terms of how companies interface with their power grids and power utilities. Bodies, such as the Solar Energy Industry Association (SEIA) in the United States, are betting that utilities will take the lion’s share of the uptake, as indicated in their projections (Fig. 19.2). However, much depends on the nature and size of the commercial enterprises. A recent 2016 survey of large US-based corporations by PWC2 showed some three-fourth were actively planning further PV renewable uptake and 85% intending to so in the next 18 months. Reasons for doing so were roughly evenly split between a desire to meet sustainability goals, reduce greenhouse gas emissions, generate an attractive return on investment (ROI) (three-fourth of recipients) and to a lesser, but still substantial extent, to limit exposure to energy price variability (almost two-thirds). Key attractions of PV for commercial uses are clearly its scalability, locational versatility, and usability. The latter advantage relates to the fact that the period of greatest power demand of corporates generally matches the period when PV’s generating capacity is at its most productive.

4. The shaping of PPAs by PV uptake

With the rise of businesses’ and particularly commercial establishments’ uptake of PV solar, the range of grid edge agreements has inevitably grown. A PWC (2016) survey shows PPAs being chosen by two-third of those surveyed with slightly less than half choosing on-site PPAs.3 Of the off-site PPAs, 30% are in the form of virtual PPAs.4 However, it should be noted four-fifths of the companies surveyed are planning to build out their renewables portfolio with multiple types of transactions (e.g., an off-site PPA and an on-site financial investment). These choices indicate that large companies with high levels of power usage (in the PWC survey an average of $100 million/annum) clearly have an incentive to directly manage the on-site or off-site generation, given the advantage of being able to take advantage of the Federal Government’s tax credit and lock-in long-term supply at an assured price. In this way, lower costs can be derived from avoiding the expected increase in grid-supplied power which, in the past decade, has been rising at an annual average of over 10% for commercial customers in the United States (Energy Information Administration, 2016).
Unsurprisingly those enterprises that occupy large surface areas have been the first to take advantage of on-site PPAs. The potential for a greatly expanded uptake is considerable. A recent study by the National Renewable Energy Laboratory (2016) indicated that if all suitable rooftops were utilized in the United States, almost 40% of its power needs could be derived from this source. Much of this would come from commercial-sized premises. A study by the US National Renewable Energy Laboratory (2016) puts the areas in the United States suitable for PV installation for small, medium, and large buildings at 4.92, 1.22, and 1.99 billion m2, respectively. Under PV it is estimated the potential annual power generation would represent 25, 5.4, and 8.2% of national sales. Given an average house roof is around 1500 ft.2, there are clearly a considerable proportion of the “small” segment, which represents small/medium-sized businesses in addition to residential.
The attractions of on-site solar for large companies with substantial power needs and large roof areas are set to drive a radical increase in distributed generation for such enterprises is in the pipeline. That is already being led by large single-site retail establishments in the United States, where on-site PV solar avoids the overhead costs which come from being supplied from a distant facility through an established grid.
For the two top commercial direct users of renew able energy in the United States—Target and Wal-Mart—economies of scale of rooftop solar are clearly the key drivers. Wal-Mart generates 105 MW of power from solar panels installed on 327 stores and distribution centers. However, this is only about 6% of all their locations, a percentage it intends to double by 2020. Underpinning this investment is a solid commercial advantage: a 9% reduction in power cost per square foot of retail space is claimed. Target (currently the largest commercial user of solar in the United States) plans to add rooftop solar to 500 more of its stores by 2020. Underlining the market-driven potential of commercial solar uptake, Environment America (2016) in a recent study estimates that if all 96,000 large retail establishments in the United States adopt rooftop solar, it will triple the nation’s solar capacity.

5. Commercial solar uptake: Australia

In countries such as Australia, while residential solar panels have in the past been heavily subsidized, such subsidies have not generally been extended to commercial apartment block complexes. Equally the uptake of commercial-scale solar has been constrained by the absence of ZNE requirements prescribed for commercial buildings and the lack of a tax credit for renewable energy generation of the type available in the United States. Thus the uptake of PV by Australian commercial power consumers—now that PV-derived solar prices are reaching and are set to fall below grid prices— is likely to become a major part of the renewable power uptake.
The spread of commercial-scale PV in Australia cities has particularly high potential where there is a high percentage of (reasonably direct) sunlight hours. The Western Australian Minister for Energy, Mike Nahan notes that the state would not need additional base load capacity during the day over the next decade given the projected increase in rooftop solar (Parkinson, 2016a,b) that would largely come by way of extending PV installations to commercial properties, particularly premises such as supermarkets and large retail stores.
As shown in Fig. 19.3, the annual energy consumption of the commercial services sector in Australia (overwhelmingly in the form of electricity) accounts for around 8% of total power consumption while manufacturing and mining absorb 56%, of which around 40% is in the form of electricity.
image
Figure 19.3 Australia’s annual energy consumption by sector 2009–10.
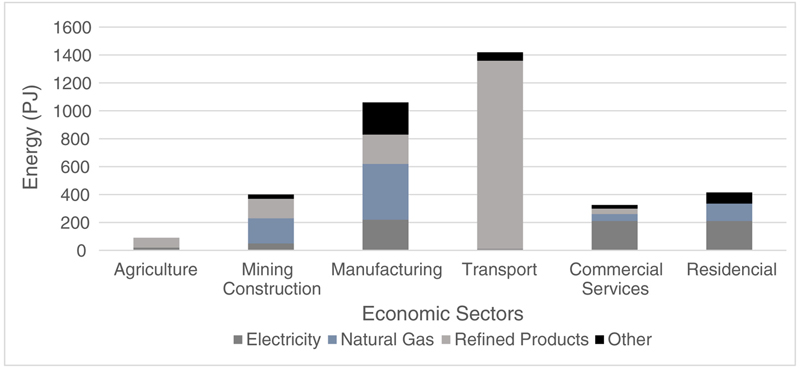
Note: The left to right order of the types of energy listed in the figure’s legend are replicated on chart’s bars from bottom to top. (Source: Zero Carbon Australia Buildings Plan (2013).)
Figs.  19.4 and  19.5 show that in Australia, nonresidential buildings, which typically inhabit cities and which are major power consumers, also typically have large surface areas suitable for PV installations. Moreover, if the retail sector is examined, shopping centers—which have a particularly high potential for extensive use of cost-effective solar PV power generation—account for over half of all retail energy.
image
Figure 19.4 Energy consumption nonresidential buildings.
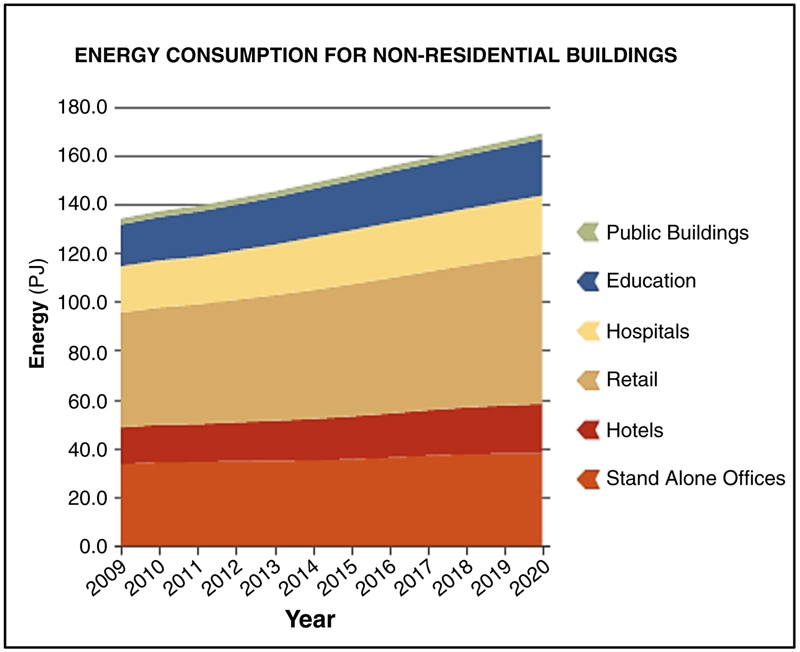
Note: The bottom to top order of the figure’s legend showing building types is replicated in the figure’s levels from the bottom up. (Source: Zero Carbon Australia Buildings Plan (2013).)
image
Figure 19.5 Total retail energy use by retail category.

6. Commercial PV uptake: California

In California the commercial sector is considerably larger and the mining sector considerably smaller although their combined energy consumption is very similar to that of Australia (Figs.  19.6 and  19.7). Given the high utilization of electricity by these sectors, there is a corresponding wider scope for PV installations.
image
Figure 19.6 California electricity consumption by sector. (Source: California Energy Commission (2008).)
image
Figure 19.7 Californian commercial buildings by type. (Source: California Energy Commission (2013).)
An emission-driven approach is very much a part of Californian and the EU5 strategies. The Californian Energy Commission announced in 2016 that all new commercial buildings and 50% of existing commercial buildings have to be ZNE by 2020 (residential by 2030). As 75% of the existing housing stock and 5.25 billion ft.2 of commercial space were built before these standards were introduced, their conversion will represent a substantial proportion of power savings.
Indeed, a 2013 study commissioned by the California Public Utilities Commission (2015) found that the commercial sector had the greatest potential for growth and the lowest market barriers (Fig. 19.8). As part of the 2020 target for new buildings they now must provide roof space for the addition of future solar collectors.
image
Figure 19.8 Californian Energy Savings Potential: Commercial Zero Net Energy (ZNE) buildings.
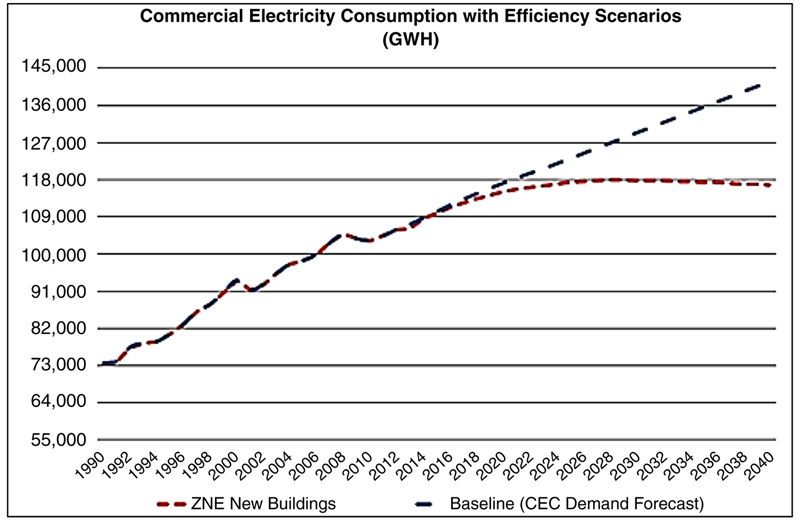
Note: This represents an approximate assessment of the effect of ZNE for all projected future new construction, which is projected to require some six new 500-MW power plants to meet load. (Source: Fogel (2015).)
The cost benefit to do so for some, however, will depend on the way in which the ZNE concept is defined. It is simply expressed as the net of the amount of energy produced by on-site renewable energy resources, which is equal to the value of the energy consumed annually by the building. The measurement of power consumption, however, uses a time-dependent valuation metric, which means that energy generated/used in peak hours has a considerably higher metric than energy generated/used in off-peak times. While such a metric may pose issues for domestic houses to which it also applies, it is obviously more favorable for commercial and industrial premises, a substantial proportion of which, has peak power usage during periods of peak PV power generation.

7. Financing and management of large-scale corporate uptake of PV solar

As the uptake of PV-derived power has gained momentum, the changing grid interface is creating a greater variety of financing and management instruments. Large corporations, such as Wal-Mart and Target, with exceptional on-site PV potential have chosen to outsource their financing to third parties. Thus in Wal-Mart’s case a third party, SolarCity, has provided the finance and responsibility for the installation of PV store solar. Wal-Mart then purchases back from SolarCity the power generated at an agreed prices on a long-term contract. Target has similar arrangements in place. In this way large retail enterprises indirectly derive benefits from the US Federal Government’s tax breakthrough, lowering its effect on the contracted power supply price with the third party. Importantly the retailer derives the key benefit from this arrangement in the form of a long-term assured price for power. Such an arrangement will, therefore, be an increasingly attractive proposition for enterprises with economically large enough adjacent space or rooftops to justify PV installation. In addition the relatively new variation in the form of virtual PPAs provides a means of price hedging the cost of renewables.
However, many large organizations do not have a PV-friendly physical profile. Thus Starbucks with a large number of small establishments has taken the alternative route of claiming to be 70% carbon free through the purchase of carbon credits, thereby retaining its existing linkages with power utilities. For Starbucks this has evidently made good commercial sense in terms of branding. However, while this represents a rapid, administratively and financially simple method of greening the company, as PV energy prices fall and grid prices continue to rise, an effective increase in the price of electricity will be imposed.
With a rapidly falling price of solar (and to a lesser extent of wind), the incentive is now for corporates to create distributed forms of generation in which they capture both green credentials and the expected lower power bills in the future. Thus the trend for large corporations in accessing renewables has been away from the use of carbon credits and toward an uptake of PPAs. Companies, such as Google, that claimed carbon neutrality in 2007 through carbon credit purchases have since moved to create “true” carbon neutrality though PPAs (as indicated in Fig. 19.9). For Google that was achieved largely through power from wind farms, which, over the past decade, were the most cost-effective means. Google says it will achieve PPA-derived carbon neutrality in 2017.
image
Figure 19.9 Cumulative corporate renewable energy purchases United States, Europe, and Mexico to November 2016.
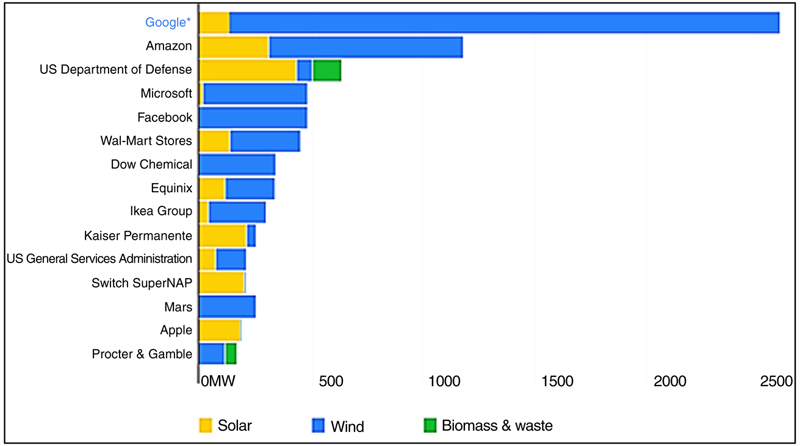
Note: The left to right order of the figure’s legend listing power sources is replicated in the figure’s bars from left to right. Biomass and waste are represented by the bar’s third segment for the US Department of Defense and Proctor and Gamble. (Source: Bloomberg New Energy Finance (2015).)
Other major corporations have followed (Fig. 19.9). These companies have either used off-site PPAs (in which the renewable power generation is fed into the grid and an offtake taken by the enterprise at an agreed price and contract period). The relatively new instrument—the virtual PPA—is also being used to hedge against price variations over time.
There are, therefore, good reasons why various forms of PPAs will increasingly be the corporate path to green renewable energy. It is reasonable to assume that as greenhouse gas reduction targets become increasingly tight, green credentials will become a more widely desired corporate profile. It is also likely that use of PPAs will become more attractive to smaller medium-sized corporations given the hard and soft costs of PV solar and to a lesser extent wind, will continue to fall (particularly soft costs in the United States where they are substantially higher than in Australian and Europe).
In doing so utilities will clearly need to be developing new business models in which their grid focus becomes one of managing a complex of distributed facilities involving both off- and on-grid instruments. While grid feedback issues are less relevant to commercial customers whose usage more generally matches solar generation cycles, this is not the case for condominiums that choose to collectively develop renewable solar power and for some industrial plants. Structuring of PPA’s may, therefore, need considerable creativity in their construction.
As noted in the Californian Energy Commission’s (2016) Draft “Existing Buildings Energy Efficiency Action Plan,” this issue of feedback tariffs is still to be resolved and clearly remains a controversial one. As the draft notes: “Procurement-based energy efficiency may be helpful for reaching the Governor’s objective to double efficiency gains in existing buildings. In a procurement setting, many of the details around delivery of energy and related grid services would be contained in procurement contracts, rather than emerging from the energy efficiency program portfolio.” That is, long-term contracts for power supply with utilities could be made in return for concessions relating to power feedback into the grid. This outcome may be a (albeit complex) formula (similar to that which has been offered to a range of residential clients in California), where long-term contracts for power supply with commercial enterprises are made in return for concessions relating to power fed back into the grid.
California’s work in progress on feed-in tariffs reflects, as pointed out by Baak in his chapter, that California’s power management system has focused more on the technical enabling aspects of distributed energy resources (DERs), rather than the market mechanisms needed to accelerate deployment.

8. The future of a PV/wind-dominated power supply

For most countries that are in the process of rapid uptake of renewables and in particular PV, a critical point will be reached where the associated process of intermittent and increasingly distributed power generation creates a base load capacity problem. Analysts indicate that will be the case for Australia and California around 2030 when renewables will account for 30%–40% of generated power. Such problems are already showing up in South Australia, where statewide blackouts have occurred due to a coincidence of storm damage to renewable installations and failure of grid backup. Similarly there are signs of strain already in the Californian energy network.
At this point, the “duck curve” becomes an issue, as the lack of base power in periods of peak residential use becomes a critical issue. For utilities the key issue is whether renewable sources will be able to handle this demand and in what form, as this will very much determine what happens at the gird edge between consumers and suppliers. The capacity of the grid to handle the DERs of commercial customers will depend crucially on the mix of clients that choose to uptake PV solar (or wind if cost effective). Those that operate during the day and have on-site solar may have only a limited interaction with the grid, given they would typically use all that they produce. Others with less suitably matched energy-use profiles and/or use the grid to draw from off-site power installations, may well, when in large numbers, lead to grid stress, as the renewable proportion increases.
In part base power may be supplied by minigrids, which cost effectively aggregate direct feedback from surplus distributed solar and battery sources. This is what is described in a landmark study by Energy Networks Australia (2016) (the national industry association representing Australian electricity networks and gas distribution businesses) and CSIRO (Australia’s lead government-funded scientific research organization). The study suggests that by 2050, a zero-emissions grid for Australia could viably have several million customer–owner prosumers supplying between 30% and 50% of the grid needs.
However if a renewable grid’s integrity is to be assured, there are those who argue that both distributed battery- and CSP-based storage will need to play major roles in providing a substantial sources of dispatchable and flexible renewable power. The US Department of Energy projects that CSP’s costs will continue to fall substantially (Fig. 19.10) through to 2020, as improved technology is applied.6 If so, the speed at which renewable (wind and PV) uptake is achieved is likely to accelerate (Fig. 19.11) given CSP’s key advantage as a beneficial enabler of PV and wind, where their generation is curtailed (with a subsequent loss of revenue). That is, CSP with its flexible combined generation and storage can ensure that renewable energy continues to be used as illustrated in Fig. 19.11.
image
Figure 19.10 Projected fall in the cost of CSP.
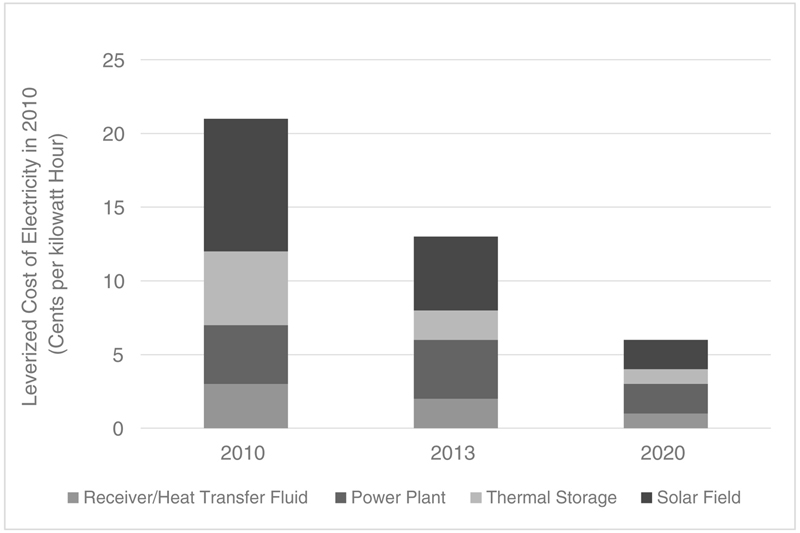
Note: The left to right order of the legend’s listing of different types of power generation systems are replicated on chart’s bars from bottom to top. (Source: US Department of Energy (2016).)
image
Figure 19.11 Effect of CSP with storage on uptake of PV and wind.
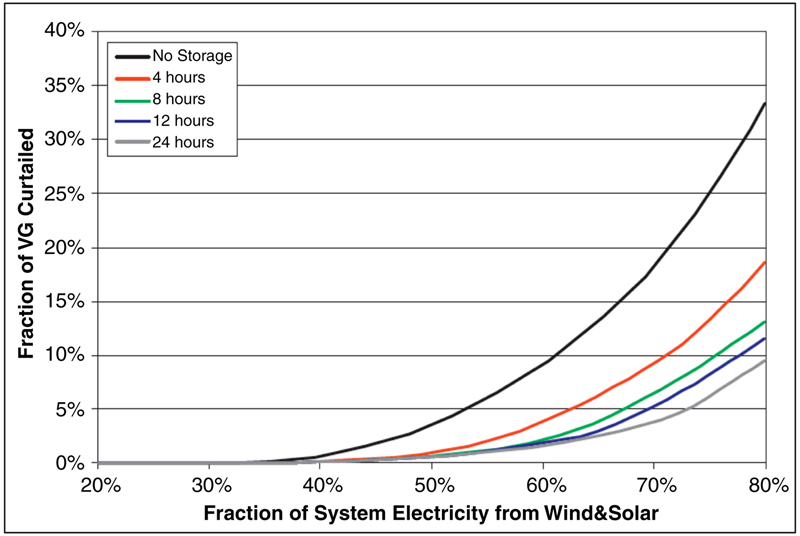
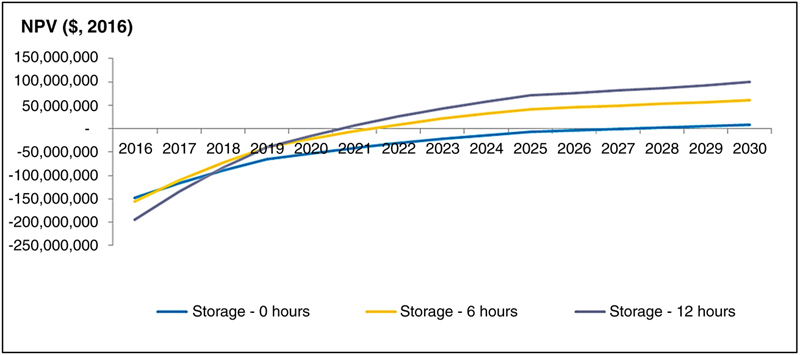
Note: The legend’s top to down order for storage hours is replicated in the same order by trend lines on the figure from left to right. (Source: Denholm and Hand (2011).)

9. Community-based microgrids

A further evolving development from the falling cost of renewable energy is its increasing capability to provide reliable energy for the edge of urban and remote communities, where extension of and additions to grid-supplied power has become excessive.
The economics of such distributed, largely or wholly off-grid solar installations can be substantively affected by, first, the location (e.g., local irradiation levels and weather conditions) given solar power generation can vary substantially according to latitude. Second, as noted, there is the uneconomic cost of grid extension to locations on city fringes and remote communities. Third, in the future the spread of remote off-grid solar/wind power systems will rely on further cost reductions flowing from innovation and economies of scale.
Such drivers are particularly relevant to countries, such as Australia, which has high levels of solar irradiation, many highly remote communities, and extensive city fringe regions. Spanning over 5000 km, the Australian electricity grid is the largest interconnected power system in the world and, therefore, has a high per capita cost. There is, consequently, a very real prospect of highly distributed urban-scale solar systems outside major urban agglomerations and which provide distinct economic advantages.
However, very remote areas typically mean relatively high levels of dispatchability will be needed if grid support is limited or absent. A declining cost curve for CSP is, therefore, likely to be a critical element in the spread of distributed rural power generation. That is particularly so given that, as illustrated in Fig. 19.12, thermal energy storage, of the kind offered in conjunction with CSP, remains more economic than PV/battery storage for periods of over 3 h (calculated over a 20-year payback period).
image
Figure 19.12 CSP with thermal energy storage compared to PV plus batteries when more than 3 h of storage is required; net present value basis. (Source: Stein (2015).)
However, this is not viable if the energy has to be transported long distances. In such cases PV/battery storage becomes viable for those in rural communities.
The key then to the rise of community-based (and possibly owned) remote community microsolar grids is further substantial technological breakthroughs in CSP and, in the more immediate term, further substantial falls in the cost of battery storage. In the meantime in the Australian Capital Territory, where the local government’s aim is a 100% renewable grid, storage is being based on the use of battery storage. Currently underway is the deployment of around 5000 battery storage systems in homes and businesses in the Capital Territory. This will be equivalent to around 36 MW of battery storage capacity, which is estimated to deliver around $220 million in network savings to the local grid.
It should nevertheless be noted that CSP is not a viable option if the energy it stores has to be transported long distances. In such cases PV/battery storage becomes viable for those in rural communities. In addition, in the medium term there is the option of hybridized storage, involving the use of gas as a booster for CSP thermal storage.
Just how a fully independent off-grid community facility is to be financed and managed is likely to become a critical issue for utilities. While CSP is locationally inflexible Jones et al. (Chapter 4) argue that given up to a half of the US population are not able to participate in solar net metering (all roofs are not suitable for solar array or residents are in rented premises), community solar arrangements are logical developments to assist them in benefiting from renewables. Thus they note regional aggregation of solar arrays linked to renewable installation off-site (which could include CSP and/or use of a gas booster) for at least a portion of the customers’ needs make a great deal of sense. In such inclusive community microgrids, all community members would pay according to their net contribution/usage of power.
A future model for remote communities is being pioneered in the United States by the Vermont utility Green Mountain Power, which is trialing the financing of customers into completely off-grid power system–based solar panels and backup batteries. This “Off-Grid Package” marks the first time that a US utility has offered customers the option of getting utility financing and technical assistance to generate their own power independent of the power grid.
Under such an agreement, customers will pay the utility a monthly fee. In the case of the Vermont trial, community residents would pay between $400 and $850 for their power supply for an average monthly energy consumption between 400 and 800 kWh. That turns out to be less than installing their own power systems or paying for the utility to extend its power lines to reach them. As part of the deal Green Mountain Power recovers its fixed costs, plus a small margin that flows back to the rest of its customer base.

10. Conclusions

There is sufficient evidence to indicate a watershed has arrived in terms of pricing of renewable energy. The unprecedented recent and continuing decline in the costs of PV—and to a lesser extent, wind and CSP—are, for the first time in history, making renewables cheaper than carbon-based power. These are rates and speed of price declines, which very few advocates of solar, and certainly not policy decision-makers, anticipated.
This watershed in pricing relativities now means that renewables—and in particular solar—uptake will be market driven, self-sustaining, and far more broadly based. Thus while subsidy withdrawal is likely in the short term to slow residential PV uptake, a substantial uptake of PV power by private and public enterprises and from urban fringe and remote communities is in the market-driven pipeline. At the same time, as PV solar costs fall below wind, it should be expected that the mix of renewable power generated will be increasingly solar based—and in particular PV based—and increasingly distributed.
Such developments, and in particular the scalability of PV and its locational flexibility in urban areas, will provide the environment in which a considerable proportion of commercial consumers will have the opportunity to generate a substantial proportion of their power. This trend is likely to be reinforced by the expected lowering of its cost compared to wind. This development is already being led by large retailers with high power consumption of large solar panel–suitable roof areas. In light of projections of continuing price declines for PV many corporates will be able to better capture the cost-reduction benefits through direct and indirect ownership of power generation. However, as the MIT Energy Initiative (2016) study points out, that has the potential, if commercial solar arrays are located in close proximity, to stress the local distribution network.
On the other hand, given that most enterprises’ power consumption largely matches daylight hours, power from solar arrays would generally be directly and fully consumed with minimal feedback to the grid. Utilities will, therefore, face some difficult choices as large-scale grid demand shrinks. As Sioshansi (2015) notes, US utility revenues may experience a 13% fall in revenue by 2025 due to the dual effect of increased solar PV self-generation coupled with energy efficiency gains. Moreover with the rise in DERs, their capacity to directly manage power prices with commercial customers will commensurately recede.
One of their keys to retaining commercial customers will, therefore, be an early recognition that different locational profiles of commercial and industrial enterprises will demand different and often creative types of agreements for financing and managing increasingly distributed power generation. Needed, therefore, will be the capacity to offer a range of PPAs, both on-site and off-site.
A further challenge and opportunity will occur when grids become overburdened with solar and wind renewables and base load power becomes a critical issue: based on present trends this is projected for Australia and California around 2030. The challenge for utilities is the prospect that this demand for base load may well be met in part by distributed battery storage, as their costs continues their long-term decline.
However, it can be argued that ultimately, if base load is to be renewable, it would need to be substantially and cost effectively derived from CSP. Importantly, the likely emergence of cost-competitive CSP over the next decade will allow large enterprises and remote/urban-edge communities to create wholly off-grid power generation facilities. In such cases utilities, if they are to retain their corporate clientele, will need to move their business reach to financing, construction, and managing such facilities. Clearly, in such an environment, the capacity of utilities to transition from management of relatively few stand-alone plants to managing a large number of small plants is likely to define their success or failure to survive and prosper.

1 This round is likely to be the last in which subsidies will be offered for mainstream renewables, such as photovoltaic (PV) and wind.

2 Around two-thirds of companies surveyed had turnovers of over $10 billion and energy bills in excess of $100 million annually.

3 Of those companies indicating they were not about to take up solar power in the foreseeable future, a little over half cited the perceived unattractive return on investment, indicating that a residual of companies may have considered the absence of a tax incentive as a sufficient drawback to not proceed.

4 Virtual purchasing power agreements (PPAs) involve the renewable power facility supplying power directly into the grid and the company deriving the contracted output of the facility from the grid.

5 The 2010 EU Energy Performance of Buildings Directive and the 2012 Energy Efficiency Directive put in place measures that required EU members to mandate that all new buildings be near-zero energy buildings by December 31, 2020 (public buildings by December, 31 2018). For existing buildings, member states are required to draw up national plans to increase the number of nearly zero energy buildings, though no specific targets have been set.

6 For concentrated solar power (CSP) to successfully provide flexibility to a grid with an increasing penetration of variable renewables, the future power block will need to be more advanced than today’s subcritical steam turbines, such as closed turbine cycles based on supercritical CO2 as the working fluid. The resulting higher temperatures will also mandate new storage materials, such as particles or phase change materials.

..................Content has been hidden....................

You can't read the all page of ebook, please click here login for view all page.
Reset
3.128.198.170