Understanding and scoping process problems
Keywords
Business process case for change; Business rules; Capabilities gap; Case management; Cause-effect diagram; Complex processes; Decision management; Gap model; Initial process description; Input problems; Knowledge work; Output problems; Performance gap; Problems with controls; Problems with enablers; Process decomposition; Scope diagram; Simple processes; Stakeholder diagram
In a few leading companies a corporate business process management group will use a business process architecture and associated performance measures to define and scope new process redesign or improvement projects. Most organizations are less mature. In those organizations it is usually a senior manager who decides there is a problem and creates a team to determine what can be done. In this situation the team begins by gathering information in an effort to understand the nature of the problem that concerns the manager who initiated the effort. In such an informal situation one cannot assume that the manager who initiated the project really understands the problem. The manager knows something is wrong, but he or she may not know exactly what activities are causing the problem or have a clear idea about the nature of the changes that will be necessary to resolve the problem. In essence, the first task of any process team is to be sure that it has a good definition of the nature and scope of the problem. Once the team understands the problem it needs to consider in a very general way what kinds of changes might make a difference. In some cases the team should be prepared to tell the manager that the problem cannot be solved within the time or the budget that the manager has suggested. In other words, the first phase of any process change project is to define the project itself, consider possible solutions, and then make a recommendation about what level of effort and budget will be needed to solve the problem.
In this chapter we want to consider the nature of business process problems and suggest some smart approaches to scoping a process redesign or improvement project. We begin with a general discussion of the nature of processes to establish a common vocabulary and then we proceed to consider the nature of the process problems that teams are likely to encounter. We end with a discussion of techniques for scoping problems.
What Is a Process?
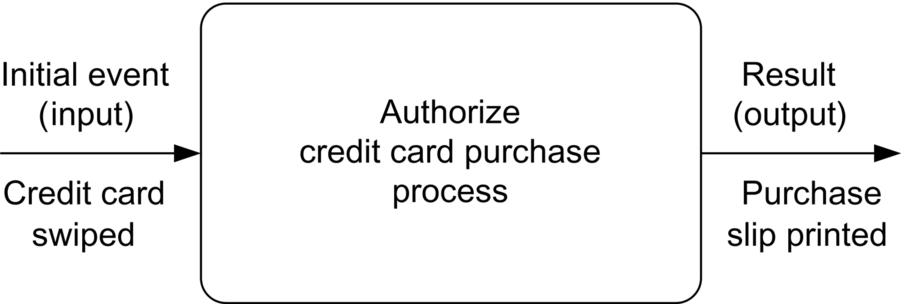
As we mentioned in an earlier chapter the idea of a process is becoming more flexible as organizations try to tackle newer business situations, especially situations in which what is done varies according to the client and circumstances. The classic concept of a process describes it as a bounded set of activities that are undertaken in response to some initiating event to generate a valued result. Processes can be very simple or extremely complex. One example of a process might involve the use of a software application that is initiated by a salesperson swiping a credit card across a reader. The software application called by the reader would proceed to transmit information to a credit card center mainframe to determine if the card is valid and the amount is acceptable. Upon receipt of an approval, the application might cause the reader to print out a purchase slip for the customer to sign (see Figure 8.1).
When process work was first done in manufacturing and was very much influenced by systems theory it was popular to say that a process took inputs and transformed them into outputs. I still find this acceptable, but many today prefer to avoid this language, feeling that it sounds too much like a manufacturing operation where physical objects were literally reshaped into a physical product. Most of today’s service processes are more likely to take information and modify it to generate new data, recommendations, or a printed document. Some prefer to say that the process creates value.
Consider another process that might be initiated by a call from a taxpayer for help in determining what tax form to use. In this case the call would be answered by a person who would ask questions and then tell the taxpayer what form to use. We can imagine a general description of the answer taxpayer inquiry process, and hundreds of instances of it as particular tax clerks answer phones and undertake the process with different taxpayers. Still another process might be a corporate supply chain that responds to customer orders by generating and delivering products to customers. The supply chain process at any large company is complex and could easily be subdivided into subprocesses that contain hundreds of activities and thousands of business rules and are implemented by employees located throughout the world.
We understand that our initial definition is a little vague, but we prefer to use the word “process” informally, as the term is normally used, and then refine our understanding with some adjectives.
One important distinction to consider when thinking about a process is whether it functions as a core or operational process, a management process, or an enabling or support process. We discussed this in Chapter 4 when we considered process architectures, and you should review Figure 4.6 if you are unclear about the distinction.
Process Levels and Levels of Analysis
Another key concept is the idea of a process hierarchy and the use of levels to describe the subdivision of processes. We show an abstract process hierarchy in Figure 8.2 and have added notes on the left to suggest how a process analysis effort will tend to vary, depending on whether we are dealing with very large processes, mid-level processes, or specific activities or tasks.
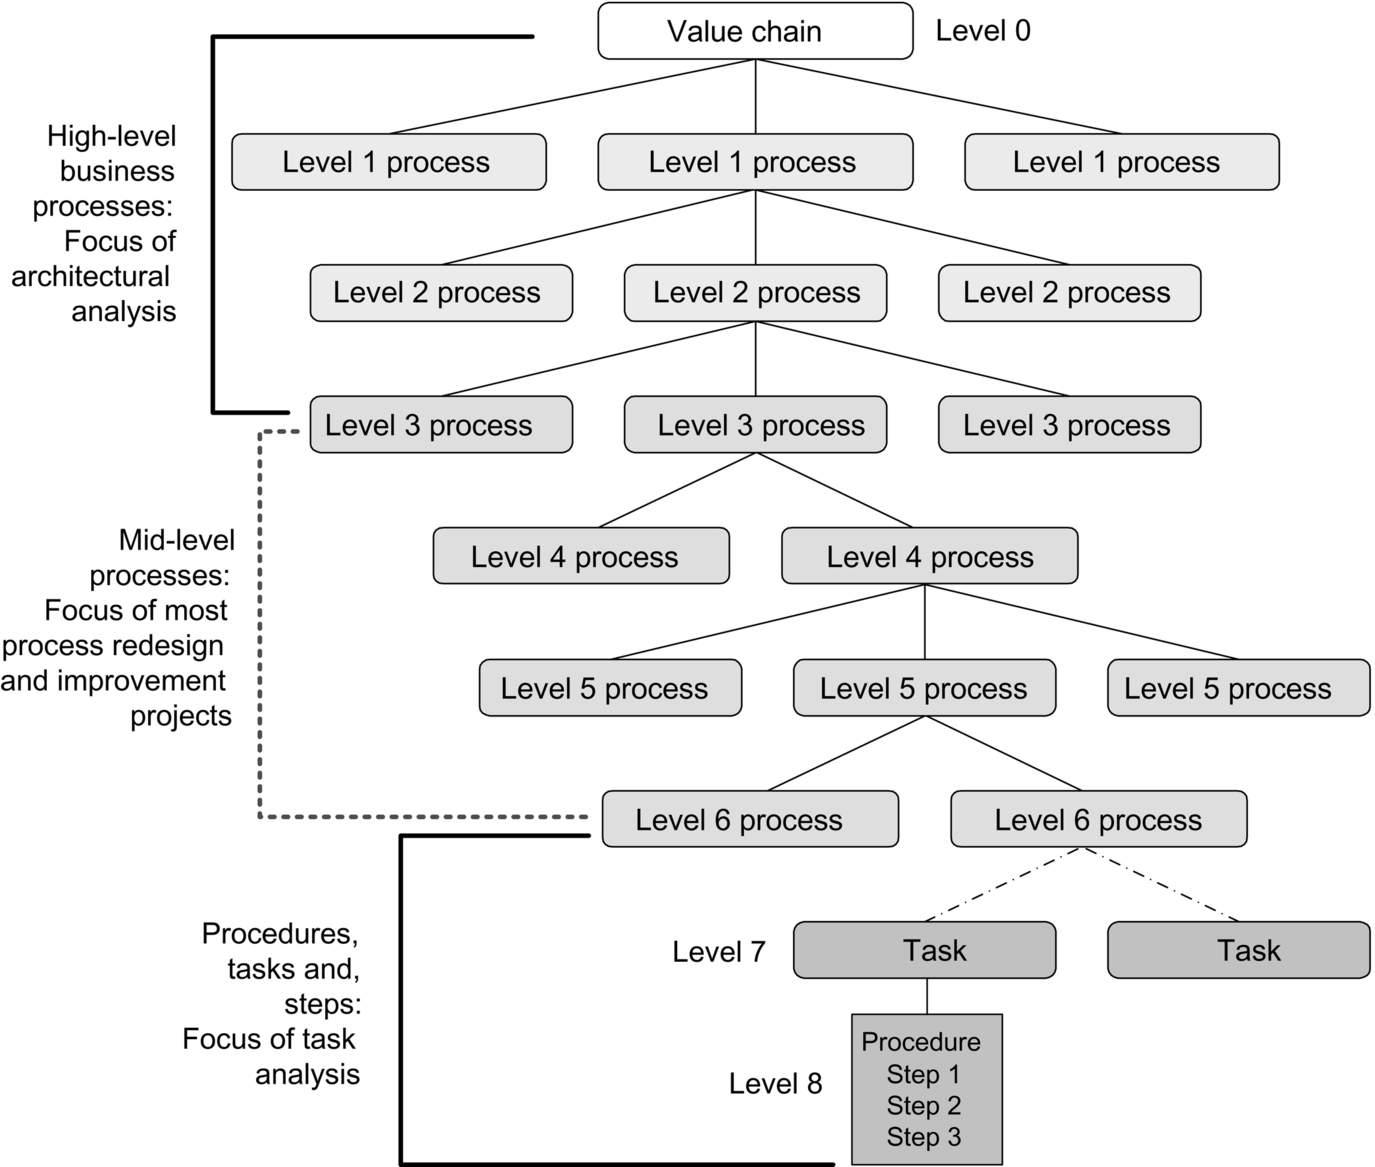
As a generalization, we can usually divide the process hierarchy into three parts and associate problems and analysis techniques with specific levels. Broadly, one set of process analysis techniques is used to redesign or improve higher level processes. Another set is used on the types of process problems we find in the middle of the process hierarchy. Still another set of techniques is appropriate for processes at the bottom of the hierarchy. Figure 8.3 provides an overview of this three-part distinction.
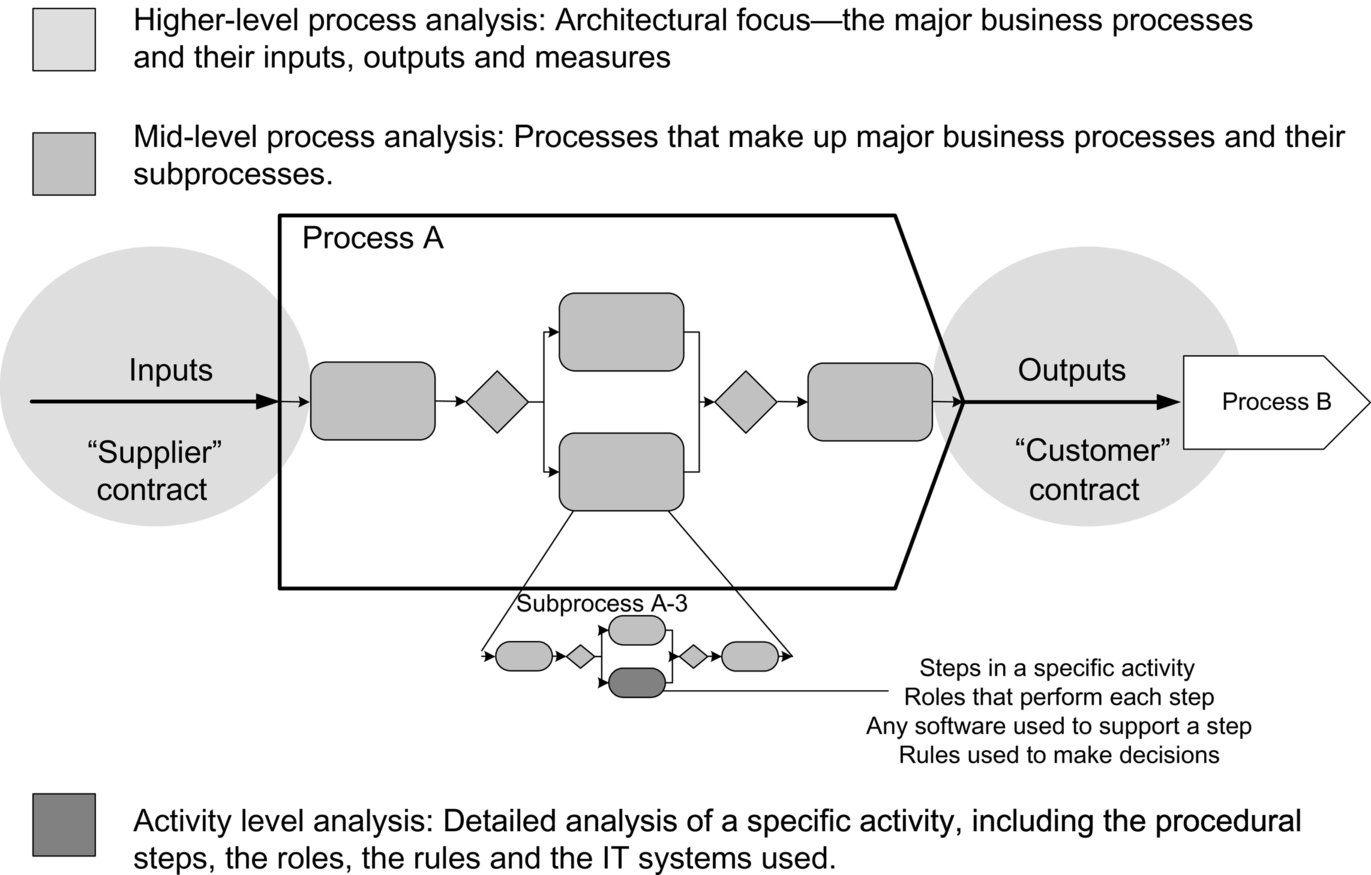
Thus the top part of the process hierarchy is usually associated with architecture problems and with problems of coordination between departments or functional units. In this case we focus on aligning inputs and outputs and write contracts to specify what Process A will need to deliver to its “customer” Process B.
Midsize problems usually occur in processes managed within a single department or at most a few departments. The problems often require that the processes be simplified or the sequences rearranged. Nonvalue-adding processes or subprocesses need to be removed; some activities need to be automated.
Low-level problems usually involve individual performers or software systems. They usually require a detailed task analysis. In some cases the business rules used by the performers or the systems need to be specified. Often training programs and job descriptions need to be developed.
Simple and Complex Processes
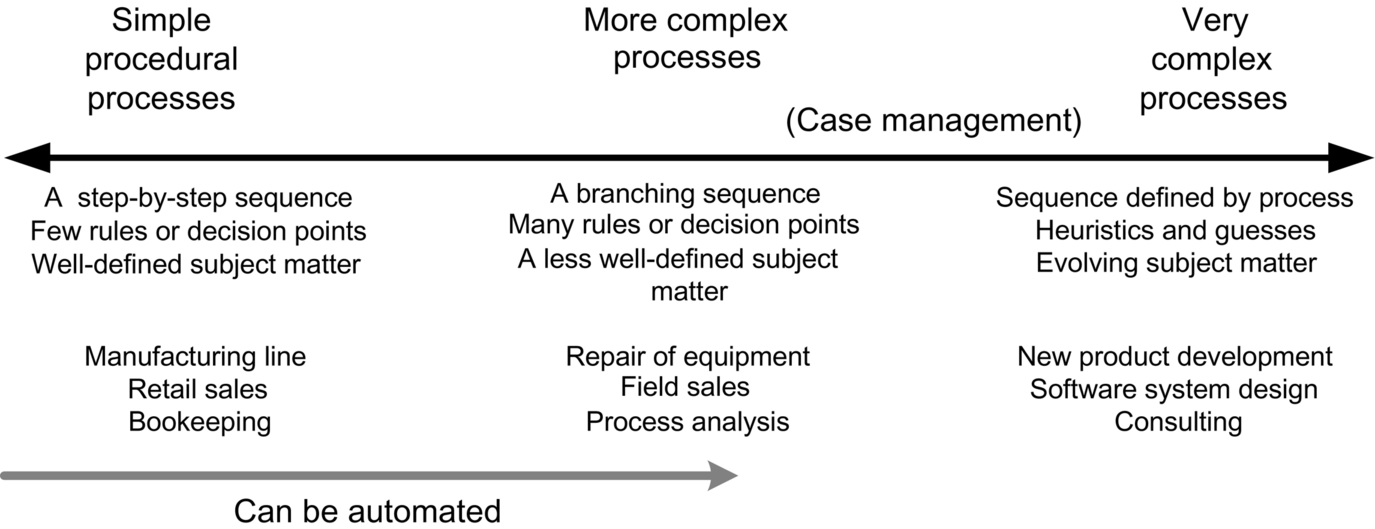
Another way to begin the analysis of a process is to consider the overall complexity of the process you are going to analyze. Simple processes usually follow a consistent, well-defined sequence of steps with clearly defined rules. Each step or task can be precisely defined and the sequence lacks branches or exceptions.
More complex processes involve branches and exceptions, usually draw on many rules, and tend to be slightly less well defined. They require more initiative on the part of human performers. Really complex processes demand still more initiative and creativity on the part of human performers. They are usually processes that cannot be automated using current technologies. We usually do not train people to do these tasks, but hire people who have advanced degrees and have already demonstrated the creative or analytic skills required. These processes are less well defined, change often, and evolve as time passes. Successful performance usually requires that the performer study an evolving body of knowledge to be prepared to perform the tasks required to create successful results. Figure 8.4 illustrates the continuum that ranges from simple, procedural processes through more complex processes to very complex processes.
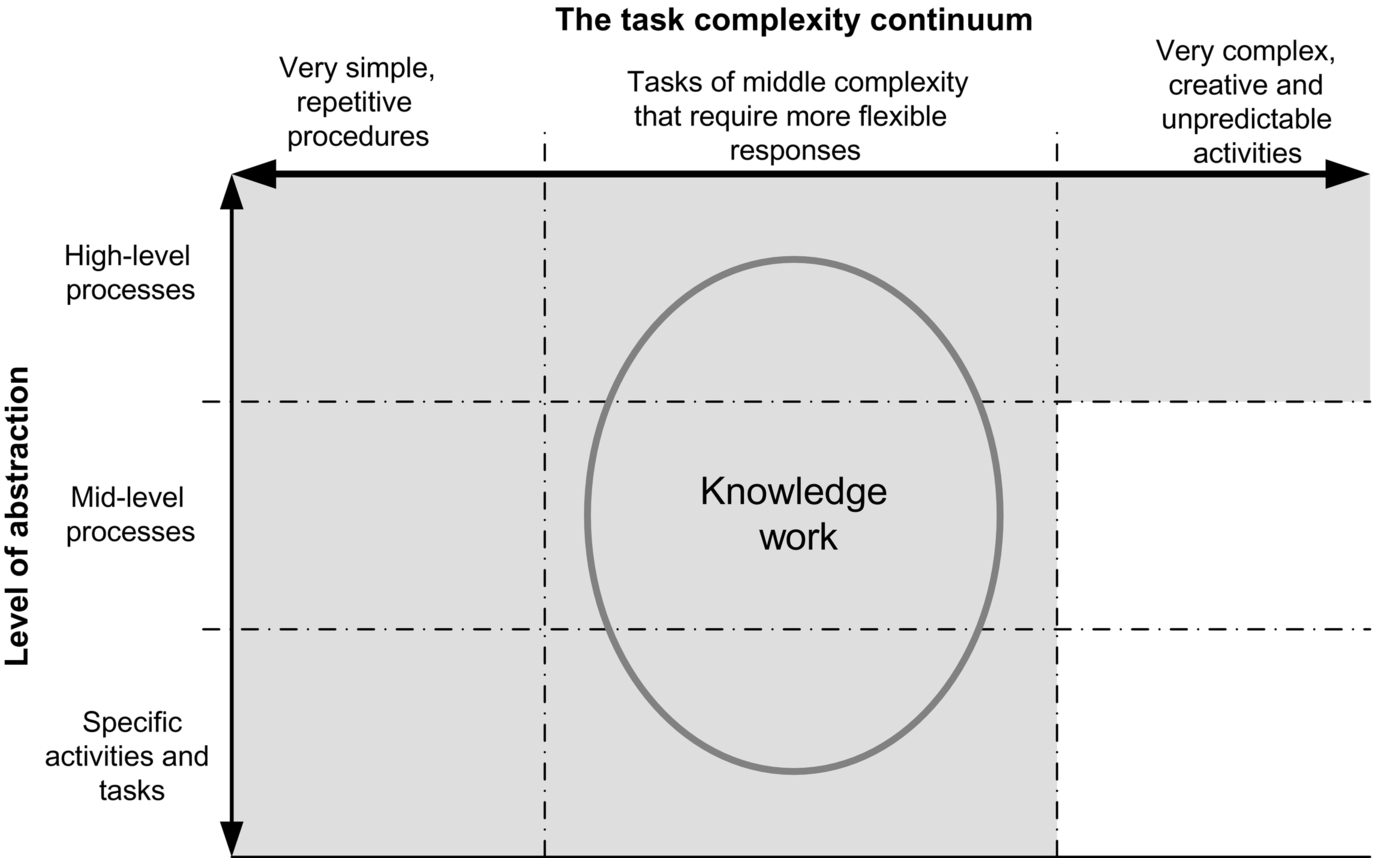
It is popular today to suggest that the nature of work has changed in advanced economies. In the past workers were more likely to be engaged in the type of procedural tasks one still finds in production line manufacturing and in some clerical tasks. Increasingly, however, today’s workers are engaged in tasks that require more knowledge, and many writers refer to them as knowledge workers. For some this implies that the workers use computers to acquire or manipulate the information they need to do their jobs, but for others it simply refers to the fact that the workers perform in more complex processes.
Figure 8.5 pictures the space that results when we cross levels of analysis with process complexity. On the horizontal axis we place the task complexity continuum. To the left we have simple, repetitive tasks. In the middle we have tasks that require more skill and flexibility. On the extreme right we have tasks that are very complex and require considerable creativity. On the vertical axis we have placed a continuum that ranges from high-level, very abstract processes at the top to low-level, very concrete activities and tasks at the bottom.
As long as we are trying to provide only a very high–level overview of the processes involved we are not concerned with the specific nature of the task. At the architectural level it is possible to describe both procedural and complex processes with equal ease since we are not concerned with details, but only with abstractions. Thus, for example, a supply chain is a very large process that contains some procedural subprocesses and some very complex planning subprocesses. At the level of abstraction that we work at when creating a business process architecture and defining major process performance measures we simply do not care about the numerous and various specific tasks that make up the high-level processes. The real supply chain may involve numerous loops and feedback cycles, but at the high level we are simply concerned with defining major processes that will need to be managed and measured and defining handoff points that will need to be coordinated. For this, conventional modeling with a workflow notation, such as Supply Chain Operations Reference or Business Process Modeling Notation, will serve very well.
Extending our analysis we can analyze and describe mid- and low-level procedural processes without too much difficulty. It becomes more difficult as we try to analyze mid- and low-level processes of moderate complexity, and it becomes very difficult to analyze mid- or low-level processes of great complexity. Consider one example—the various activities of the CEO of a large corporation. It might be possible to specify that all CEOs are concerned with several general processes, such as defining company strategy, finding a successor, and maintaining relationships with senior government officials. Beyond such generalizations, however, it would not be valuable to try to analyze exactly how the CEO went about defining strategy, let alone how he or she managed very specific tasks, such as conducting interviews or handling luncheon meetings. Companies do not try to specify exactly how their CEOs, their creative marketing directors, or their lead software architects should do their jobs.
It is increasingly popular to refer to very dynamic, complex processes as case management processes. This term is derived from medical practice, and the term case in this instance refers to a patient. When we look into notation in more detail in later chapters we will consider some proposals for how we might model very dynamic processes.
Most process analysts today, however, are not focused on case management processes, but they are definitely focused on defining and improving processes that involve knowledge workers. Analyzing the activities of these individuals is complex enough and the analysis techniques we will focus on in the remainder of this chapter are mostly used to define mid-level processes of moderate complexity. That is where the interesting challenges in analysis and design lie today.
Business Process Problems
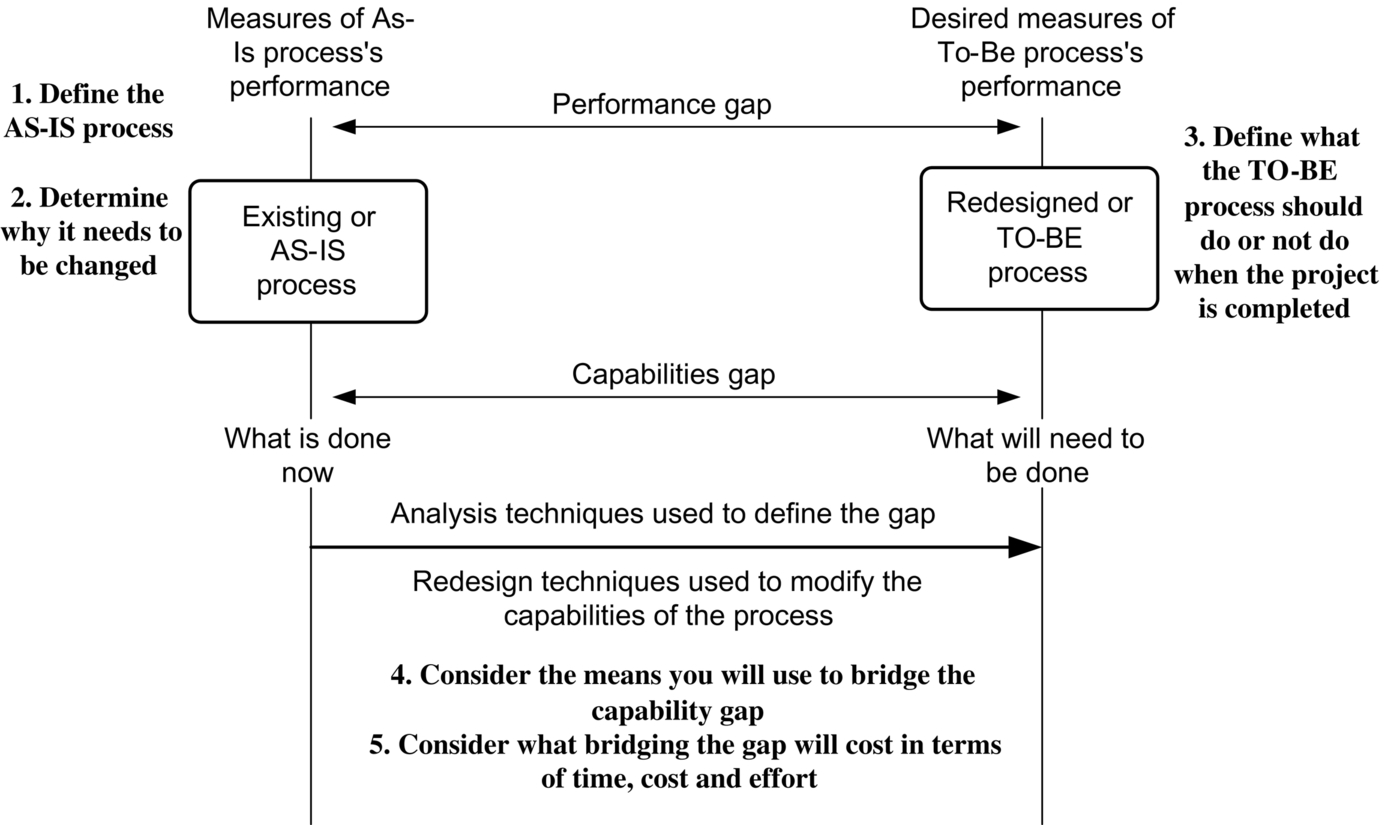
Projects often begin with problems. The challenge is to figure out the nature of the problem, and then to consider what kind of intervention might be required to resolve it. We can formalize this a bit with a model of problem solving—which we refer to as the Gap Model—which we illustrate in Figure 8.6. Formally, a problem is the difference between what exists now and what we desire. We represent that with two boxes. The left box is labeled the existing or As-Is process. The right box is labeled the redesigned or To-Be process.
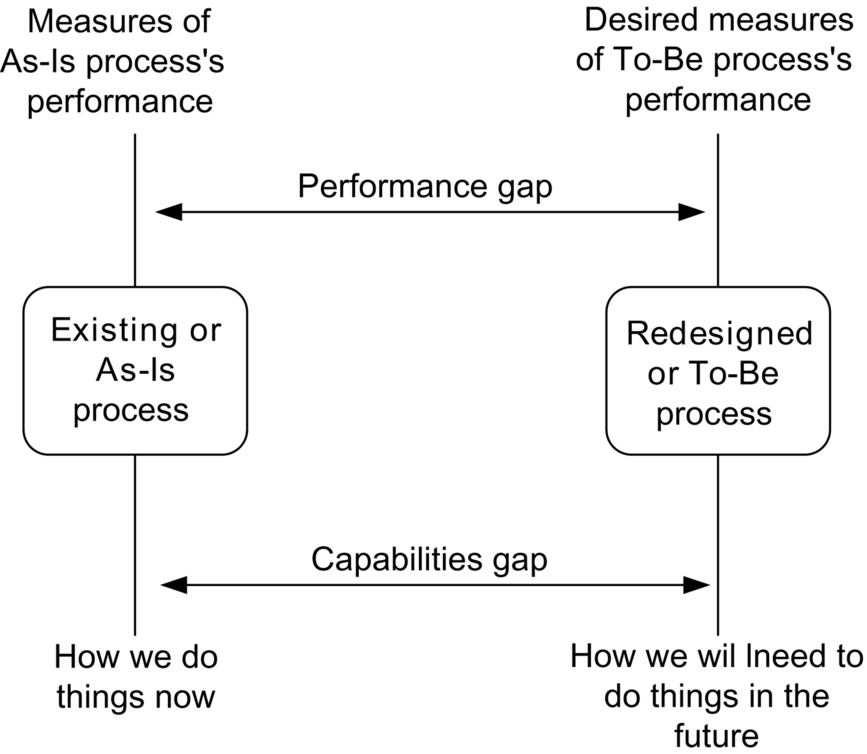
We can talk about the As-Is and the To-Be processes in either of two ways. We can speak of measures that describe the performance of the process, or we can describe how the As-Is or the To-Be process works. The manager who assigns the project, for example, might simply say that the output of the process needs to be doubled, or he or she might say that defective outputs need to be cut in half. Similarly, the manager might say that competitors have automated similar processes and we need to automate our own process. Depending on the situation the project team usually ends up working back and forth between descriptions of what is and what might be and between measures that define how the process works today and proposed measures that will describe how the process ought to perform once it is “improved.”
We refer to the difference between measures of the performance of the As-Is process and the To-Be process as the performance gap. We refer to descriptions of the difference between how things are done now and how they could or should be performed in the redesigned process as the capabilities gap.
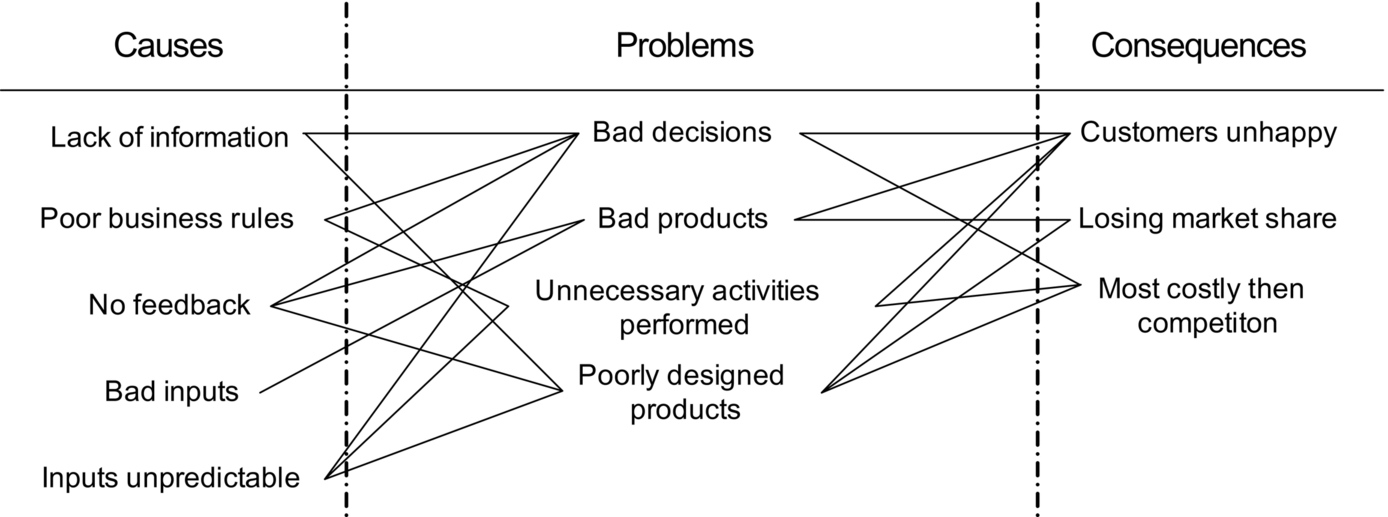
One problem that any project team will encounter is the difference between descriptions of actual problems and descriptions of causes or consequences. Figure 8.7 suggests some of the different types of statements you might encounter. The project team is forced to ask, often several times, “Why do you think this happens?” or “Why is this a problem?” until the team is satisfied that they can clearly define the actual problem. Often measures or statistics cited by management will be measures of consequences and the team will need to work backwards to determine what problem they will need to eliminate to improve the measure or outcome that management is concerned with changing.
If we extend the Gap Model we can see that it also provides a framework for thinking about the kinds of analytic techniques we might want to use to define the problem and can even suggest the redesign techniques we might use to resolve the problem. Figure 8.8 illustrates the relationship between the problem gap and analytic and redesign techniques and illustrates the use of the model with an actual project.
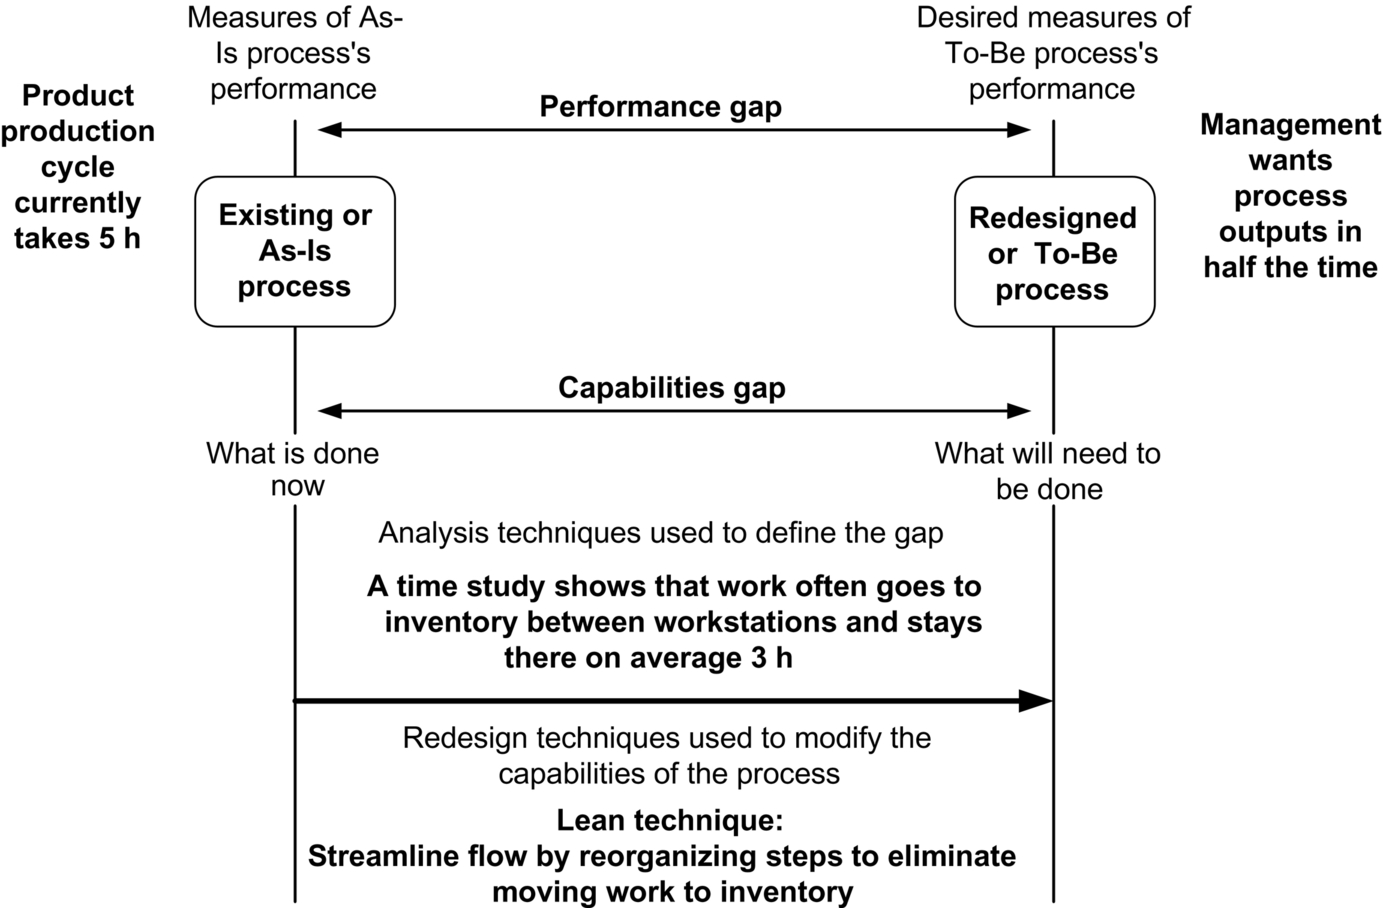
In the example illustrated in Figure 8.8 the manager assigning the project stated that the goal of the project was to produce outputs in half the time currently required. Thus, presumably, the project team gathered data on the time required by the current process and then projected how much time they would have to eliminate to achieve the project goal. Since the essence of the problem involved the time the project takes the team used a time study technique, which involved determining the time each step takes and the time that elapses between each step. They relied on Lean techniques to examine each step to determine what could be eliminated or streamlined. In other words, the nature of the capability gap often suggests the project approach, analysis data to gather, and the process redesign or improvement techniques that will be most useful.
The Initial Cut: What Is the Process?
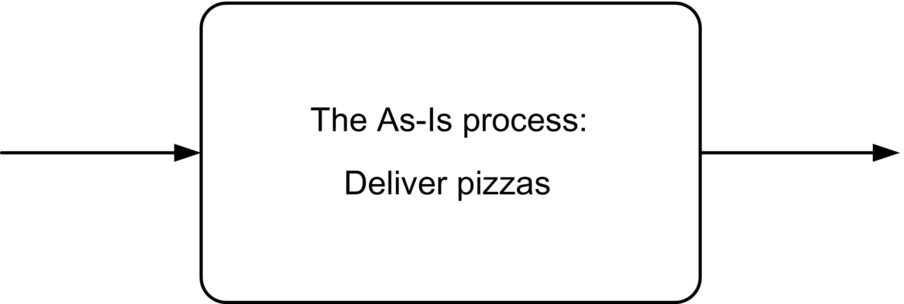
At some point during the scoping process you will need to work up a good overview of the existing or As-Is process. Most teams begin by asking management about the nature of the process. What is it called, for example? Let’s assume for the purposes of our discussion that the management of a pizza company, with several different stores, asks you to help improve their pizza delivery process. From the very beginning you assume that the process being discussed is the pizza delivery process. It is usually best to define a process with a verb-noun phrase, so we mentally turn “pizza delivery” process into “deliver pizzas” (see Figure 8.9).
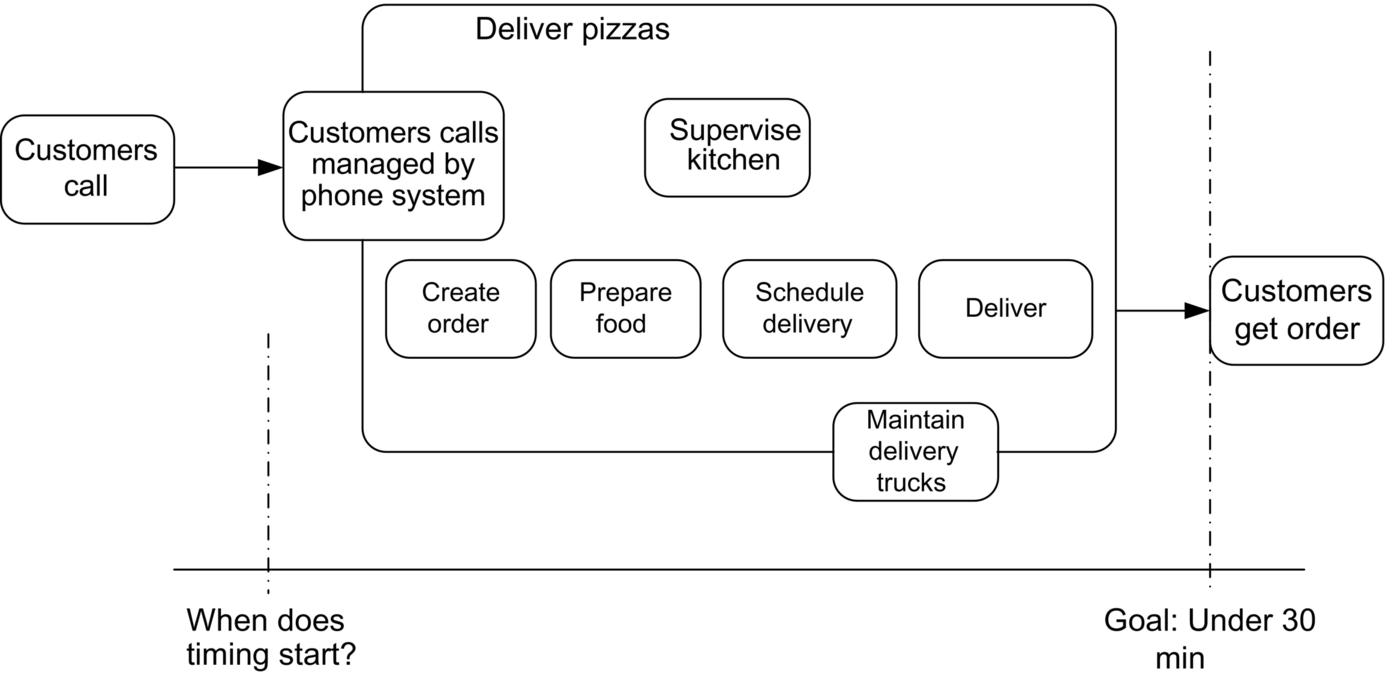
At some point we usually acquire more information. At a minimum we define the inputs that trigger the process and the outputs that signal that the process has successfully concluded. At the same time we usually define the major substeps in the overall process—just as a first cut at saying what is included in the process and what is excluded. Thus in the case of our pizza delivery problem we determine that the process begins when customers call to order pizzas. Their calls are managed by a phone system that takes calls for the entire city and then routes them to the appropriate store. The actual process within a given store begins when they are notified of an order. They proceed to cook the pizza. Meanwhile the delivery manager schedules the delivery, grouping orders so that each delivery run will be as efficient as possible. If business is brisk the area around each store is divided into regions and deliveries are organized according to region so that the delivery trucks travel the minimum distance and the pizzas are delivered warm. When a delivery vehicle becomes available and a set of orders is assembled delivery takes place. Comments made by managers about the availability of delivery trucks lead us to add that activity to our overview, although we are uncertain at this point if it is to be included in our project or not. If some measure, like the time required per delivery, is mentioned we often make a note on our diagram to suggest what we will want to measure. All this results in a very simple diagram that captures the overall process, the major inputs and outputs, and any important subprocesses or measures, as illustrated in Figure 8.10. We are not defining a formal notation or a vocabulary for this type of diagram. The key here is to simply get a rough but useful overview of the elements in the process, as it is currently understood.
As the high-level diagram of the process is developed it is shared with everyone involved in the project, and management is asked: Does this describe the process we are to improve? Should we consider the maintenance of delivery trucks? Should we look at problems with the phone system? Should we consider the food preparation process, or only the delivery scheduling and delivery activities? Our goal at this point is not to get into any detail, but simply to determine what management wants us to study.
Keep in mind that management might not have considered all the implications of their request. They may assume that the problem is in the scheduling of deliveries, and not realize that it is the frequent lack of available vehicles that makes scheduling so inefficient. We start by determining what management thinks the problem is and then we proceed to gather more information to determine if their understanding is probably correct, or if it will make sense for us to suggest changing the scope of the project in some way. Once we have an initial description of the problem we talk with people involved in the process to refine our understanding of the process and to identify likely problems. In all cases we are seeking to refine our understanding of the measures of the As-Is process, of the actual inputs, steps, and outputs of the process, the causes of whatever specific problem that management has asked us to eliminate, and of any other problems that prevent the process from functioning as well as it might.
Stakeholders
As you gather information from senior management about the process to be changed you should also be developing a list of all the stakeholders who have an interest in the process. Stakeholders will include customers, suppliers, managers, employees, and anyone managing a process that interacts with the process you are going to try to change. During the analysis phase of the project you will want to interview all the stakeholders (or at least representatives) to ensure that you understand how they view the process and its problems.
Refining an Initial Process Description
Once you have a basic description of the problem process, represented as either one process that needs to be changed or as a process with four to five subprocesses that need to be improved, you are ready to refine your understanding of the process, the scope of the problem, and the specific nature of the problems you will need to deal with.
Now you are ready to interview a number of different stakeholders, including customers, employees, and day-to-day managers.
At this early stage we often find it useful to create a process scope diagram. Later, once we understand the problem better and as we begin to refine our analysis of the problem, we usually move to a process flow diagram. In essence, a process scope diagram helps you analyze the relationship between a given process and its environment. A process flow diagram, on the other hand, looks primarily at the internal workings of a given process. When you are just starting to try to figure out what might be wrong with a process a scope diagram is much more powerful than a flow diagram.
In this chapter we will consider process scope diagrams in some detail. In the next chapter we will move on to process flow diagrams. The basic ideas behind the process scope diagram originated with the structured software analysis modeling technique, called Integrated Definition (IDEF) language, which was originally developed by the US Air Force and which proved popular with computer-assisted software engineering tool vendors in the late 1980s. Most of the elements in IDEF are too technical to be of interest to business modelers, although elements of other IDEF diagrams are still used by software engineers. The idea of analyzing and scoping a process within a box, however, has been developed and popularized by Roger Burlton and his associates at the Process Renewal Group (PRG) and is quite useful in business analysis.
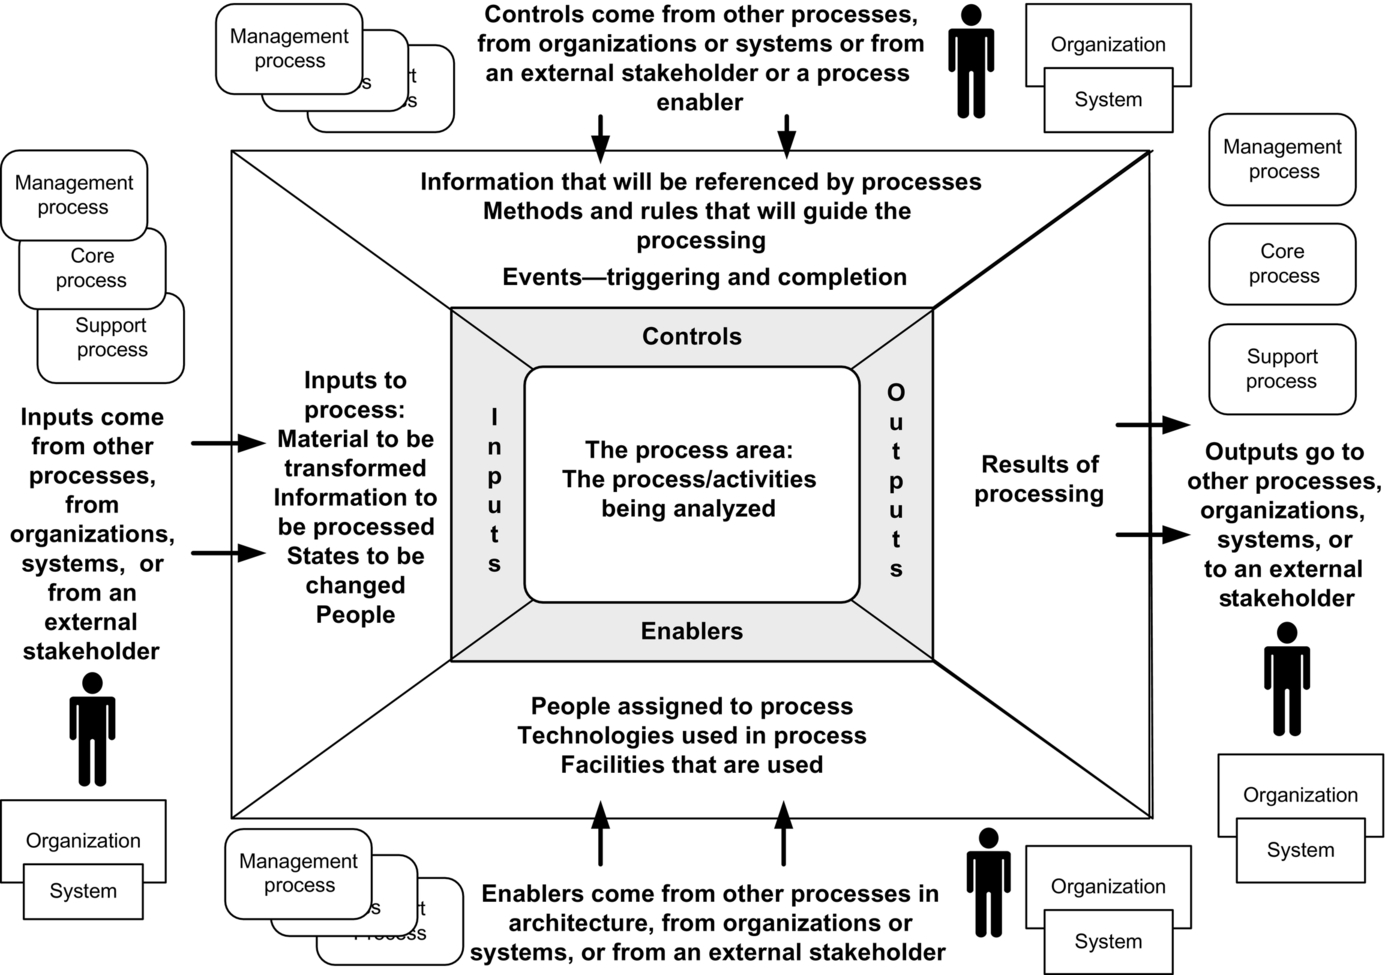
The basic diagram is referred to in the IDEF literature as a function box. Burlton refers to it as an IGOE (inputs, guides, outputs, and enablers) diagram. We’ll refer to it, more generically, as a process scope diagram and develop it somewhat beyond its use by either IDEF or PRG. In essence, we create a diagram, like the one shown in the upper right of Figure 8.11, and then place the process or processes we intend to analyze in the center of the space, which we call the process area. The area to the left of the process area is reserved for information about inputs to the process or processes in the problem area. The area to the right of the process area is reserved for outputs from the process or processes in the problem area. The inputs and outputs can link the process in the process area to individuals, documents, products, systems, organizations, or other processes. To keep things clear we often use little figures for people, rectangles for organizations or systems, and rectangles with rounded corners for processes. The area above the process area is for guides or controls, which can be individuals, organizations, systems, documents, or processes that manage, constrain, or control the activities of the processes in the process area. The area below the process area is where we enter information about the support or enabling processes, systems, individuals or resources that support execution of the process. It sometimes helps to remember that the inputs are consumed by the processes, modified, and turned into outputs. The controls and the enabling “inputs,” on the other hand, are reusable resources that are used over and over again. Figure 8.11 provides a more detailed look at the kinds of issues that we are concerned with when we create a process scope diagram.
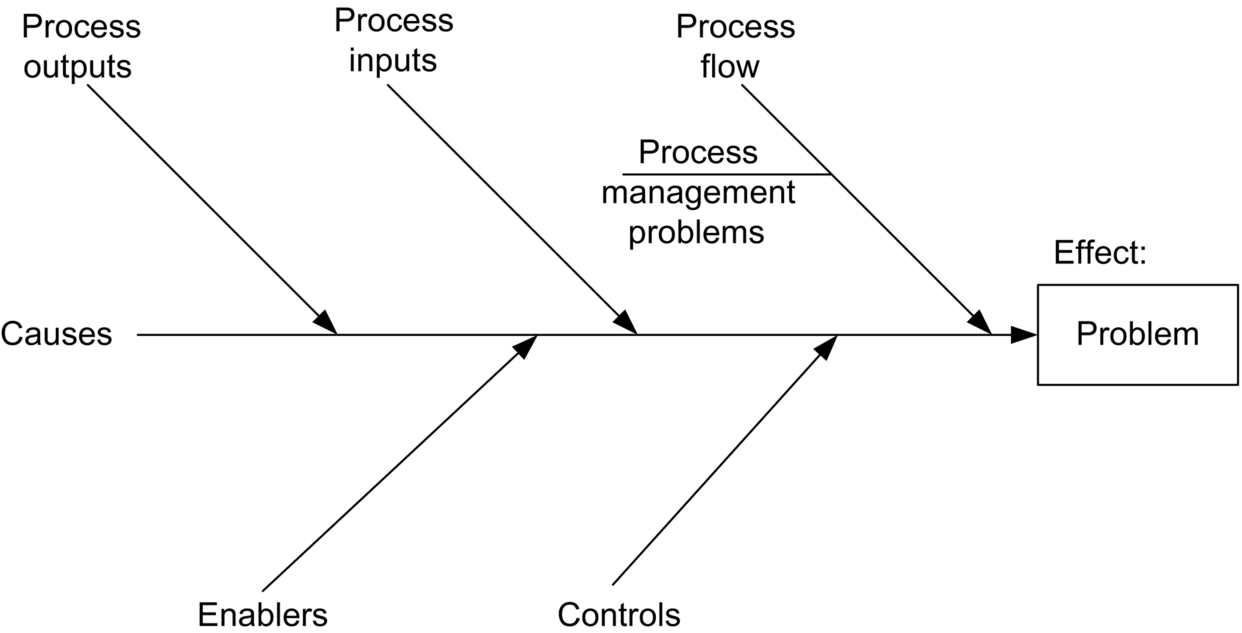
Readers more familiar with cause-effect diagrams (which are also called Ishikawa or fishbone diagrams) might prefer to do their process analysis with one, which can represent the same information (see Figures 8.12 and 8.13). We prefer the process scope diagram partly because it seems to provide more space in which to record information and because it lets us show how we might change the scope of the project. In our experience cause-effect diagrams work better for smaller problems, while larger problems require more space simply because there are more problems and more opportunities to make improvements. Thus we use a process scope diagram to show the overall context of a given process. If we have one problem—say, customers complain about the delivery time—we might do a cause-effect diagram to explore why deliveries are slow.
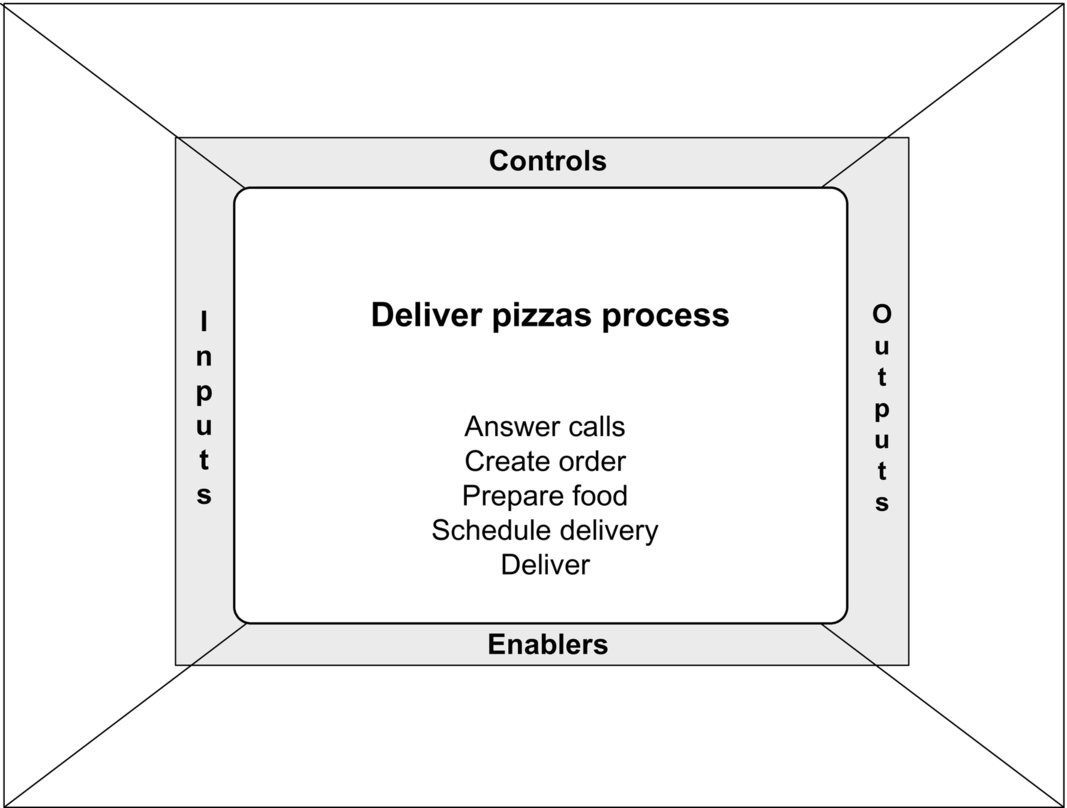
If we were to use a process scope diagram to analyze the deliver pizzas process, we would begin by labeling the center box of the process scope diagram: deliver pizzas. We might also insert a list of some of the subprocesses that we have agreed are definitely included in the deliver pizzas process. Then we would begin to make notes in the process area or in the areas surrounding the process area. These notes would reflect things we found out about the process when we interviewed individuals involved with the process. In essence, the process scope diagram reminds us of the types of problems we might encounter in analyzing any process and provides us with space to make notes about actual problems we encounter. Thus the diagram provides room for information about relationships between the process-in-scope (in the process area), other processes, documents, or individuals, or what flows between them. At the same time, considering these relationships, we are able to focus on four of the six generic types of process problems we typically encounter, including:
- 1. Output problems
- 2. Input problems
- 3. Problems with controls
- 4. Problems with enablers
We will leave the other two generic types of process problems (5. Process flow problems and 6. Day-to-day management problems) until we consider the internals of the process in the next chapter.
Output Problems
Output problems result when the “customer” of the process is not getting what is expected. It is possible the outputs are unrealistic or unnecessary and should be changed, but, as things stand, if the quality, quantity, or timeliness of the outputs of the process-in-scope are not satisfying your customers you have problems. Keep in mind that “customers” can be other processes.
Similarly, there can be other stakeholders who have an interest in the outputs of a process. Thus, for example, local government regulators might be interested in outputs that do not meet local food service laws. Similarly, delivery service employees might be stakeholders if the delivery schedule required them to exceed speed laws to make the required deliveries in the time allowed. Outputs can take different forms, including physical entities, information or data, or decisions/approvals.
- 1.1 Quality of Output
- • Output is rejected by a quality control process downstream (number, ratio of rejects).
- • The downstream process refuses to accept output from the process-in-scope.
- • Output is returned (ratio of returns to output).
- 1.2 Quantity of Output
- • The process does not produce the number of outputs required.
- • The process cannot scale down quickly when a decreased number of outputs are required.
- • The process cannot scale up quickly when an increased number of outputs are required.
- 1.3 Timeliness of Output
- • Some or all of the needed outputs are not produced when required.
In the case of our pizza example the obvious customers are the individuals ordering pizzas.
Input Problems
This type of problem results because the “suppliers” of the process-in-scope are not producing what is needed by the process-in-scope. Suppliers can include companies, individuals, or other processes, and “inputs” can include things, information, money, or even temporary employees. As with output, inputs to the process-in-scope can be deficient in quality, quantity, or timeliness. Similarly, inputs can take different forms, including physical entities, information or data, or decisions/approvals.
- 2.1 Quality of Inputs
- • Inputs are rejected because they do not meet the quality standards of the process-in-scope.
- • Inputs must be returned to an upstream process or supplier (ratio of returns to input).
- 2.2 Quantity of Input
- • The supplier does not produce the number of inputs required.
- • The supplier cannot scale down quickly when a decreased number of inputs are required.
- • The supplier cannot scale up quickly when an increased number of inputs are required.
- 2.3 Timeliness of Inputs
- • Some or all of the needed inputs do not arrive when needed.
- • Inputs arrive in batches and must be stored till needed.
Figure 8.14 shows a process scope diagram for the deliver pizzas process with some basic inputs and outputs.
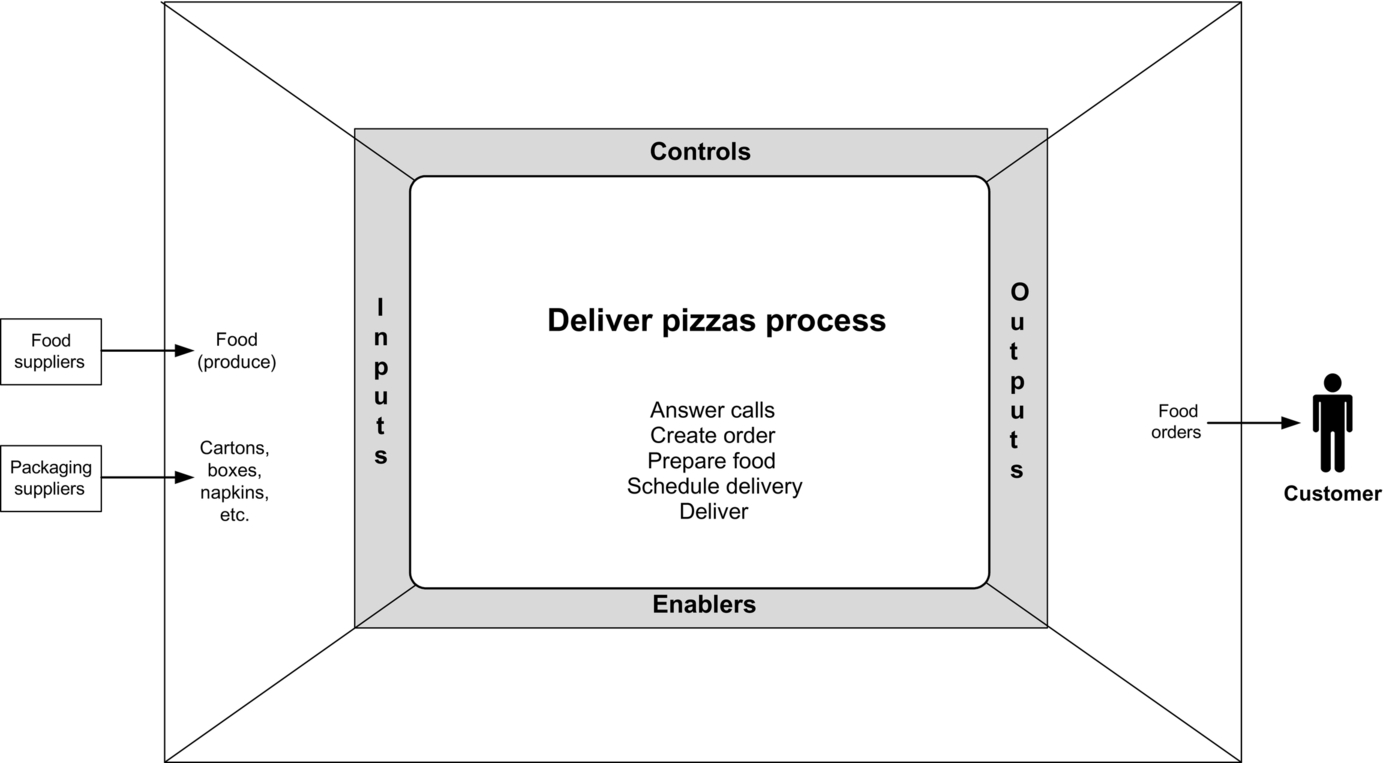
So far we have described only some of the people and processes that generate inputs or accept outputs. Later we will list some of the specific problems that might occur in each section of the diagram.
Problems With Controls
Controls define or constrain how a process is performed. In most cases controls are created by higher level management processes and then released to the managers and employees of the process-in-scope. Thus, for example, a high-level management process generates a company strategy. Then higher level managers define policies and goals that are passed down to the day-to-day managers responsible for specific processes. Broadly, there are four general types of control problems: problems with the goals of the process-in-scope; problems with policies and business rules; problems with documentation, manuals, and other formal sources of control information; and problems with external management processes that either do not support the day-to-day managers or do not supply data, or require outputs that are incompatible with the nature of the process-in-scope.
- 3.1 Process-in-Scope Not Aligned to Organization or Value Chain Strategy
- 3.2 Problems with Policies or Business Rules
- 3.3 Problems with Documentation, Manuals, etc.
- 3.4 Problems with External Management Processes
In the case of our pizza process we know that there are a number of federal, state, and local laws that govern any business and many particular laws that regulate food preparation. All of these laws must be obeyed, and any management policy or business rules that contradict these external laws create an immediate problem. In addition, the company we are considering runs a number of different pizza stores, so we can be sure there are company-wide policies, manuals, and rules that define or constrain what local store managers can do. There are also, undoubtedly, goals set for local managers by the company management, which can generate a variety of problems.
Problems With Enablers
Problems with enabling or support processes arise when those processes fail to provide or maintain the resources needed by the process-in-scope. Support processes and problems can be divided into three or four broad categories. IT problems, HR problems, and facilities, equipment, and location problems are the most obvious. Some would also include problems with the gathering or production of accounting and financial data in this area, but others would consider it a control problem. It does not make too much difference where you consider accounting problems as long as they are handled consistently on your project scoping diagrams.
- 4.1 Employee Problems
- • The process-in-scope is understaffed. HR cannot find or hire enough employees to adequately staff it.
- • The jobs or roles defined for employees assigned to the process do not match the needs/requirements of the process-in-scope.
- • Employees lack the skills needed to perform the work required to accomplish the process-in-scope.
- • The employees have never been told who is responsible for various tasks that are part of the process-in-scope.
- • Employees need training.
- • The training provided is inadequate or offered at the wrong times.
- • Manuals or other documentation do not offer complete or adequate guidance.
- • The rewards or incentives provided for employees do not support the performance required by the process-in-scope. Worse, they actively discourage the correct employee performance. For example, the salespeople get bonuses for selling widgets, but get nothing if they spend time trying to sell the products generated by the process-in-scope.
- • The employees lack the time, space, or tools required for performance of some of the tasks involved in the process-in-scope.
- • The employees working on the process-in-scope are given lagging data, but no leading data that they can use to anticipate work, plans, schedule, etc.
- • The employees believe that some or all the performance required by the process-in-scope is unnecessary, not properly part of their job, or should not be performed for whatever reason.
- 4.2 IT Problems
- • IT applications require inputs or generate outputs that are out of sync with the actual flow and activities of the process-in-scope.
- • Required or generated data are out of sync with the actual flow and activities of the process-in-scope.
- • IT applications or tools require inputs or make outputs that are hard to impossible to interpret, and thus inadequate user interfaces lead to inefficiencies or errors.
- • IT applications or tools support normal processing but do not adequately support exception handling, which is a special problem whenever the number of exceptions spike.
- • Activities are performed manually that could be more efficiently performed by a software application.
- • Data must be input more than once because the software applications being used do not share the relevant data.
- • Data or reports provided to employees are inadequate, incomplete, or out of date.
- 4.3 Facilities, Equipment, and Location Problems
- • Resources or tools required by the process-in-scope are unavailable when they are needed.
- • The facilities are inadequate.
- • The equipment is inadequate.
- • The process-in-scope is geographically distributed and this causes inefficiencies.
- 4.4 Accounting and Bookkeeping Problems
- • Bookkeeping requirements impose heavy burdens on the process-in-scope.
- • Accounting information needed for decisions in the process-in-scope is not available or is not available in the form needed for the decisions.
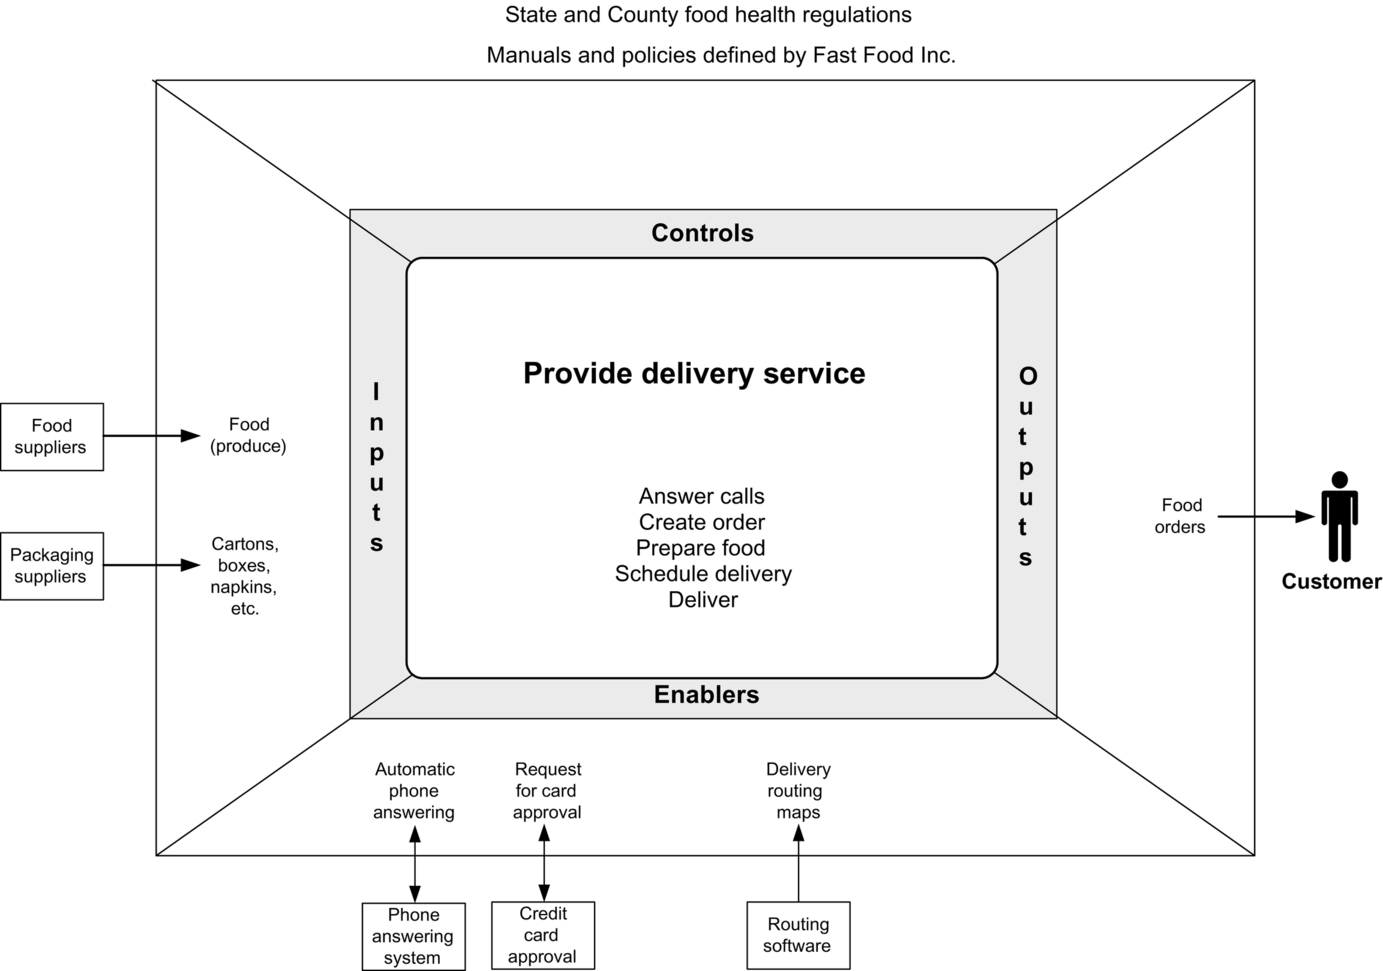
Figure 8.15 illustrates a process scope diagram with some controls and support processes defined.
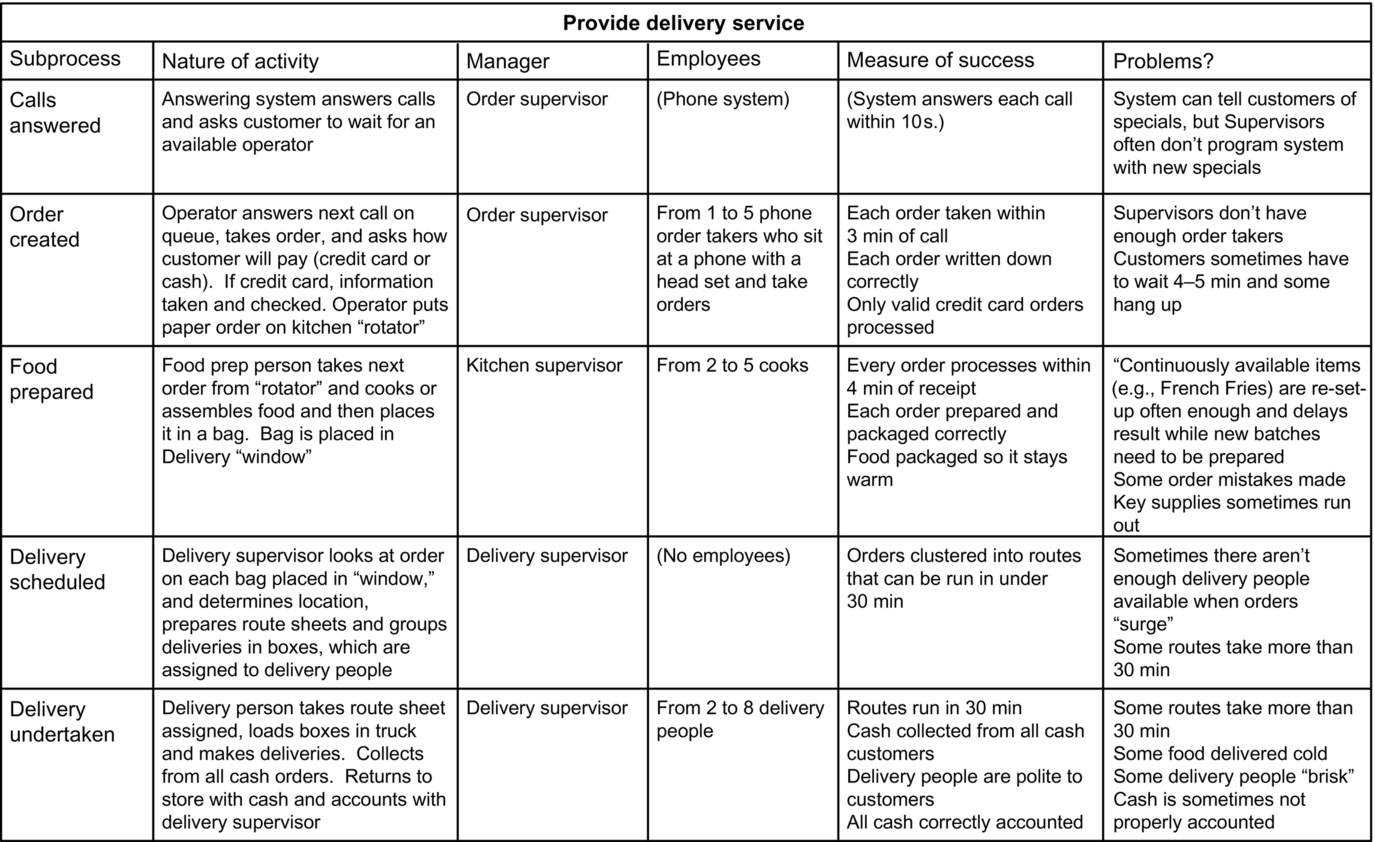
At this point we have described four major types of problems one can encounter and suggested some of the processes and individuals that might be associated with the deliver pizzas process. To further develop the example, in Figure 8.16 we have included a process analysis worksheet we prepared while talking with stakeholders in the deliver pizzas process. The worksheet lists some of the problems that we encountered. Figure 8.17 shows how we transferred the notes from our worksheet to the process scope diagram. We then went on to indicate how critical we thought different problems were. Obviously problem criticality depends on the goals of the project. Something that can be ignored in one project might become the central issue in a different project.
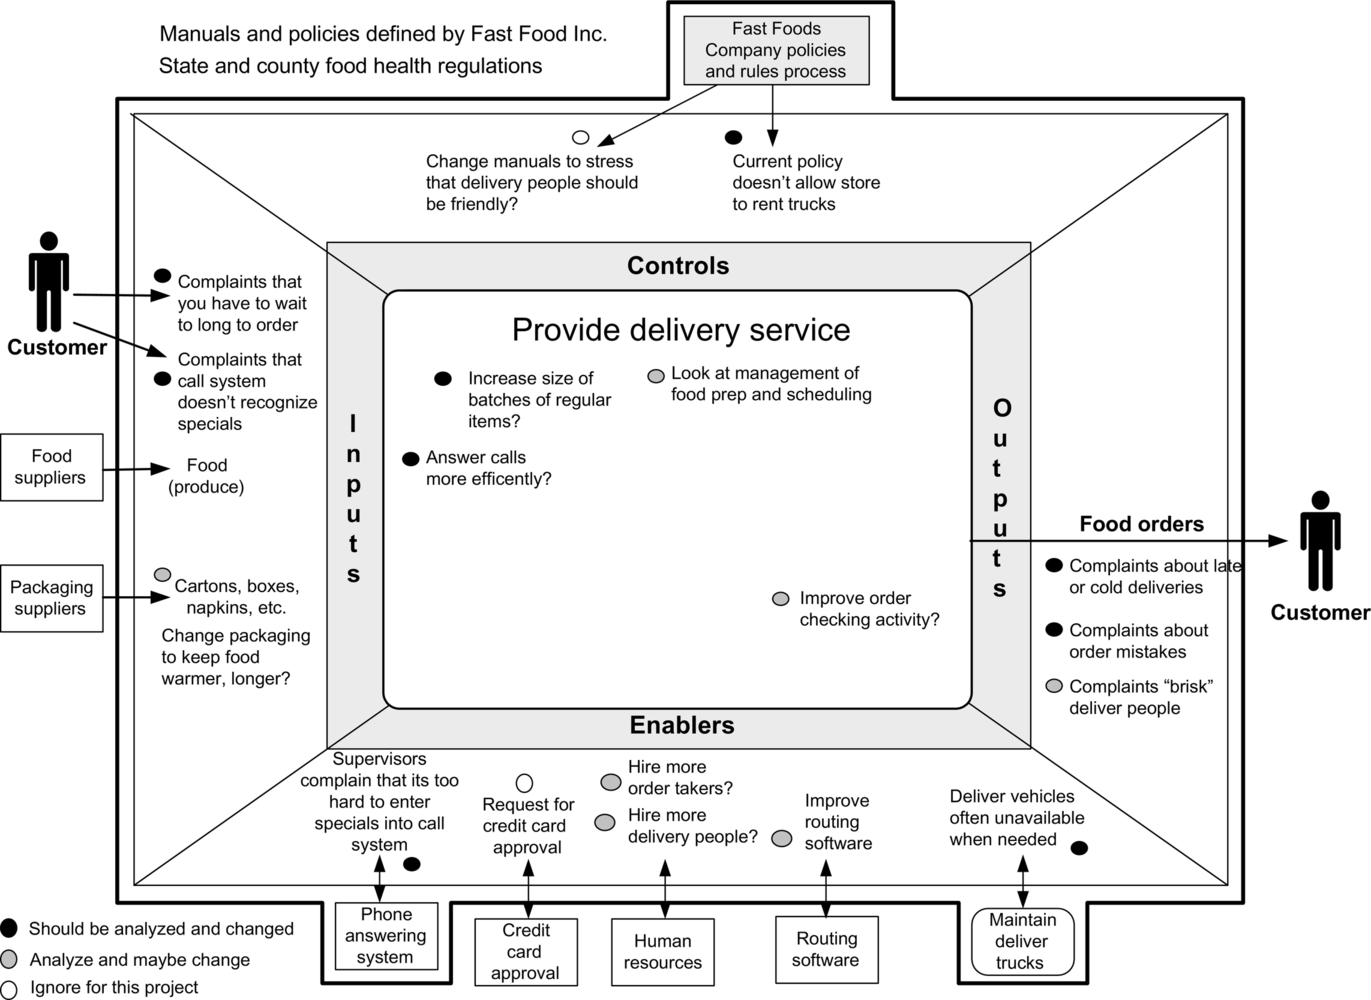
Finally, we added a bold line to the process scope diagram to suggest a revised scope for our project. Keep in mind that the initial scope was the process or processes and their associated day-to-day management processes that we placed in the process area of our initial diagram. In many cases that remains the scope when we finish the process scope diagram, and the diagram simply documents the relationships and the problems with the process-in-scope. In other cases, however, we may decide that a successful project requires that we expand our scope and analyze and redesign processes that lie outside the original scope, and the process scope diagram helps us document and explain why we would like to expand the scope of the project. Obviously an expanded scope will invariably require the consent of the manager who initiated the project and may require asking other managers who are responsible for other processes to become involved in the project. In some cases, for practical or political reasons, the scope of the project cannot be expanded. In those cases, however, it helps if everyone understands at the beginning of the project what limits are being imposed on the scope of the process change we will attempt. In a few cases the inability to expand the scope of a project strongly suggests that the project probably cannot be successfully undertaken and should not be pursued.
Different practitioners use process scope diagrams in slightly different ways. Some practitioners like to simply mention problem areas and then use bullets to suggest if there are problems in that area. Others do as we do here and suggest specific fixes to be considered. Some would list lots of additional processes that might be related to the deliver pizzas process. The important thing about the process scope diagram is its informality. It provides a way to gather and record information about all the possible problems you might encounter without requiring a formal definition about how processes are related or how policies are created or manuals are maintained. It is a very useful diagram when you are first trying to decide what will be included in a project and what kinds of problems you might encounter. In the next chapter we will begin to examine process flow diagrams. They provide a much more precise and detailed way to approach the analysis of processes and activities, but they also require a lot more time to ensure that they are accurate. The process scope diagram is useful precisely because it does not require precision, while simultaneously allowing the project team to capture all the different problems that might impact a project. And they provide a nice way of underlining when the scope of a project will probably need to be enlarged to ensure that the project team can meet the project goals established by management.
Creating a Business Case for a Process Change Project
To wrap up our discussion we consider what is involved in creating a business case for a business process change project. Different companies have different forms or approaches, but the essence of the task reflects the Gap Model that we discussed at the beginning of this chapter and the scoping effort we undertook when we developed the process scope diagram (see Figure 8.18).
One begins with a statement of the problem as defined by management. Next one refines the statement of the problem and describes the performance gap. One discusses measures that describe the current or As-Is process and one considers measures that would define an acceptable redesigned process. Then the business case ought to describe the capability gap, characterizing the current process and suggesting what kind of changes will be required to create a new process that will be able to generate the desired To-Be measures. One goes further and considers how one might study the gap and hints at the redesign techniques that might be used to eliminate performance and capability gaps.
At the end of the first phase of a project one can usually only define the capability gap in a general way and only suggest possible redesign options. Detailed study of the capability gap is the focus of the analysis phase of the project and the definition of possible redesigns is the work of the redesign phase. Even during the understanding phase, however, the project team has an obligation to try to define the likely changes that will be required. In some cases, even at an early point, the team can see where the effort is going to cost a lot more money or take a lot more time than management expects, and they have a responsibility to suggest this possibility. In such cases management might decide after the initial phase of the project that the project should be discontinued, at least for the present.
In a similar way, the business case produced at the end of the initial phase cannot be very precise, but the team should do the best they can to “guesstimate” the possible redesign possibilities and to assign some costs to each to provide management with an initial business case.
The steps in defining a preliminary business case include:
- 1. Define the As-Is process (what is in and out of scope).
- 2. Determine what the As-Is process is or is not doing now (concrete measures).
- 3. Define what the To-Be process should or should not do when it is completed (the goal of the project).
- 4. Consider the means you will use to bridge the capability gap.
- 5. Then consider what bridging the gap will cost in terms of time, cost, and effort.
- 6. Finally, consider the risks and the “politics” and revise if needed.
Here are some guidelines and an outline for a business case proposal:
- • Keep it simple.
- • State clearly: What is the problem?
- • What process do we want to change?
- • Why do we want to change it?
- • Describe measures of the current situation.
- • What is the objective or goal of the project?
- • What would the new process be like?
- • What measures would we expect of the new process?
- • What is involved in creating the new process?
- • Analysis and design
- • Implementation
- • Rollout
- • What resources, time, and cost will be required to solve this problem?
- • What risks or opportunity costs will be required?
- • What results and what return should we expect from this effort?
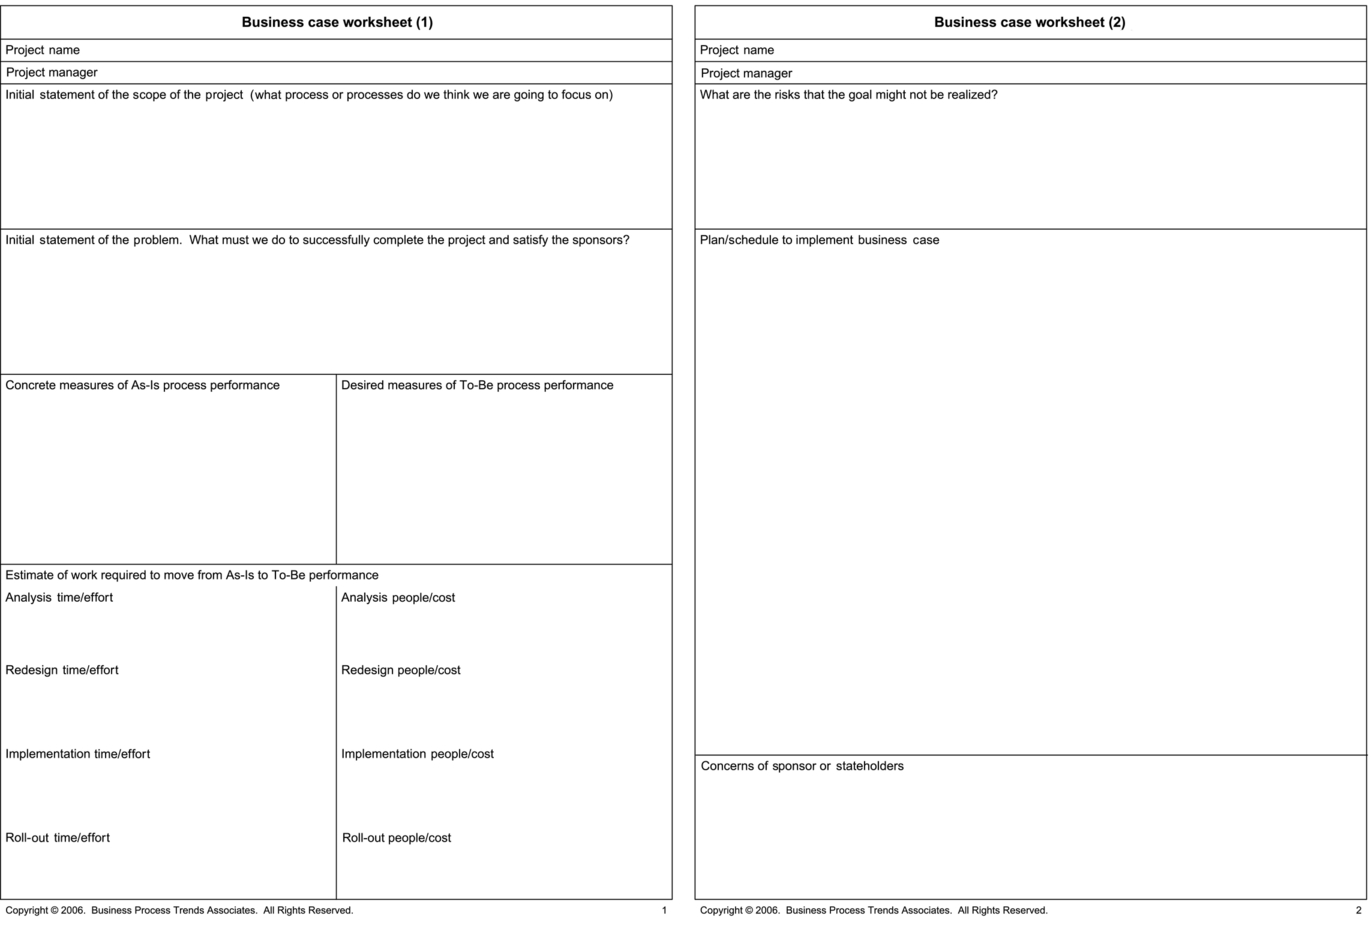
The worksheets pictured in Figure 8.19 provide one way to structure the development of an initial business case. More detailed business cases are developed by following the same outline. When you finish the analysis and design phases, however, you will know much more about the specifics of the process and what it will cost to implement various changes and you will be in a much better position to recommend some changes and not others. At this point, however, you simply want to establish the overall scope and suggest what might be involved, the best case, and the worst case.
Notes and References
In this chapter I have not only drawn on ideas developed in discussions with Roger Burlton, Artie Mahal, and Mary Lowe as we worked on the BPTrends methodology, but also some ideas that were initially developed by PRG, Roger Burlton’s company, before we began to work together on the BPTrends methodology.
Burlton, Roger T., Business Process Management: Profiting from Process, SAMS, 2001. This is the book Roger Burlton published in 2001 that contains many of the ideas used by PRG.
PRG’s IGOE diagram was originally derived from work done in the early 1990s for the US Air Force. The software development methodology developed at that time included a business analysis methodology termed IDEF0. In December 1993 the Computer Systems Laboratory of the National Institute of Standards and Technology released IDEF0 as a standard for Function Modeling in FIPS Publication 183, a Federal Information Processing Standard. Two books that describe IDEF0 are:
Marca, David Α., and Clement L. McGowan, IDEF0/SADT: Business Process and Enterprise Modeling, Electic Solutions, 1988.
Feldmann, Clarence G., The Practical Guide to Business Process Reengineering Using IDEFO, Dorset House Publishing, 1998.