Measuring process performance
Keywords
Aligning measures; Balanced Scorecard; Boeing case study; External measures; Internal measures; Lagging indicators; Leading indicators; Measurement continuum; Measurement terminology; SCOR (Supply Chain Operations Reference) measures
This chapter focuses on organization-wide process performance measurement. Every organization keeps track of its performance in some manner. Some have very elaborate performance measurement systems that allow them to determine what is taking place in real time, while most track a wide variety of measures and review them at the end of each week or month. It is widely held that performance information is a key differentiator and that organizations that can obtain and use information about their markets and their processes in a timely manner can perform better. Thus it is not surprising that companies are investing large amounts of money in developing new and more elaborate performance-monitoring systems.
Historically, there was a rather large disconnect between what executives were concerned with and what operational managers focused on. As a generalization, executives were interested in financial reports and in the performance of the company’s stock. Everyone agrees that these are key performance indicators (KPIs), but problems arise when the organization tries to translate these measures into more concrete measures that can be applied to marketing, manufacturing, or accounting. Operational managers are more focused on the efficiency and effectiveness of specific activities, on the quality of products and services, and on customer satisfaction. Historically, functional units were established because they represented logical ways to divide the work and manage the specialized skills that companies need to accomplish their goals. There is no clear relationship, however, between the departmental units that exist in most companies and the outcomes and measures that most executives track carefully. This is one reason for the shift to divisional and product line managers and for installing process managers who are responsible for entire value chains. When one looks at an entire product line or a complete value chain, one is in a much better position to see how changes in the work result in increased or decreased costs or sales.
Key Measurement Terms
We’ll start with a few definitions of popular measurement terms, and then proceed to a discussion of how processes can be measured.
- • A unit of measure—a phrase that describes the type of data or the outcomes you are interested in (e.g., cash flow, return on equity, sales).
- • A target—specifies what will be considered a success (e.g., cash flow equal to last quarter, or cash flow of $28 million/month).
- • A timeframe—specifies when the measure will be taken (e.g., last quarter, or monthly).
Here are a few more terms:
- • A goal describes an outcome. In effect, it describes a unit of measure (e.g., profitable, technology leadership).
- • A KPI is usually just another name for a goal. Goals are usually associated with strategy, while KPIs are usually associated with managerial performance evaluations.
- • A vision statement describes an outcome and may include a target set in the future (e.g., most profitable in our industry by the end of 2025).
- • An objective (or measure) combines a unit of measure with a target and a timeframe. Thus, unlike a goal or vision statement, which can’t be precisely evaluated, an objective can be evaluated.
- • Data are raw numbers or documented events that can be used to describe results and to determine whether a target is met or not. Good measurement systems describe where, when, and how data are to be captured or gathered. Identifying a target isn’t much use if employees can figure out how to gather data to show that the target is being met.
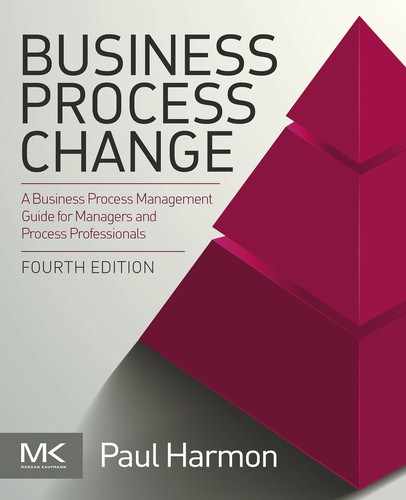
Figure 5.1 pictures a continuum that emphasizes the wide range of these terms from the very specific to statements that are vague and generic.
In our discussions in this book we have indirectly hinted at various ways we could define goals or measures. Organizations have committees of executives that define strategies and goals for their organizations. Process teams interview customers and other stakeholders to determine what they value. In an ideal world the goals that senior management set for the organization should align with the outcomes that customers or other stakeholders value, although in some cases they may not. For example, you could imagine an organization that had decided to exit a specific business, and was gradually withdrawing resources and people to shift them to a newer business initiative. In such a case customers of the older business might be upset with the service being offered, but the organization might find that acceptable as they were more concerned with establishing the new line of business quickly. Similarly, as we indicated earlier, different stakeholders may value different outcomes. Customers may value a great product at a low price. (Many process consultants place a great deal of stress on satisfying customers and suggest building measurement systems from the outside in. We certainly agree that defining and satisfying customers is important—but an organization can be put out of business if it fails to satisfy any of its key stakeholders, so it is probably more important to emphasize satisfying stakeholders than to emphasize satisfying customers, as such.) Banks and shareholders, for example, value a return on their investment, and will stop financing a company if they don’t get it. Government regulators may value timely tax payments or documented conformance with regulations. Management may launch a new initiative to adopt a new technology in the coming year. Employees may value a low-stress work environment, or a high salary and lots of growth opportunities. Suppliers may value a relationship that is predictable and results in prompt and correct payments, and so forth.
Internal and External Measures
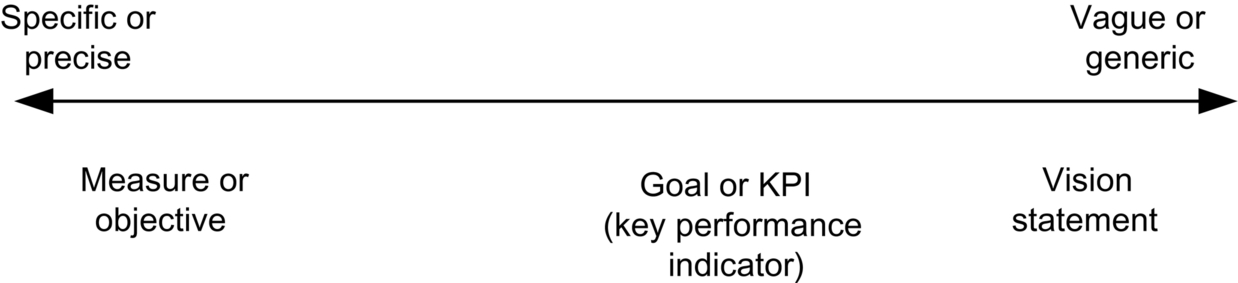
Another way of talking about goals or measures is to ask whether the data are derived from within a given process, or if they are derived from sources external to the process you are focused on. External measures (measures from outside) tell you about the results achieved by a process or value chain. Internal data (measures from inside) tell you about how the process is working, but they don’t tell you if the process is satisfying its stakeholders—be they customers or shareholders. Ultimately, we judge the success or failure of a process by external results. In the case of a value chain those results may be from entities external to the entire organization, as customers are (see Figure 5.2). In the case of smaller processes the external or outside data may derive from a downstream or management process that either values the outputs of the given process or finds them unsatisfactory (see Figure 5.3).

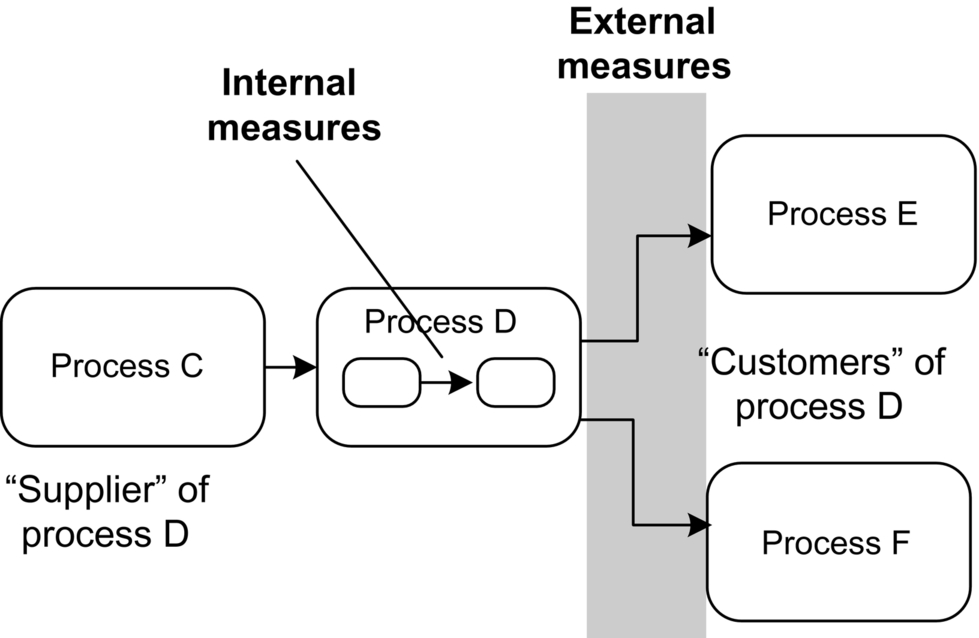
Figure 5.2 provides an overview of the distinction. Note that the emphasis is on the value chain, and not on subprocesses, such as C, D, E, and F. Process C in the value chain shown in Figure 5.2 has an output. We could measure the output of process C separate from any measures we might establish with regard to process C’s internal activities, but that output measure is not an external measure of the value chain.
If we are focused on the organization, then the customer is outside the organization. That said, we can apply this same concept inside an organization, or even a process, if we simply regard any process that receives another process’s outputs as its customer. Thus in Figure 5.3 we see that processes can be both the supplier of one process and the customer of another. In this case process D has two external customers: process E and process F. Before the manager of process D considers examining whatever internal measures are used to evaluate process D, he or she should be sure that process D’s outputs are satisfying its customers: process E and process F. The logic here is the same as it is at the enterprise level. It doesn’t make any sense to decrease the cost or to increase the productivity of process D if, as a result, the process is no longer able to deliver the products or services it provides to process E and process F. Once the external measures are defined and it’s clear that process D can consistently meet its external commitments, then, while keeping its external measures constant, the process manager should focus on improving internal measures.
Using this same logic, support processes usually have core processes as their customers. We evaluate the hire employees process by checking to see if the core processes that received new employees are happy with the results. This is especially important when considering support processes because support process managers often use internal rather than external measures to evaluate their work. Hiring employees quickly and cheaply are important results, but only if we are also sure that the processes that requested new employees are happy with the employees they were given.
External measures are the ultimate measures of whether your company or process is succeeding. Focusing on the company for the moment, examples of external measures we might want to examine include:
- • Income measures
- • Measures of customer satisfaction
- • Market growth measures
- • Stockholder satisfaction or other external measures of the stock market’s confidence in what the company is doing
Examples of internal measures we might want to look at include:
- • Efficiency and effectiveness of specific functions or subprocesses
- • Costs of producing the product or service
- • Quality of internal outputs
It’s usually easier to define or measure internal metrics than to measure external results. Moreover, most functional units tend to focus on internal measures. In fact, as we will see in a moment, one often focuses on internal measures because they are leading indicators and provide managers with valuable information. Ultimately, however, to effectively evaluate the performance of an organization you must focus on the external measures. Once you “lock down” the external measures, then you can begin to focus on improving your internal measures, confident that any efficiency you achieve will result in a real benefit to the organization. If you fail to lock down the external measures first, however, you run the risk that you will improve internal efficiency or reduce production costs at the expense of customer satisfaction, market growth, or the organization’s share price. We know of a company that did exactly that. They announced that bonuses would depend on a 20% cut in costs. Costs dropped and customer complaints soared. Products were delivered late, they had more defects, and service became harder to obtain. The company quickly halted its drive for cost cuts and instituted a program that measured customer satisfaction. Once that program was in place and managers were getting monthly reports on customer satisfaction the company reinstated the cost-cutting drive, making it clear that customer satisfaction came first and cost cuts though desirable came second. However, bonuses would only be given for units that cut costs while maintaining customer satisfaction.
Leading and Lagging Indicators
Another way to think about metrics and measures is to focus on whether they measure something that can suggest action, or whether they simply report on a situation that one can do nothing about. This focus is on using performance measures to help managers make decisions. Leading indicators are measures that report on situations that are causally related to outcomes that you desire. Lagging indicators describe situations that can’t be changed.
Imagine you are a sales manager for Widgets, Inc. The executive board adopts a strategy that calls for the expansion of Widget’s presence in the market. This is translated into a specific goal: the company will increase its sales by 15% each quarter of the year. You can wait till the end of the quarter and then determine how many widgets you sold. That measure, however, is a lagging indicator. Once the quarter is over you won’t be able to do anything about the number of sales you made during the quarter. You’ll know if you achieved your goal or not, but you won’t be in any position to change the results. Now let us assume you have been tracking your widget sales for some time and know that about 10% of your leads normally result in qualified prospects, and that your salespeople can typically arrange calls with half the qualified prospects. You also know that your salespeople, on average, sell widgets to 20% of the customers they call. Figure 5.4 illustrates the widget sales cycle we just described.

If you know that your salespeople are scheduled to make 100 sales calls this quarter, you can predict that you will be making about 20 sales. Thus, sales calls scheduled is a leading indicator of successful sales. It comes rather late in the sales cycle, however, and may not give you much time to make corrections. The best leading indicator in this case would be to track leads. A quick calculation shows that you get one sale for each 100 leads. Or, to look at it a little differently, to increase your sales by 15 in a quarter, you will need to get 1500 more leads. If you track leads per month, you will know at the end of the first month in the quarter if you are on track. If you aren’t you will need to sharply increase the effectiveness of your lead generation process in the second month or you will be unlikely to meet your goal.
As a generalization, whenever possible it is good to monitor leading indicators that provide managers with the ability to take corrective action. Ultimately, of course, you are also going to want to know exactly how many sales you made in the quarter, so you will end up measuring both leads and sales, but the leading indicator will be more useful to the process manager who wants to use the measure to help achieve his or her goals.
Developing a Comprehensive Measurement System
Too many organizations don’t bother to pull all their measures together into a system, and they confuse their managers and employees by seeking different things under different headings. Some have goal systems based on functional units or on customers, but don’t specify the goals and measures for processes. Some executives pursue financial goals without making an effort to specify what success in what processes is necessary to lead to achieving the financial goals.
This mix of potential goals can result in confusion if the organization fails to develop a system that balances and prioritizes its various goals. At the enterprise level a major goal of those concerned with process work is to specify a measurement system that can link strategic goals, stakeholder goals, and internal process goals into one consistent system.
Balanced Scorecard and Process Measures
One of the popular approaches to defining a comprehensive measurement system is the Balanced Scorecard system. The system was popularized by two authors associated with Harvard, but there are many variations of the approach that are used by specific organizations. We discussed Kaplan and Norton’s Balanced Scorecard approach in Chapter 2, when we considered how the Balanced Scorecard could be used to define an organization’s strategy. The approach is even more popular as a tool to define managerial responsibilities and to align the goals and measures used to evaluate the performance of managers.
The basic idea is very straightforward. Kaplan and Norton began by arguing that “what you measure is what you get,” and that “an organization’s measurement system strongly affects the behavior of managers and employees.” They go on to say that “traditional financial accounting measures, like return on investment (ROI) and earnings per share, can give misleading signals for continuous improvement and innovation.” To counter the tendency to rely too heavily on financial accounting measures, Kaplan and Norton argued that senior executives should establish a scorecard that took multiple measures into account. They proposed a balanced scorecard that considered four types of measures:
- • Financial measures: How do we look to shareholders?
- • Internal business measures: What must we excel at?
- • Innovation and learning measures: Can we continue to improve and create value?
- • Customer measures: How do customers see us?
Figure 5.5 illustrates a scorecard of a hypothetical company discussed in Kaplan and Norton’s January–February 1992 article (Note that as we use the term measure or objective the phrases that Kaplan and Norton show on this figure are really just goal statements.)

The initial book on the Balanced Scorecard methodology appeared just as business process reengineering was taking off in the early 1990s. Subsequent articles emphasized important ideas, like linking processes to customer concerns and linking measures to strategies. Many of the early business process theorists emphasized the importance of measurement, but didn’t provide specifics about how to accomplish it. It became popular for business process gurus to mention the Balanced Scorecard when asked to explain how to align strategies, processes, and measures. The Balanced Scorecard approach has grown in popularity and today a large number of companies implement it in either the original way advocated by Kaplan or Norton or in some more tailored manner. Indeed, it has become so popular that many people use the term Balanced Scorecard to refer to any approach to organizing management performance measures, although most stick with the basic principles laid out by Norton and Kaplan.
In their September–October 1993 Harvard Business Review (HBR) article “Putting the Balanced Scorecard to Work,” Kaplan and Norton offered an overview of how one could link the Balanced Scorecard to corporate strategies. Figure 5.6 provides an overview of the approach they proposed. The overall pattern is familiar to anyone who has worked in strategy and measurement. We described it earlier when we introduced measurement. The particular aspect that reflects Kaplan and Norton’s contribution is the emphasis on defining four different types of strategies and generating four different types of measures.
The Balanced Scorecard has proved popular for many reasons. The most important reason was simply that it served as a wake-up call in the mid-1990s. Many senior managers were relying too heavily on financial measures, and a straight-forward model that suggested how they might rely on other measures, including process measures and customer satisfaction, proved popular.
In 2000 Kaplan and Norton wrote a new book and another HBR article “Having Trouble with Your Strategy? Then Map It (Harvard Business Review, September–October 2000). The new article expanded their description of how one aligned measures and strategic goals. They came up with what they termed “Balanced Scorecard strategy maps.” In essence, they introduced a hierarchical model that suggested some measures could contribute to others and could be summed up in shareholder value. Figure 5.7 summarizes the idea behind Balanced Scorecard strategy maps.

One problem we have with Figure 5.7 is that it seems like it’s moving back to where Kaplan and Norton began in the 1990s. We have gone from the idea that senior managers should not rely exclusively on financial measures, but on four balanced sets of measures, to the idea that there is a hierarchy of measures at the top of which are financial measures. It’s easy to imagine that some executives will look at Figure 5.7 and conclude that they can simply monitor financial measures, and leave the rest to lower level managers. In our opinion the basic Balanced Scorecard idea is very useful, but it should be more closely tied to a process view of the organization. From a process perspective, activities are directly linked to customer satisfaction. Breaking them up and arranging them in a hierarchical fashion reflects a functional or departmental mentality. We’ll come back to this point later and suggest how we would deal with the problem. In the meantime it is worth noting that many organizations that have embraced the Balanced Scorecard approach usually did so by conceptualizing the different boxes in the scorecard as being the responsibility of different functional units. Thus, sales and marketing generate the goals and measures for the customer perspective, while operations and manufacturing usually generate the goals and measures for the internal business (or process) perspective. Table 5.1 illustrates some typical functional and process goals.
Table 5.1
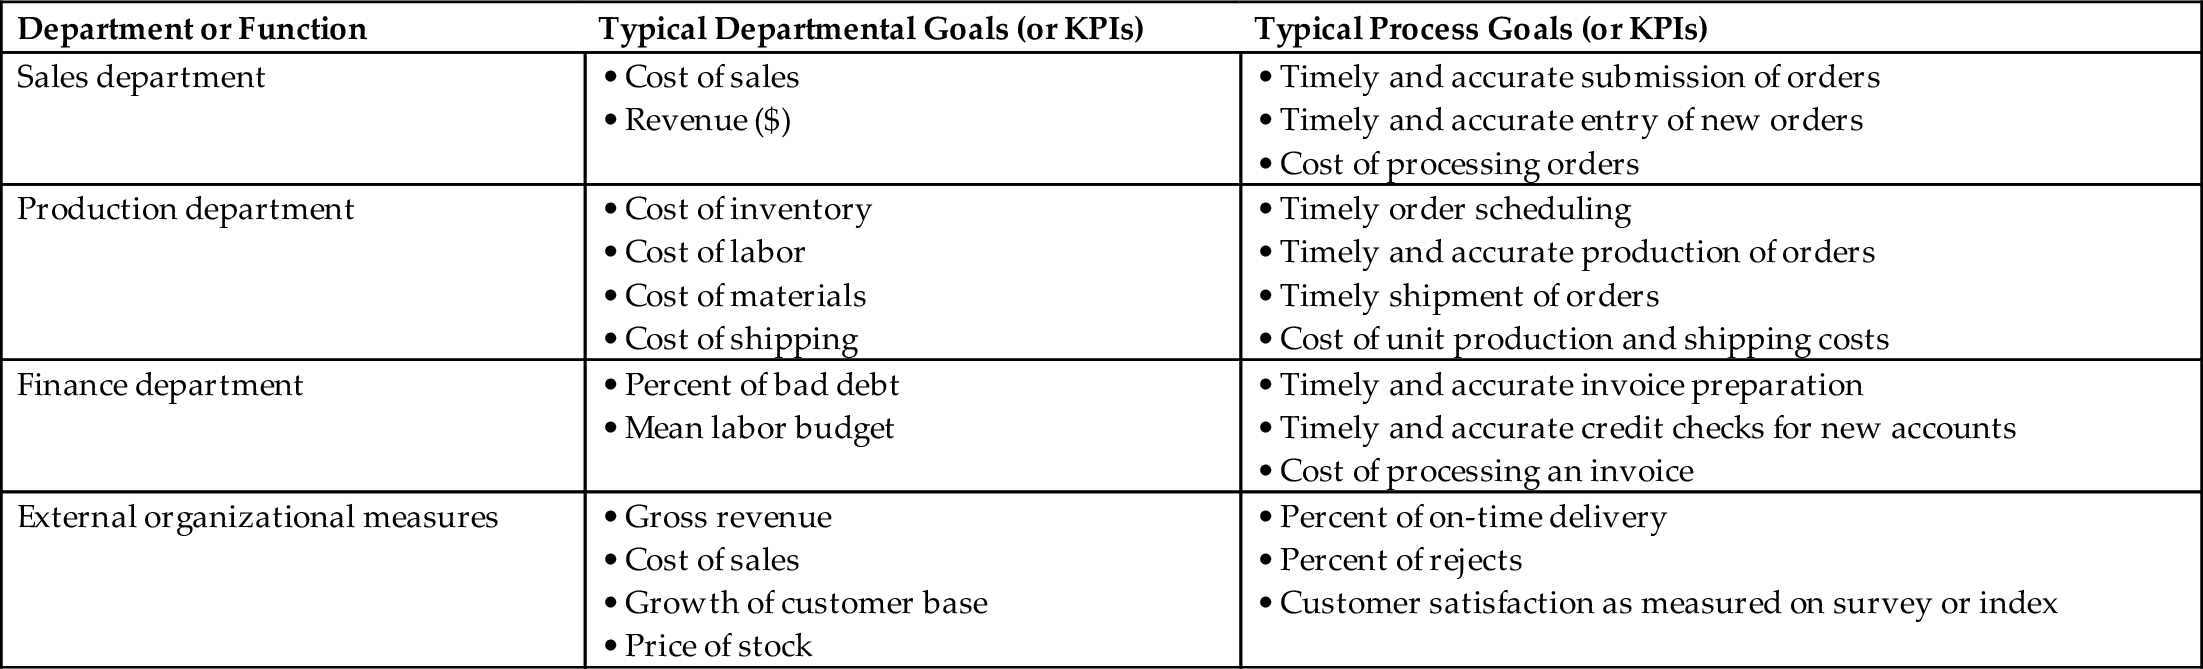
Most organizations that use the Balanced Scorecard work in a top-down manner, first creating a scorecard for the organization and then assigning specific goals to functional managers. Then each department derives its own scorecard that emphasizes the goals and measures the department thinks it can effect. The process is then driven down from the head of the department to his or her reports and then to their reports, as pictured in Figure 5.8. If too much emphasis is placed on functional units, then the card is divided up as it goes down the hierarchy and different quadrants become the primary responsibility of different functional units. Unfortunately, used as it is in most companies, the Balanced Scorecard system tends to support and entrench functional specialization.

Aligning Process Measures
Now let’s consider an entirely different approach to aligning process goals and measures. In this case we are dealing with an organization that is totally committed to process. At a minimum the organization has a division that is focused on producing a specific product line. Or it might be a company that is organized around undertaking projects. The specific example we will look at involves an aerospace company that undertook a project to create and deliver a set number of highly specialized aircraft to the US Air Force. The company was Boeing, and the contract (project) was undertaken by the Boeing Global Mobility Systems (GMS) unit. Specifically, the contract was undertaken to deliver the C-17, a giant aircraft than can transport military tanks, trucks, and heavy equipment. Imagine the project described as a very general process, as illustrated in Figure 5.8. The output of the project is C-17 aircraft. The customer is the US Air Force. The quality and the cycle time for the project are precisely specified. Each plane is carefully evaluated by the Air Force and either accepted or rejected. Thus the ultimate external measure is the acceptance or rejection of C-17 aircraft, coupled with supplying the required number of aircraft on time, as specified in the contract.
Using a diagram like the one shown in Figure 5.8 we can align our process measures by “backing” into the process and writing “contracts” that define the relationships between each of the processes and subprocesses in the value chain. At the highest level Boeing has a contract with its single customer, the US Air Force. Boeing has agreed to deliver a set number of C-17 aircraft for an agreed-upon price within a given time and of a set quality. This external contract is represented by the top gray circle in Figure 5.9.

The value chain is made up of three core processes: 1, 2, and 3. Since core process 3 actually generates the product that is delivered to the Air Force, in effect the contract between the Air Force and core process 3 is exactly the same as Boeing’s overall contract. Now we back up and ask the manager of core process 3 what he or she will need to meet the contract with the Air Force. The manager on core process 3 must consider what’s involved in core process 3 and then negotiate a contract with the manager of core process 2. This is represented by the dark circle between core process 2 and core process 3. In essence, the manager of core process 3 agrees that he or she can meet their contract with the Air Force as long as core process 2 meets its contract with core process 3.
This alignment process can be driven down to any arbitrary level in the process hierarchy. Thus, for example, core process 1 is made up of three subprocesses. The final subprocess in core process 1 must meet the contract that is established between the managers of core process 1 and core process 2. To ensure alignment the manager of subprocess 1.3 must write a contract with the manager of subprocess 1.2 that defines what subprocess 1.3 will need if it in turn is to meet its contract with core process 2. In a similar way this obligation can be passed by other contracts back from subprocess 1.2 to subprocess 1.1. Thus, eventually, an entire value chain and all its processes and subprocesses can be linked by sets of contracts that define what each operational process must do to ensure that the downstream or “customer” process succeeds. We don’t picture it on this diagram, but other contracts can be written by process managers to define what support they require to meet their output agreements.
This is a very process-oriented way of thinking about outcomes and measures. It largely ignores functional concerns and puts all the emphasis on ensuring that each process and subprocess manager knows exactly what is required and generates output (“external”) measures for each process and subprocess. Any process (or process manager) that fails to meet its contract can be instantly identified and corrective action initiated.
Not all organizations can embrace an approach that puts as much emphasis on process as Boeing GMS does. When it is done, however, it makes it possible to create a very rigorous system of measures, all carefully aligned. And, of course, it makes it possible to establish performance criteria for process managers with an equal degree of rigor.
Deriving Measures From Business Process Frameworks
In the last chapter, when we discussed business process frameworks, we mentioned the fact that both the Supply Chain Operations Reference (SCOR) model and the Value Reference Model provide measures for each of their processes. Figure 5.10 provides an overview of the measures used in the SCOR supply chain process. The five high-level SCOR measures are divided between external (customer-facing) and internal measures.

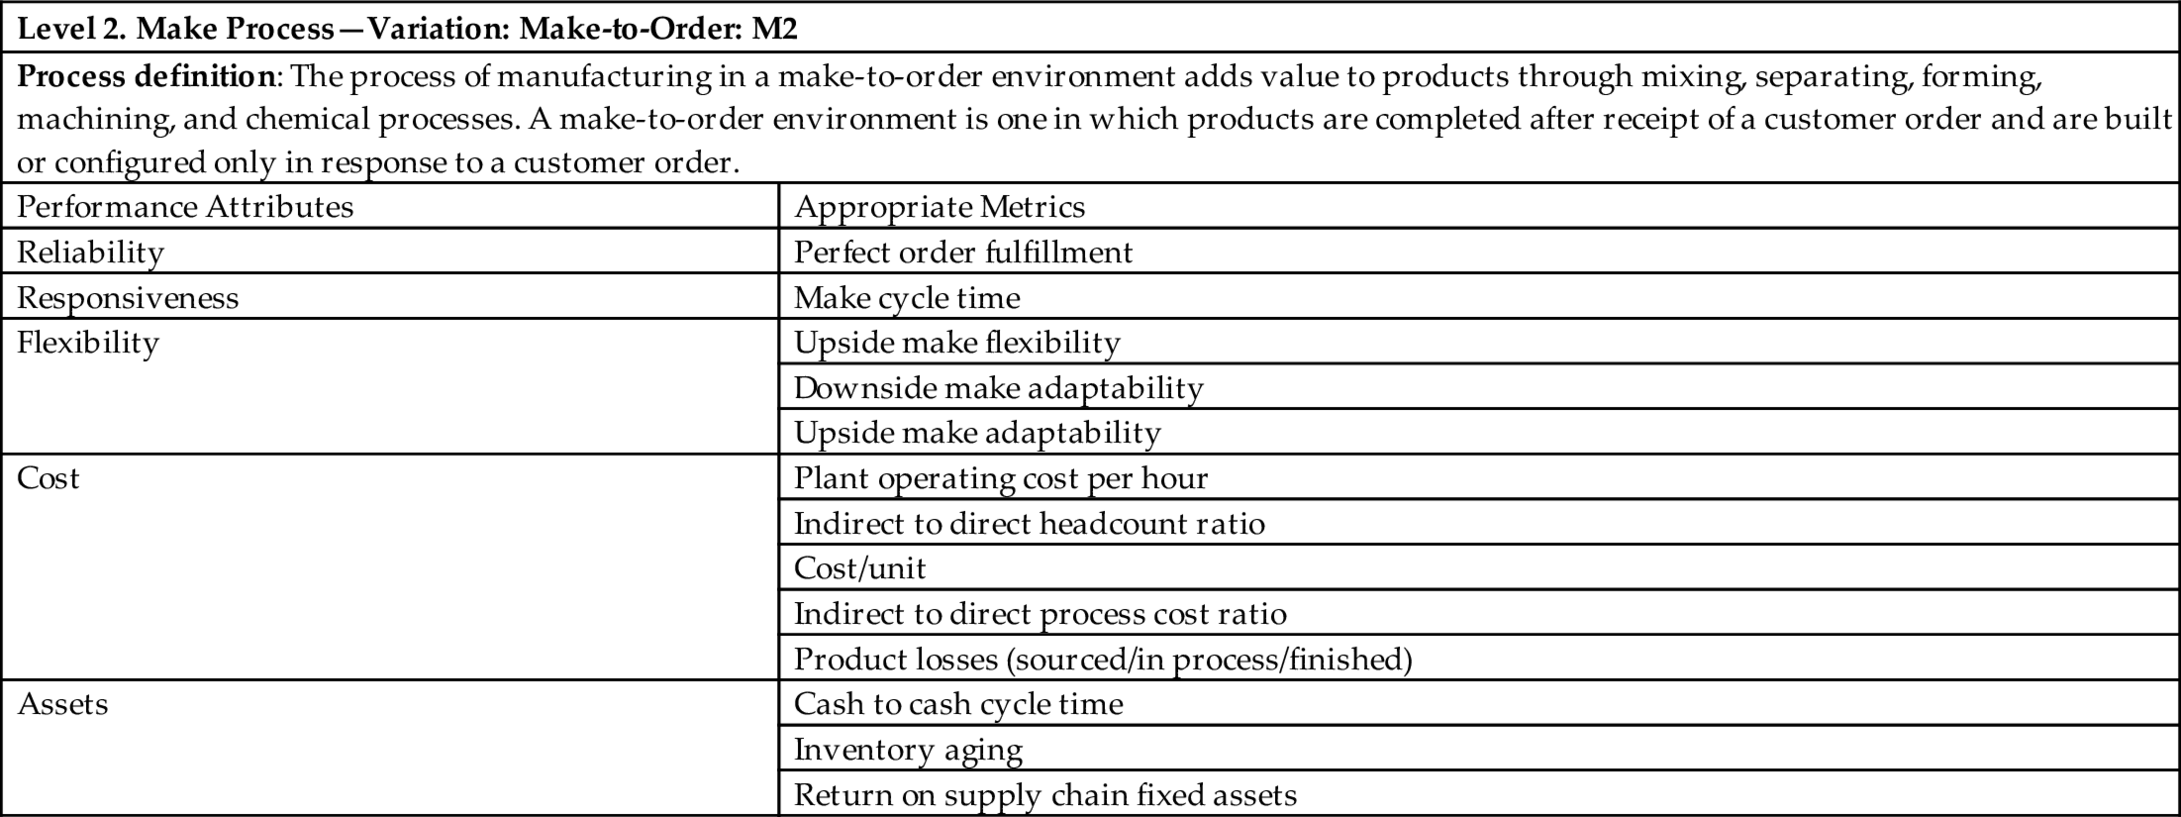
If a company uses a framework like SCOR to structure its business process hierarchy, then it can proceed to derive appropriate measures from SCOR reference materials. The SCOR Reference Manual contains definitions for all processes included in the SCOR framework, the metrics appropriate for evaluating each process at each level, and definitions of how each measure is to be calculated. The following extract from Version 7.0 of the SCOR Reference Manual gives an overview of a sample of the metrics available. In this case we are looking at the reference material provided for a specific Level 2 process—Make (Variation: Make-to-Order)—and then for a Level 3 process within that make process. In the body of the reference manual measures are referred to by name. In an appendix of the manual each measure is precisely defined. We give the measures appropriate to the processes first, and then the definitions of specific measures.
SCOR defines five generic performance attributes and then suggests appropriate metrics for each attribute. Different companies will choose different metrics as KPIs, depending on the nature of the industry, the supply chain, and the performance that the company seeks to monitor and improve.
An example of Level 2 Make (M2) process follows:
| Level 2. Make Process—Variation: Make-to-Order: M2 | |
|---|---|
| Process definition: The process of manufacturing in a make-to-order environment adds value to products through mixing, separating, forming, machining, and chemical processes. A make-to-order environment is one in which products are completed after receipt of a customer order and are built or configured only in response to a customer order. | |
| Performance Attributes | Appropriate Metrics |
| Reliability | Perfect order fulfillment |
| Responsiveness | Make cycle time |
| Flexibility | Upside make flexibility |
| Downside make adaptability | |
| Upside make adaptability | |
| Cost | Plant operating cost per hour |
| Indirect to direct headcount ratio | |
| Cost/unit | |
| Indirect to direct process cost ratio | |
| Product losses (sourced/in process/finished) | |
| Assets | Cash to cash cycle time |
| Inventory aging | |
| Return on supply chain fixed assets | |
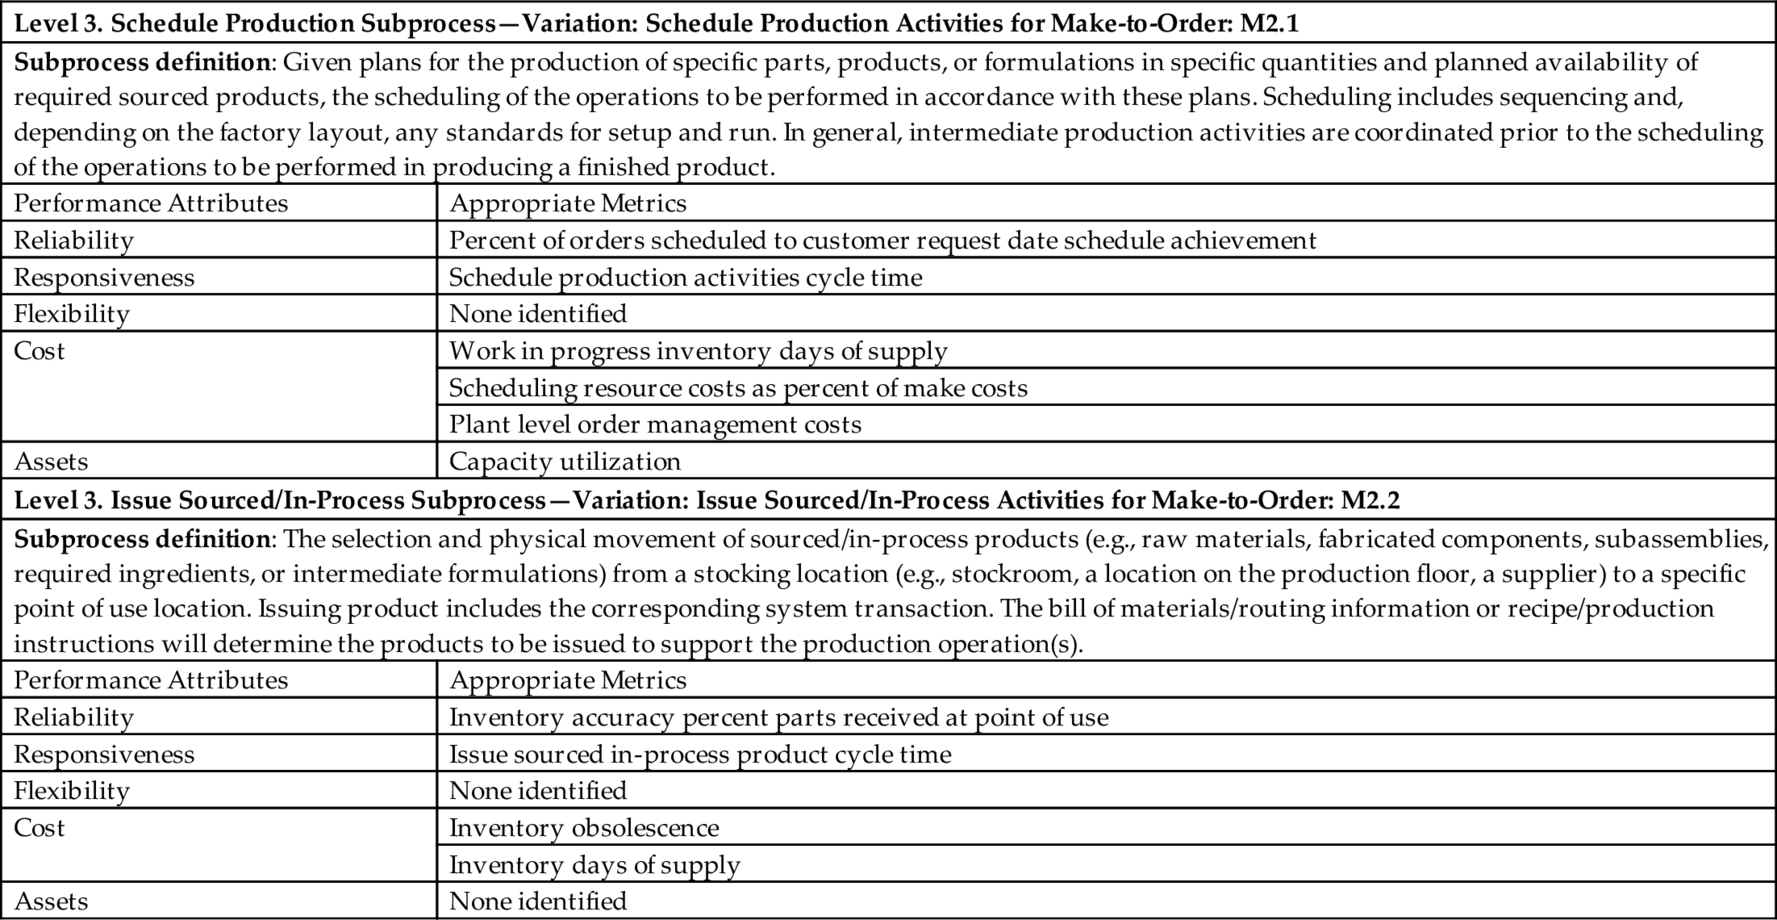
Two examples of Level 3 subprocesses of the Make (M2) process follow:
| Level 3. Schedule Production Subprocess—Variation: Schedule Production Activities for Make-to-Order: M2.1 | |
|---|---|
| Subprocess definition: Given plans for the production of specific parts, products, or formulations in specific quantities and planned availability of required sourced products, the scheduling of the operations to be performed in accordance with these plans. Scheduling includes sequencing and, depending on the factory layout, any standards for setup and run. In general, intermediate production activities are coordinated prior to the scheduling of the operations to be performed in producing a finished product. | |
| Performance Attributes | Appropriate Metrics |
| Reliability | Percent of orders scheduled to customer request date schedule achievement |
| Responsiveness | Schedule production activities cycle time |
| Flexibility | None identified |
| Cost | Work in progress inventory days of supply |
| Scheduling resource costs as percent of make costs | |
| Plant level order management costs | |
| Assets | Capacity utilization |
| Level 3. Issue Sourced/In-Process Subprocess—Variation: Issue Sourced/In-Process Activities for Make-to-Order: M2.2 | |
| Subprocess definition: The selection and physical movement of sourced/in-process products (e.g., raw materials, fabricated components, subassemblies, required ingredients, or intermediate formulations) from a stocking location (e.g., stockroom, a location on the production floor, a supplier) to a specific point of use location. Issuing product includes the corresponding system transaction. The bill of materials/routing information or recipe/production instructions will determine the products to be issued to support the production operation(s). | |
| Performance Attributes | Appropriate Metrics |
| Reliability | Inventory accuracy percent parts received at point of use |
| Responsiveness | Issue sourced in-process product cycle time |
| Flexibility | None identified |
| Cost | Inventory obsolescence |
| Inventory days of supply | |
| Assets | None identified |
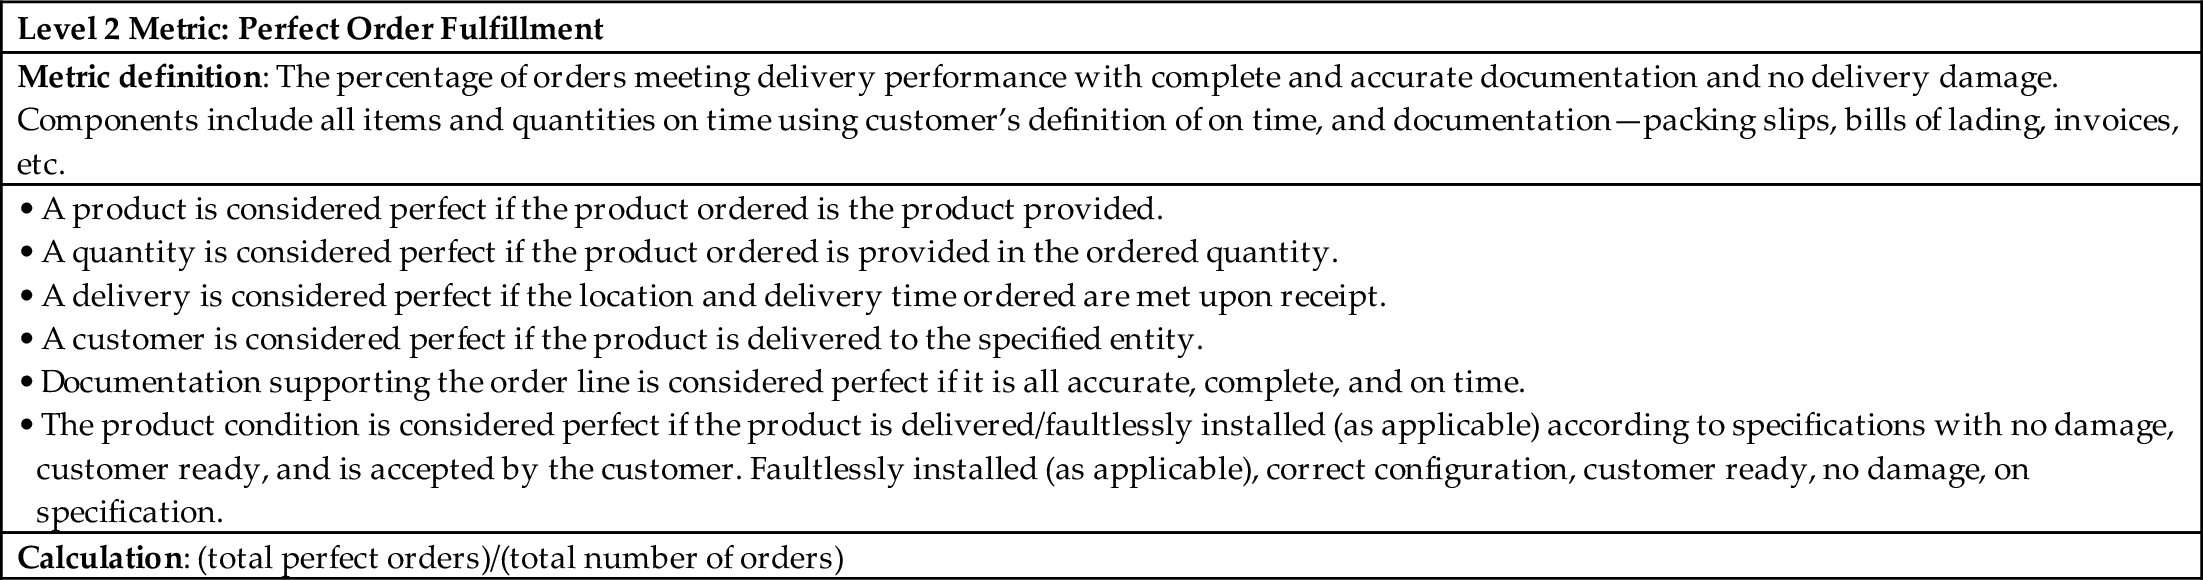
An example of a metric definition for the reliability metric for the Level 2 process is as follows:
The Supply Chain Council (SCC) not only provides a comprehensive set of measures for the processes included in their supply chain, design chain, and sales and marketing frameworks, but they also work with an outside benchmarking agency so that companies using the SCC’s measures can get benchmark information on the same measures. To use the SCC’s framework, measures, and benchmarks an organization needs to join the SCC. Once that is done, however, the company has free access to a comprehensive process measurement system that it can use to rapidly develop its own business process architecture.
A Process-Driven Approach to Defining Measures
We’ll end this chapter by describing how we personally approach the development of a process measurement system. Our approach depends on developing a list of stakeholders for the value chain or the specific process on which we are focused, and then developing a list of measures that describes what would satisfy each stakeholder.
In our experience most process measurement approaches spend too much time talking about architecture, corporate goals, strategies, and initiatives. These are all important issues but, if they are treated as separate concerns, they tend to cause more confusion than provide focus. What’s needed is a simple diagram that allows us to pull together all the information we need in a manner that is clearly focused on the process that we need to redesign. To extend the ideas we are considering here, one simply starts with a value chain and then subdivides it into Level 1 processes, then those into Level 2 processes, and so on.
Whichever level you use as your starting point, you begin by naming the value chain or process to be measured. We’ll keep our example simple and consider a copy center with a single value chain: make copies. This value chain includes everything involved from when the customer requests copies to when the copies are delivered to the customer.
We begin with a rectangle with rounded corners (a standard icon for a process) and label it. Next we add boxes to represent stakeholders, and use arrows to show what the stakeholders expect from the process (see Figure 5.11). As we are using the term, a stakeholder is anyone outside the process, including persons, processes, systems, or institutions that have an interest in the success or failure of the make copies process.
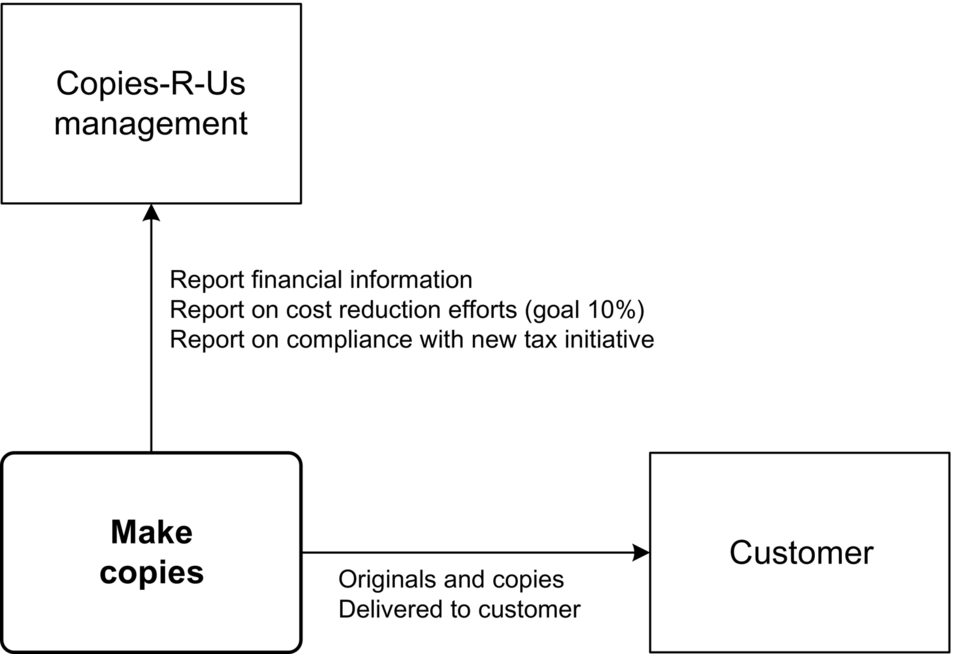
One obvious stakeholder is the customer, who depends on the process to achieve some goal. In the case of the make copies process the customer needs copies and depends on the process to prepare those copies. Another key stakeholder is the management of the copy store. They depend on the process to generate the income that the store was established to generate. We term the diagram created by adding stakeholder boxes to a process box a stakeholder diagram.
The relationship between the customer and the make copies process is easily understood. The customer generates an order, provides money and specifications, receives the copies, and, hopefully, is happy with the result.
The relationship between the make copies process and management is a bit more complicated. Here’s where strategy, goals, and initiatives come into play. Management sets goals for the process and it provides policies and financial resources that constrain the activities of those engaged in the make copies process. Management may mandate changes in the technologies being employed. In a nutshell, all the information that more complex process methodologies might seek by other means can be quickly captured on a simple diagram like the one in Figure 5.8 by simply noting how management constrains and what management expects from the process. Management is a stakeholder with expectations and this diagram should allow the organization to make that information explicit.
If the make copies process was a value chain process that produced the main product of a photocopying store, management would be very concerned with the ROI of the process. If, on the other hand, there was a copying process located several layers down within a value chain designed to produce and sell life insurance policies, management might not care much about the process, simply regarding it as a utility. Similarly, the customer for the photocopy store’s make copies value chain would be the primary customers of the organization, while the customer for the copying process buried within a life insurance sales process might simply be a few other rather modest processes. None of this changes how one develops performance measures for processes, but it reminds us that the interface concerns for management and customer can vary quite a bit, depending on the process we are describing.
Let’s return to our copies example and to management’s concerns. In the case we are looking at, the process is a value chain for a small copy shop. Thus the management of the organization might well have a strategy, and the management team might well adopt a set of initiatives, depending on their goals and the nature of the market. Thus, for example, the management team might have an initiative to reduce costs by 10%. Similarly, they might have an initiative to comply with some new tax regulation that required a new type of report on employee earnings each quarter. In effect, both of these concerns would be incorporated into our diagram as things with which management was concerned.
Let’s consider some other possible stakeholders (Figure 5.12). Common stakeholders include business partners who supply or receive outputs from the process, government agencies that receive reports on income from the process (sometimes stated as independent stakeholders if the process generates the payment, but otherwise added as a management concern), and employees. The copy shop, for example, may use an outside company to clean its premises at night. It may lease equipment from a copy machine manufacturer and expect that manufacturer to provide services and so forth. The copy shop may think its employees are easy to replace and may not place a high premium on retaining them. Although if they are in fact concerned with reducing costs, then retaining employees rather than going to the expense of hiring and training new employees is probably important to the copy store. A software game company that competes for key employees, however, might think about the matter very differently and be very concerned with the happiness of its game designers.

With a little work a business team can usually define a process and then generate a complete list of important interactions. Once this has been done, defining KPIs follows naturally. One knows a process is successful if it satisfies its stakeholders. The list of things that are required to satisfy stakeholders can easily be converted into a set of measures that one can use to evaluate the success of a process. In effect, a list of the stakeholders serves as a scorecard for our process.
There is also some confusion about how one uses terms. Most process people use the term “key performance indicator” to indicate a rather vague goal. In that case they usually associate KPIs with specific “objectives” which they quantify, specifying the item to be measured, the appropriate target, and a time criterion. Thus one of the customer’s KPIs might be “copies delivered when promised.” We could then translate this into the objective “95% of orders ready at the time promised.” Similarly, a management KPI might be to “meet cost reduction goals,” while the objective might be “reduce costs by 10% by the end of the 1st quarter.”
Once the diagram (Figure 5.13) is complete we go on to develop a worksheet. In essence, the team lists each stakeholder, the key concerns of each stakeholder, and then creates formal KPIs and objectives for each stakeholder concern.

One might object at this point that we have only considered “external” measures, and not considered “internal” measures such as how many hours employees worked, or the waste generated by specific subprocesses. If one was really focused on reducing costs, for example, one would probably want to measure several internal measures. Our response is that at this point we are only focused on external measures. External measures tell you what the process is accomplishing. They are the only sound basis for KPIs. At the same time, however, if you want to improve a process, or even manage it effectively, you will probably need a number of internal measures that correlate with the external measures or at least give you a good idea of the likelihood of achieving the external measures. Deriving internal measures from external measures is a separate process that depends on an analysis of the internal structure of the process, and which won’t be discussed here for lack of time and space. Our goal here has been to assure that we have a complete set of external measures to use in monitoring the performance of a given process.
The development of a stakeholder diagram assures that the process team has a clear set of goals for a process. Moreover, done as we have suggested with an equal emphasis on customers, management, and other key stakeholders, it generates a complete list of measures for a process. It also provides the foundation for the derivation of more precise internal measures that are used when one tries to improve a process.
As we indicated earlier, many methodologies use a variety of diagrams and worksheets to define an organization’s goals and initiatives. Others get lost in discussions of process outcomes for customers and how they square with management concerns for things like ROI or staying within budget. The stakeholder diagram captures all this in a single diagram and an accompanying scorecard.
Putting It All Together
As we suggested at the beginning of this chapter, most companies are still experimenting with process management and with the specification of process-based performance measures. Most companies tend to have measures defined at the lower process levels, but they don’t have performance measures at the value chain level. Moreover, they rarely have their measures tightly integrated with their strategic goals. Companies that have done work in this area tend to do it within the scope of the Balanced Scorecard framework, but this approach while useful often obscures the role of processes and overemphasizes the functional approach.
A few companies, like Boeing GMS, are far ahead of others and have a rigorous process measurement system that runs from the top right down to the smallest process in the organization. Using contracts the Boeing GMS system lines everything up and makes rigorous traceability possible.
A few companies have begun to explore the use of scorecards derived from various specialized process frameworks like SCOR.
Figure 5.14 also suggests how we can get around the layered nature of the Balanced Scorecard strategy model. Instead of thinking of customers as forming a layer, we think of them as stakeholders of the process whose measures we wish to define. Once we add other stakeholders, such as management, business partners, and perhaps some support processes, and go on to define what each stakeholder expects from the process, we have a process scorecard that is very in keeping with either creating an organization-wide measurement system, or as a way to begin to define how we might monitor the success of a given process and analyze what we expect from a process.

Notes and References
Once again, many of the ideas incorporated in the BPTrends methodology are derived from conversations Roger Burlton and I have had. And most of my ideas on the relationship between process managers and processes derive from even earlier conversations with Geary Rummler.
Rummler, Geary, and Alan Brache, Improving Performance: How to Manage the White Space on the Organization Chart (2nd ed.), Jossey-Bass, 1995. Still the best introduction to measuring business processes.
Spitzer, Dean R., Transforming Performance Measurement: Rethinking the Way We Measure and Drive Organizational Success, AMACOM, 2007. A very nice introduction to the latest ideas on organizing performance measurement.
Lynch, Richard L., and Kelvin F. Cross, Measure Up! Yardsticks for Continuous Improvement, Blackwell, 1991. An older book with lots of good ideas on process measurement.
The Balanced Scorecard is a popular approach to measuring corporate and managerial performance. The term was coined by Robert S. Kaplan (a Harvard Business School accounting professor) and David P. Norton (a consultant) in an article titled “The Balanced Scorecard—Measures that Drive Performance,” which appeared in the January–February 1992 issue of the Harvard Business Review.
Kaplan, Robert S., and David P. Norton, The Balanced Scorecard: Translating Strategy into Action, Harvard Business School Press, 1996. Kaplan and Norton describe a popular approach to tying measures to organization strategies. It’s good in that it gets executives thinking of a variety of measures. It’s bad if it’s used alone as a measurement solution and not incorporated into a total business process management strategy. You can easily think of the collection of measures that accumulate as being a process that analyzes a scorecard of measures.
Kaplan, Robert S., and David P. Norton, “Having Trouble with Your Strategy? Then Map It,” Harvard Business Review, September–October 2000. This article describes how the authors link strategy to Balanced Scorecard measures. It is available at http://www.amazon.com.
Kaplan, Robert S., and David P. Norton, Strategy Maps: Converting Intangible Assets into Tangible Outcomes, Harvard Business School Press, 2004. The Kaplan-Norton model often confuses the relationship between processes and measures, but it also provides lots of good insights. Read it for insights, but don’t take their specific approach too seriously, or your process focus will tend to get lost. Kaplan and Norton’s previous book on the Balanced Scorecard approach to strategy was The Strategy Focused Organization which was published by Harvard Business School Press in 2001 and it too is also worth a read.
Kaplan and Norton’s books are still available and are as good as any of the many other books on the Balanced Scorecard we have seen. If you just want the basic idea, however, we suggest you buy the original Harvard Business Review article that is available at http://www.amazon.com.
Smith, Ralph, Business Process Management and the Balanced Scorecard, Wiley, 2007. This is a recent book that describes the challenges of using the Balanced Scorecard with business process management.
Most of the material on aligning processes from the top down derives from the work at Boeing GMS (formerly called Boeing A&T). The best article describing this effort is Pamela Garretson’s “How Boeing A&T Manages Business Processes,” which is available at http://www.bptrends.com (search for Pam Garretson).
Information on the SCC’s measurement systems is from a number of SCC publications. The specific information about make-to-order process measures is from the SCOR Reference Manual. All SCC information is available at http://www.supply-chain.org.