
8. Sharing Your Project with Others
This chapter includes information on reporting, sharing project details, and collaborating on a project using Project 2010.
Projects rarely are created and managed by one person in a small room with no outside influence. Project managers have supervisors that they need to report to about project status, other interested parties who want access to project data, and other project managers who may have some insight into ways to improve project plans. Project 2010 enables reporting, other sharing methods, and a collaboration system to support coordinating project management work with outside demands for project information.
Show Me: Media 8.1—Sharing Your Project

Access this video file through your registered Web Edition at my.safaribooksonline.com/9780132182461/media.
Reporting on Your Project
Project 2010 includes two types of reports:
• Visual reports— When you generate a visual report, your project data is exported to Excel or Visio, for a highly illustrated report that takes advantage of PivotTable and PivotChart features.
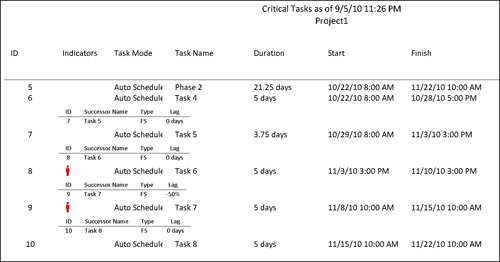
• Basic reports— When you generate a basic report, your project data is formatted into a simple, printable report within Project 2010.
Figure 8.1 shows an example of a report generated using visual reports and Figure 8.2 shows a similar one generated using basic reports.
Figure 8.1. The Critical Tasks Status Report, a visual report that uses Visio
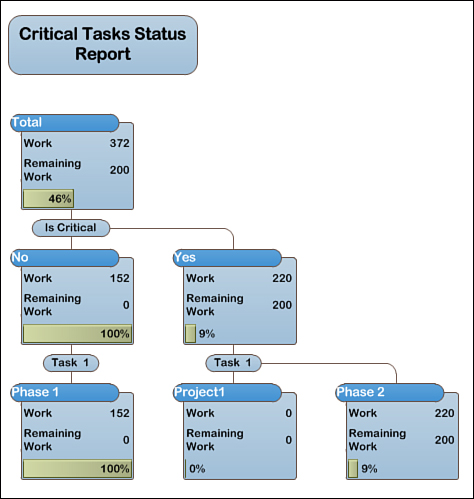
Figure 8.2. The Critical Tasks basic report
With both visual and basic reports, not only can you generate them using your project data, but you can also customize your own reports to show the data you need, in the way that makes the most sense for your organization. The process for generating and customizing reports is different based on which kind of report you are using.
Generating and Customizing a Visual Report
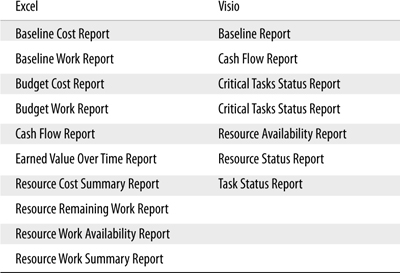
Project 2010 comes with the visual report templates shown in Table 8.1.
Table 8.1. Available Visual Reports
Follow these steps to generate one of these visual reports:
- On the Project tab, in the Reports group, click Visual Reports.
- Click the name of the report you want to generate.
- To choose the amount of usage detail you want to include in the report, select an option from the Select level of usage data to include in the report list.
- Click View to begin generating the report. Based on your selection, the report will open in Excel or Visio, and you can modify what data is displayed by using the PivotTable or PivotChart features within those applications.
If the default visual report templates included with Project 2010 don’t include the right data to meet your needs, you can add or remove which fields are included in the report.
To add or remove fields from an existing visual report template, follow these steps:
- On the Project tab, in the Reports group, click Visual Reports.
- Click the name of the report you want to modify and then click Edit Template. The Visual Reports—Field Picker dialog box appears, as shown in Figure 8.3.
Figure 8.3. Use the Visual Reports—Field Picker dialog box to choose fields to include in the selected report.
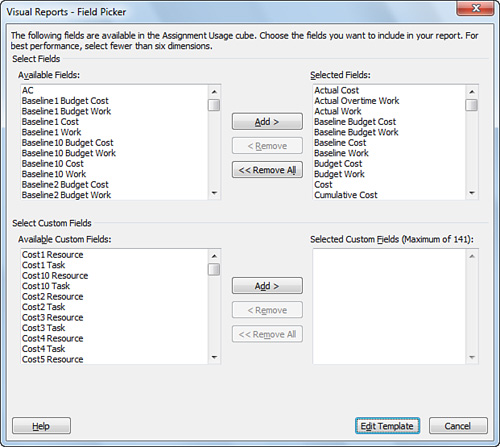
- To add a built-in Project field to the report, under Select Fields, click the name of the field in the Available Fields box and then click Add to move it to the Selected Fields box.
- To remove a built-in Project field from the report, under Select Fields, click the name of the field in the Selected Fields box and then click Remove to move it to the Available Fields box.
- To add a custom field to the report, under Select Custom Fields, click the name of the field in the Available Custom Fields box and then click Add to move it to the Selected Custom Fields box.
- To remove a custom field from the report, under Select Custom Fields, click the name of the field in the Selected Custom Fields box, and then click Remove to move it to the Available Custom Fields box.
- Click Edit Template, and the template opens in Excel or Visio. Use the features in the application to surface the data you added or to rearrange the report to account for the data you removed.
If the existing reports don’t come anywhere near meeting your needs, you can create your own report by choosing what format you want to use and what data you want to export.
To create a new visual report template, follow these steps:
- On the Project tab, in the Reports group, click Visual Reports.
- Click New Template.
- Under Select Application, choose whether you want to create the report in Excel or Visio.
- Under Select Data Type, choose a category of usage or summary data that includes the information you want in your report.
- Under Select Fields, click Field Picker.
- To add a built-in Project field to the report, under Select Fields, click the name of the field in the Available Fields box, and then click Add to move it to the Selected Fields box.
- To remove a built-in Project field from the report, under Select Fields, click the name of the field in the Selected Fields box, and then click Remove to move it to the Available Fields box.
- To add a custom field to the report, under Select Custom Fields, click the name of the field in the Available Custom Fields box, and then click Add to move it to the Selected Custom Fields box.
- To remove a custom field from the report, under Select Custom Fields, click the name of the field in the Selected Custom Fields box, and then click Remove to move it to the Available Custom Fields box.
- Click OK on the Visual Reports—Field Picker dialog box to add the selected fields to the report.
- Click OK on the Visual Reports—New Template dialog box to export the data to Excel or Visio and begin designing the visual layout of your report. Use the PivotTable and PivotChart features in those applications to choose how you want to present your project data.
Generating and Customizing a Basic Report
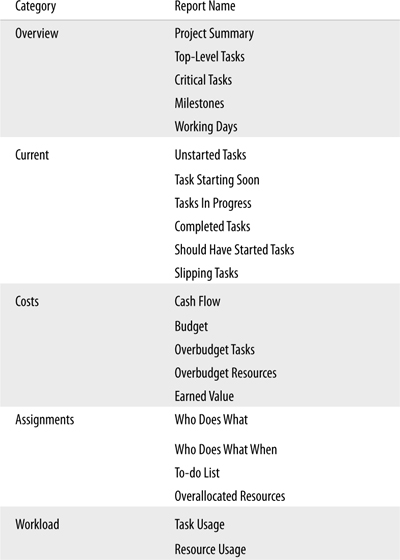
Table 8.2 shows the basic reports included in Project 2010.
Table 8.2. Available Basic Reports
Follow these steps to generate and print one of these basic reports:
- On the Project tab, in the Reports group, click Reports.
- Click the category that contains the report you want to generate and then click Select.
- Click the name of the report you want to generate and then click Select.
- Click Print to print the selected report.
If the basic reports included with Project 2010 don’t contain the information you need and you don’t have the option (or don’t want) to use visual reports, you can create your own basic report. The steps for creating a custom basic report are different, depending on what kind of report you are creating.
 LET ME TRY IT
To create a custom basic task or resource report, follow these steps:
- On the Project tab, in the Reports group, click Reports.
- Click Custom and then click Select.
- On the Custom Reports dialog box, click New.
- Click Task or Resource in the Report type box and then click OK.
- On the Definition tab, complete the following:
• Name— Type the name of the report you are creating.
• Period— Choose the time period you want to display in the report.
• Count— Type the number of time periods you want to include in the report. For example, if you chose Weeks from the Period list, and you type 2 in the Count box, the report will display two weeks’ worth of data.
• Table— Choose which table type you want to display in the report.
• Filter— Choose how you want to filter the task or resource data.
• Highlight— Select this check box if you want to highlight the filtered tasks in the report.
• Show summary tasks— Select this check box to include summary tasks in your report.
• Gray bands— Select this check box to include gray lines to divide data visually in your report.
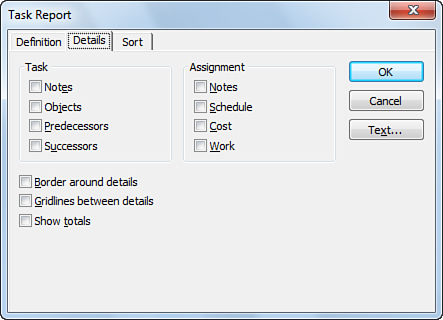
- On the Details tab (shown in Figure 8.4), choose the check boxes for the data you want to include in your report and select or clear the Border around details, Gridlines between details, and Show totals check boxes to adjust the formatting for your report.
Figure 8.4. The Details tab of the Task Report dialog box has data and formatting options.
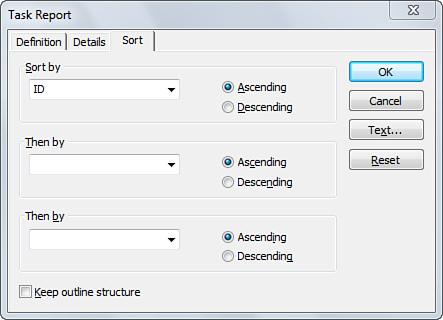
- On the Sort tab (shown in Figure 8.5), use the Sort by and Then by lists with the Ascending or Descending option to choose the order in which data in your report should be listed.
Figure 8.5. The Sort tab of the Task Report dialog box has options for ordering data.
- Click OK to finish creating your custom report.
Follow these steps to create a custom basic monthly calendar report:
- On the Project tab, in the Reports group, click Reports.
- Click Custom and then click Select.
- On the Custom Reports dialog box, click New.
- Click Monthly Calendar in the Report type box and then click OK.
- Type a name for the new report in the Name box.
- Click Filter and choose what data you want to appear in the report.
- Select the Highlight check box if you want to highlight the filtered tasks in the report.
- Click Calendar and choose which calendar you want to use in the report.
- Select or clear the Gray nonworking days, Solid bar breaks, and Print gray bands check boxes to control how the report displays the calendar.
- Under Show tasks as, choose whether you want the tasks in the report to display as Bars, Lines, or Start/Finish dates.
- Under Label tasks with, select or clear the ID, Name, and Duration check boxes to control what information is displayed for the task in the report.
- Click OK to finish creating your custom report.
Crosstab reports include task and resource information spread across a certain number of time periods.
LET ME TRY IT
To create a custom basic crosstab report, follow these steps:
- On the Project tab, in the Reports group, click Reports.
- Click Custom and then click Select.
- On the Custom Reports dialog box, click New.
- Click Crosstab in the Report type box and then click OK.
- On the Definition tab, type a name for the new report in the Name box.
- Under Crosstab, complete the following:
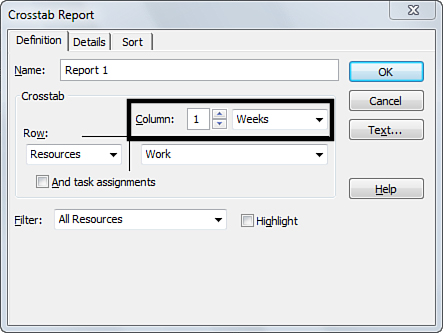
• Column— Type the number of time periods you want to include, and then choose which time period you are using. For example, type 4 and then choose Weeks. Figure 8.6 shows the column options.
Figure 8.6. Column options on the Definition tab are highlighted.
• Row— Choose whether you want to display Tasks or Resources in each row and then choose which field you want to display across the time period columns. Figure 8.7 shows the row options.
Figure 8.7. Row options on the Definition tab are highlighted.
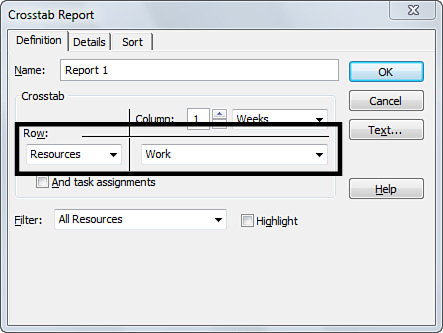
• And resource assignments/And task assignments— Select this check box to include assignment information in the report. If you selected Resources in the Row list, this check box is labeled And task assignments. If you selected Tasks in the Row list, this check box is labeled And resource assignments.
- Click Filter and then choose what data you want to appear in the report.
- Select the Highlight check box if you want to highlight the filtered tasks in the report.
- On the Details tab, choose the check boxes for data you want to include in your report and then choose from the following options:
• Show zero values— Select this check box if you want to display a zero when no data has been entered.
• Repeat first column on every page— Select this check box to display the row headers on each page of the report.
• Date format— Choose the format you want to use for dates in your report.
- On the Sort tab, use the Sort by and Then by lists with the Ascending or Descending option to choose the order in which data in your report should be listed.
- Click OK to finish creating your custom report.
Sharing Data with Others
So let’s say someone else has requested detailed data about your project. Arguably the easiest route in this case is to simply send a copy of the file to the other person and have that person open it with Project 2010 on his or her machine. Unfortunately, it’s rarely that easy. If the person requesting information doesn’t have Project 2010 installed, your options become a little less direct, but not necessarily less detailed.
Depending on what the other person wants to do with the project data, a few different options are available, as covered in the following sections.
Copying the Timeline
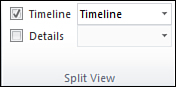
The timeline is new to Project 2010 and provides a highly visual way to share project information. After setting the timeline up with the information you want to share, you can easily copy it for pasting in another application.
Follow these steps to copy the timeline:
- If the timeline is not currently displayed, on the View tab, in the Split View group, select the Timeline check box, as shown in Figure 8.8.
Figure 8.8. The Timeline check box is on the View tab, in the Split View group.
- Click once in the Timeline portion of the Project window to select it.
- On the Format tab, in the Copy group, click Copy Timeline and then choose whether you’re copying it For E-mail, For Presentation, or Full Size. Project will use different formatting options based on your selection.
With the timeline copied to the Clipboard, open the e-mail message, presentation deck, or other file where you want to include the project information, and then paste the copied timeline. It will be pasted as an image within the e-mail message or file.
LET ME TRY IT
Exporting Data to Excel
If the person requesting project data wants to be able to actually work with the data itself, the right solution might be to export the data as an Excel workbook.
To export project data to Excel, follow these steps:
- On the File tab, click Save As.
- Browse to the location where you want to save the Excel file.
- Type a name for the file in the File name box.
- Click Save as type and then choose Excel Workbook.
- Click Save.
- Follow the steps in the Export Wizard to save the project data.
LET ME TRY IT
Taking a Picture of Your Project Data
If the person requesting project data just wants to look at the data, not actually do anything with it, you can copy a picture of your project data and share it by pasting it into another file or e-mail message.
Follow these steps to copy a picture of your project data:
- Format the data in a view the way you want to share it and then select the data you want to share. If you want to share all of the data in the view, you don’t need to select any data, just click once anywhere in the view to select it.
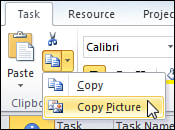
- On the Task tab, in the Clipboard group, click the arrow on Copy and then click Copy Picture, as shown in Figure 8.9.
Figure 8.9. Click the arrow on the Copy button and then click Copy Picture.
- Under Render image, choose whether you want to copy the image For screen, For printer, or To GIF image file. If you choose To GIF image file, click Browse to locate where you want to save the GIF file.
- Under Copy, click Rows on screen to copy all of the rows displayed on the screen, or click Selected rows to copy only the rows you selected before you clicked Copy Picture.
- Under Timescale, click As shown on screen to use the full timescale currently displayed in the view, or choose From and To dates to specify a time period to include.
- Click OK to copy a picture of the project data in the view using the options you selected.
Saving the Project As a PDF or XPS File
Another option for simply viewing project data is to save the project as a PDF or XPS file.
To save the project as a PDF or XPS file, follow these steps:
- Format the data in a view the way you want to share it and then, on the File tab, click Save As.
- Browse to the location where you want to save the PDF or XPS file.
- Type a name for the file in the File name box.
- Click Save as type and then choose PDF Files or XPS Files.
- Click Save.
- On the Document Export Options dialog box, under Publish Range, click All to include the entire project or click From and specify a date range to only include a certain time period.
- Under Include Non-Printing Information, select or clear the Document Properties and Document Showing Markup check boxes to choose which options to include.
- Under PDF Options, select or clear the ISO 19005-1 compliant (PDF/A) check box to determine whether the PDF should conform to long-term archiving standards.
- Click OK to save the PDF or XPS file.
Collaborating with Others on Your Project
If you are using Project Professional 2010 with Project Server, you can work on a project plan with others who may not have access to your Project Server. By saving the project plan for sharing, you associate the file with its checked-out location in Project Server. The file then can be sent around to others, who can use Project Professional 2010 on their own machines to make changes. Then, when the file is returned to you with changes, you can open it up and check it back in to Project Server.
Show Me: Media 8.2—Collaborating on a Project
Access this video file through your registered Web Edition at my.safaribooksonline.com/9780132182461/media.
LET ME TRY IT
To save a project for sharing with others, follow these steps:
- With Project Professional 2010 opened and connected to Project Server, click the File tab and then click Open.
- Click Retrieve the list of all projects from Project Server and then double-click the name of the file you want to share with others.
- On the File tab, click Save Project as File.
- Click Save for Sharing and then click Save As.
- Type a name for the project file in the File name box. A best practice here is to use the same name as the Project Server filename.
- Locate where you want to save the file locally and then click Save.
With the file saved locally, you can attach it to e-mail or place it on a network share to enable others to open it. Other people opening this file must also have Project Professional 2010. Although the file is saved locally, it remains checked out from Project Server. When changes are made to the file, you can check it back in to Project Server.
Follow these steps to check the file back in to Project Server, with changes:
- With Project Professional 2010 opened and connected to the same Project Server on which the project is checked out, click the File tab and then click Open.
- Locate the changed, shared file, and then click Open.
- On the File tab, click Save As.
- Click the name of the file in the Save to Project Server box.
- Click Save to replace the file on the server with the file you were sharing.