4. Politics (Presidential Election Campaigns)
After Eisenhower, you couldn’t win an election without radio. After Kennedy, you couldn’t win an election without TV. Obama showed us the same thing for social media. But in 2012, it’s the data that will make the difference.
—Strata Conference, Get the (Data) Vote Out, June 20, 2012
Introduction
Political campaigns have a very concise performance metric: Win the election at all costs. And the costs were high in 2012 for the presidential campaign. It is estimated that more than $2 billion was spent by the campaigns directly,1 with hundreds of millions more spent by super PACs and other committees.2 Much of the effort was targeted on the million or so swing voters from eight “tossup” states at a cost of well over $1,000 per vote. If $1,000 is the acquisition cost, what is the value of a vote? This acquisition cost is certainly a high mark for the industry and for other industries as well. Is a vote of value equivalent to a TV, car, boat, or house? Industries certainly compute what the return on investment (ROI) is for marketing and sales based on the value of the product. The value of an election is not clear...and the sky seems to be the limit.
The 2012 campaign might have been a turning point in how strategy, decisions, and operations are executed. The influence of larger-than-life political strategists/gurus, who direct the course of the campaigns based on their deep political intuition, might be ceding a bit or a lot to data-driven approaches. The old ways of image making, negative ads, and top-down campaign management are just not sufficient to win. The new way of knowing “each” voter through personal analytics is a surer route to victory. And in order to act on this newfound data, a new management approach was used that democratized the data to the individual campaign worker and relied on them to deploy it with their own energy and judgments to achieve their own dashboard metrics.
The prevailing opinion is that President Obama won the election by collecting and deploying big data to understand and track the opinions and voting inclinations of swing voters and then embed that information in campaign operations to get more votes. The Obama data operation, named “Narwhal” (for the arctic whale with a long spiral tusk), built an unprecedented data warehouse including data from pollsters, fundraisers, field workers, consumer databases, social media, mobile contacts, and voter files. The data was used to increase the effectiveness of campaign workers on the ground, social media outreach, and all other channels. The data-driven approach was so strong that David Axelrod, President Obama’s political advisor, said that the biggest single lesson from the campaign to be remembered for 2016 was “I would invest in people...who understand where the technology is going and what the potential will be by 2016 for communications, for targeting, for mining data, to make precision possible in terms of both persuasion and mobilization.”3
In addition to the stunning success of analytics to essentially guide who the leader of the free world would be, analytics was in the spotlight for its predictive accuracy on who would win the election. One analyst, Nate Silver, predicted the winner within a few electoral votes six months before the election, and this did not change much right up to the eve of the election despite all the campaign antics that ensued. He has also become a crossover star, going from being a cult hero “stathead” to a highly regarded commentator on politics and other industries and a best-selling author for his book on predictions, The Signal and the Noise.4
The 2012 presidential election is a glorious testament to the success of harnessing big data, predictive modeling, and an old standby, polling, to achieve a momentous outcome. There is just no comparison from other industries that is anywhere close to this stunning accomplishment of analytics.
In this chapter on analytics for the political campaign industry, we cover the following areas: What is the context of the industry in terms of its major strategic and operational challenges? What are the industry’s sweet spots? What are the adaptations for healthcare?
Industry Challenges
Winning a presidential election in the U.S. is a huge challenge because the electorate is deeply partisan and was equally divided on its choice in 2012. More than 97% of the electorate had made up their minds. Only 3% percent were uncommitted. And only one or two percentage points would sway the election.
The fundamental strategies for getting votes cast in your favor on Election Day are these:
• Get enough swing voters to commit to your side...and make sure they vote.
• Hold the base...and make sure they vote.
Swing Votes
It’s about the electoral count, not the popular vote. So work has to be distributed to every state, more or less, depending on the number of electoral votes at stake and the return on investment to win a given state. The swing votes matter in just a handful of states to shift the popular vote in one direction and put that state in the electoral column. Winning the election came down to just eight states that represented 95 electoral votes.
But not all swing votes are of equal importance and this makes the analytics interesting. It was possible to classify the probability for the swing voters in a given state to vote for Obama or Romney based on their personal characteristics and how “elastic” the state is in terms of how overall issues like new economic data influence the entire swing population. Undecided voters are not necessarily swing voters and many undecided citizens are not going to vote or swing. For example, African-American males are more likely to vote Dem. Female Southern Evangelicals are more likely to vote Rep.5 Knowing more and more information about the individual and the correlation of that information with voting tendencies produces an increasingly refined prediction model of which way a swing voter will decide and whether they will go to the polls and vote. An exquisite logistics regression model developed by Nate Silver,6 which incorporates an understanding of swing voters’ characteristics and the overall elasticity in a given state, was able to provide a valid estimate of the likelihood that an individual voter would be influential in determining the Electoral College winner. The model produces a return on investment metric, which is the likelihood that an individual voter would determine the Electoral College winner. The highest ROI states were New Hampshire, Ohio, Nevada, and Virginia. Obama won all of them.
Swing voters, also known as fence sitters, can be easier to find than to persuade. They do not watch Fox or MSNBC and are generally AWOL from most things related to the election. For example, for those without a college degree, those who are trying to get one, and those who are working two jobs to stay afloat in hard economic times, the presidential election is just not on their radar screen. According to Jeffrey Pollock, the president of Global Strategy Group (a polling firm for Priorities USA Action, a pro-Obama super PAC), white noncollege swing voters are “particularly low-information voters who don’t pay attention to the daily political back-and-forth, so their opinions are driven by their economic situation.”7
Fence sitters, by definition, do not show commitments easily, so it is hard to know how to influence them. Some say it is about emotional intangibles that might trigger their aligning with one candidate or the other. Words that cause a trigger include female healthcare, Medicare, abortion, jobs, “government run,” socialism, the 47% crowd, lower taxes for the wealthy, and so on. And these issues got a lot of play in the 2012 election. For the fence sitters, it can well come down to a single event like a debate, the jobless number in November, or an unanticipated world event, like an eruption in Afghanistan. Perhaps the emotional trigger issue and the paucity of time to be fully engaged are indeed the reason why negative ads were so much a part of the campaign. In addition to the debates and extensive advertising, there will be boots on the ground to hunt, find, convince, and knock these important voters off the fence and into their cars to drive them to the polls.
Hold the Base
The other, complementary strategy is to get out the vote from the core loyalists. Conventional wisdom on elections strategy says that when there are few persuadable voters in the middle, it comes down to a turn-out battle. This strategy requires constant pressure in each state, especially in those that are “leaning” one way or the other. There are ten states leaning. If you live in died-in-the-wool red or blue states—for example, all West Coast states are for Dems and all Southeast states are for Reps—you might never have seen the endless cascade of political ads in the 2012 election. The electoral vote for these states is considered a done deal. If you live in Ohio or Florida, the states with the highest electoral votes in play, you might have very well seen the President up close and personal at your neighbor’s house.
Industry Strengths
To understand how analytics contributes to the previous strategies, the strategies need to be decomposed into the key tactics that support them. There are seven key strategies, all starting with m, including money, messaging, medium, microsegmentation, math, mobilization, and motivation.
Money
Money raised from supporters is the essential fuel for political campaigns. Without it, the campaign comes to a halt (as it did for many candidates in the Republican primaries). And not enough of it can tilt the scales through an imbalance of TV ads for the more wealthy side. The amount of money raised for this presidential campaign exceeded $3 billion.
Most of the funds raised for the 2012 presidential campaign did not come from a broad representation of citizens. Contributions to the campaign coffers of less than $200 amounted to about 40% of the Obama campaign and 20% of the Romney campaign (as of the end of August).8 However, most of the money spent on the presidential campaigns will come from super PACs that were spawned by the U.S. Supreme Court’s Citizens United decision. The super PACs cannot provide funds to the campaigns and must conduct their spending independently. There are no legal limits on the amount of money that can be raised or from whom, including corporations, unions, and foreign governments. This can severely limit “full representation” in a democracy and the real possibility of buying the presidency.
Most industries raise capital from financial markets or use earnings to fund operations, new product development, and all the rest. Political campaigns are different and are more like charitable organizations than profit-making organizations. The latter does not need widespread public approval (unless it affects the brand and sales). It mostly focuses on shareholder approval, which primarily rests on good financial results. The former depends on the generosity of followers and powerful influencers to exist at all. In some cases, politician millionaires like Mayor Bloomberg of New York City and Governor Rick Scott of Florida provide a major source of financing. Usually, the campaign must raise mostly all of its funding through solicitation.
There are a few unique features about raising funds in the political sector:
• Of most importance is that people need to believe in the cause. The cause must tug at the heartstrings. It must evoke emotion, the preservation of an ideal, a change in the status quo. It is doubtful that a singular approach, like incessant daily e-mails, however well executed, will work. (And the Obama election campaign got annoyance demerits for its daily onslaught of e-mails from the President, VP, First Lady, and others asking for money.)
• The campaign must continually engage. The events of the world, and negative TV ads, have dramatic effects on voter sentiment and perceptions of their place in the world and their view of the candidate. Therefore, it is necessary to keep followers in the fold.
• Politics must touch a lot of people to raise funds, including the small and big supporters and all those in between. As with other businesses, it has different price points for different buyers.
• Finally, there are different legal and ethical constraints related to raising money in politics relative to business. A privacy breach about donors in politics would engender immediate press coverage. There are constraints on the maximum direct contributions to campaigns. There is much more transparency and media activity to expose ethical and legal lapses. Eyes are always on the campaign and there is no place to hide; consider, for example, campaign troops attending speeches with their minicams looking for a news-worthy gaff.
These features define how analytics supports one of the most important tactics of politics, raising money. On the one hand, raising money in politics is similar to making money in corporations, for example, understanding markets and various buying segments, targeting messages, providing purchasing incentives, and delivering on the promise to earn repeat business. On the other hand, it is quite different in that the representation of the product needs to be constantly updated to respond to opponent attacks and events largely out of its control, as well as the fickleness of an electorate that can change its mind because of a grimace or gaff in a debate. Hence the need for the next m, effective and continually evolving messaging.
Messaging
Messaging is a refined art and science in politics. For example, Vice President Biden’s pithy response to the Republicans’ question, “Are you better off today than four years ago,” was this: “Bin Laden is dead and General Motors is alive.” It was concise and held a lot of meaning that responded to deep concerns of its intended audience. Also, politicians are on the stump every day, prone to many questions (and videos) on their positions, and “staying on message” is vital.
There are five essentials for an effective political message: (1) frame the issue, (2) appeal to values, (3) keep it simple, (4) keep it believable, and (5) create a mental picture.
Messages need to be different for different voter segments. For example, a tax message to one group might be, “We need to invest in infrastructure, education, and so on.” Alternatively, the tax message could be, “Americans need tax relief.” But the reality is that there are many segments, and the more targeted the message, the better. It is conceivable that there could be as many message packets as there are microsegments. In fact, it could be tailored to a market of one. Analytics contributes fundamentally by defining distinct microsegments based on data about values, what images resonate, what language works, and so forth. And this requires a good deal more data than is currently available.
Medium
Many media channels are available to get the message out, including newspapers and magazines, flyers, billboards, e-mails, Web sites, TV, voice phone, smartphone, social media, and more. People have their own preferences on how to receive information. It is important to match these channel preferences to targeted messages for specific microsegments. In general and across industries, wholesale approaches such as 30-minute TV ads and voice-phone messaging are giving way to customized approaches such as changing ads on a mobile device, which takes into account voter file data and the “cookies” placed on consumers’ computers by commercial advertisers. Increasingly, mobile has become the nexus of the multichannel portfolio.
Microsegmentation
One of the key lessons from the Obama victory in 2008 was “divide and conquer.”9 That is, divide up the general population into smaller segments and do unique and compelling things to change their behavior. Microsegmentation is a central theme in marketing in all industries. Retailers have segments based on buying patterns like “brand fanatics,” “let’s bargain,” and “media socialites.” Healthcare has segments like “empty nesters” and “young and healthy.” Politicians have segments based on voter demographics like “white, Southern, male, non–college educated” and “female, Evangelical, Southern.” The challenge for microsegmentation is approaching the ideal of a market of one without the one-on-one friction and cost, and achieving it through more efficient mass, radical customization. More data on the individual leads to more fine-tuned methods.
Math
Data-driven enterprises require big data. And big data requires big math. The finer data granularity needed for modeling and advanced decision support requires much more data, better equations, and out-of-the-box modeling.
Polling has been the mainstay and essential analytical feature of campaigns for decades. Math is needed to make generalizations from samples and always includes the ever-present “margin of error.” But polling, in and of itself, is yesterday’s news and provides a static snapshot in time. More dynamic views are needed and that is where big math steps in, especially focusing on predicting the future. Modeling is an important math discipline that often results in predictions such as the likelihood of a fence sitter making a difference in electoral votes as discussed earlier.
Politics has captured many streams of new data, ranging from “listening” files from campaign workers, to social media, to personal data bought from data aggregators like Acxiom and Experian. Big math is needed to make sense of it, running all types of correlation tests to see how it can be used for predictions. For example, how much weight does one put on religious preference, home value, occupation, recent retail purchases, preferred brands, ZIP Code, donation history, and facial characteristics? The list of possibilities is endless.
Mobilization
Mobilization has to do primarily with getting voters convinced, motivated, and delivered to the polling place. Mobilization is the work of all the campaign workers on the ground in campaign offices throughout the nation, doing such things as knocking on doors, distributing leaflets, and the like. Mobilization is increasingly being accomplished over the Web and through social media sites to create and sustain followers and advocates.
Motivation
Presidential campaigns are long, two-year sprints. This is about motivating citizens to get engaged and vote. It is also about getting campaign workers to stay motivated and work to peak performance. Supporters leverage the key purposes and resources of the campaign at the ground level. Motivation goes beyond blunt, anonymous campaign messages and increasingly has more to do with relationship management. With the new generation of data-driven campaign workers, it is necessary to motivate them, including giving power (and all the information) to them and giving them the autonomy and attendant satisfaction to make their own decisions and take risks and develop networks of influence.
Analytics Sweet Spots
Politics incorporates a wide span of analytics, including most of the analytics across industries described in the introduction. Its unique analytic sweet spots that have relevance to health are polling, predictions (voting and winning), and new data (democratization) (see Figure 4.1).
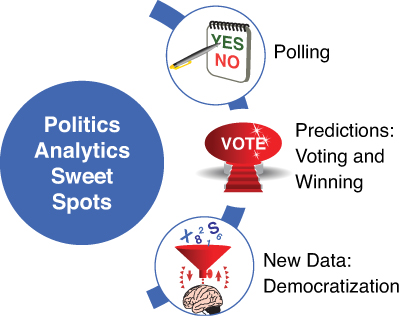
Polling
This is a case of getting the right data directly from a willing participant’s head rather than getting convenient data of questionable utility covertly from her data streams.
Polling is the quintessential mainstay of political campaign analytics. Polls seek to understand who is winning and why, and polling uses the scientific method to pick representative samples of voters, conduct interviews, and use statistics to achieve confidence in its results. It even makes the actual results of elections an afterthought because elections are “declared” early from exit polls, and even from polls conducted months in advance. In fact, polling was so accurate in the 2012 election that the actual act of going to the polls to vote could be considered a quaint ritual in the years ahead. Finally, polls captivate the electorate on who’s winning the race. And the data provide critical feedback to the campaigns to readjust tactics.
Polling is a form of surveying that is done in every industry. Most notably, industries use surveys to get customer feedback on the satisfaction with products and services. Surveys are an important method for scientific research in health and other industries like life sciences and education. But political surveying has unique characteristics.
Polling is widely used, especially during campaign seasons. For example, five different polls were released on one day, for one state (Ohio), on the eve of the presidential election. Polling is highly accurate, especially when multiple polls are combined. The margin of error on the five Ohio polls was +/–1.5%. Polls are extraordinarily visible, appearing in multiple news outlets, often as the lead story. And polls are repeated over time for the same population (although not the same sample) and provide a longitudinal view of the data.
Another unique feature of polling and surveying as an analytic method is the way the data are collected, that is, directly from citizens, customers, and patients, as compared to data extracted from transactions such as purchases or medical bills or social media communications. This is a case of getting the right data directly from a willing participant’s head rather than getting convenient data of questionable utility covertly from her data streams. The data is richer and more pertinent to the hypothesis under consideration; for example, who will win the election. And it has the potential to enable an ongoing conversation with the individual customer or citizen to gather even more data and to be customer-centric in the process—provided that the organization doing the surveying is trusted and gives something of value in return.
There are challenges with political polling mostly having to do with representativeness of the samples. Response rates are low (at about 20%) and declining. Telephone land lines are decreasing, and it is more difficult to conduct an interview with cellphones because laws prohibit “robocalling” and calling during specific hours. Additionally, cellphones can have an area code that is not where the respondent lives, thus confusing geographic sampling. Online polls are entering the mix of polling media. But, again, those who respond are Internet savvy and not representative either. Finally, social media sentiment analysis that quantifies the level and change in positive and negative messages from Twitter and Facebook are emerging, but the segments that “tweet” are not representative. The bottom line is that no one channel is representative; however, this is correctable to some extent and for some purposes through the use of predictive modeling, as described later in this chapter. And more data, from more sources, nearly always produces better accuracy through higher sample sizes and convergence.
About 60% of eligible voters went to the polls in 2008 and 2012. Their voices were heard and they were a part of something larger than themselves in determining the leadership and fate of the nation. A lot was at stake and the majority of Americans wanted to participate.
Does the same thing happen in healthcare? Not by a long shot. Even though the economic fate of the nation is very much determined by decisions about healthcare’s performance as a social system, people are only remotely engaged in giving their voice for change. And, even more remarkable, people are generally removed and unengaged from most aspects of ensuring their own health...never mind the health of the country.
How might polling in healthcare help? There are entrenched obstacles. On the one hand, it is not clear that anybody is really listening to patient input through traditional healthcare surveying. And on the other hand, it is not clear what our roles should be as patients.
Patients do give feedback on their satisfaction with hospital care. Hospitals have been conducting surveys of patients on their satisfaction with care for a long time. They have used survey instruments from well-established commercial firms such as Press Ganey, and many hospitals have used the results to make improvements in hospitality and communications functions. Now, CMS is emphasizing the importance of patient engagement through a pay-for-performance initiative with about $1 billion at stake that rewards/penalizes hospitals based on the results of HCAHPS surveys (Hospital Consumer Assessment of Healthcare Providers and Systems). HCAHPS is an important advance in measurement because of the content (satisfaction and engagement), the substantial research by the Agency for Healthcare Research and Quality (AHRQ) to refine the tool, the standardization and implementation protocol that allows meaningful comparisons among hospitals, and public reporting on the CMS Hospital Compare Web site and others.
This is definitely an important step in the right direction, although many providers balk at the idea of “making patients happy when they have stage 4 cancer.”10 What’s important to know is that a very small percentage of patients are sampled. Hospitals, on the average, must complete only 100 patient surveys a year. This comes down to about 1.5% of hospital discharges in the U.S. (There were 36 million discharges in the U.S. in 200911 from about 5,750 hospitals.12) This sampling frame is adequate for making comparisons among hospitals presuming that patients are sampled similarly across hospitals. But it is notable that the HCAHPS participation rate is about one-fiftieth the size of voter participation in national elections. If we lament the poor turnout in voting, how should we regard the extraordinarily poor opportunity for voice in healthcare? (Note also that the HCAHPS public reporting and pay for performance is only for hospitals and excludes the vast majority of Americans who do not go to the hospital.)
Clearly, the purpose of HCAHPS is not to engage the public about the future course of healthcare policy. The past two national elections have certainly been about healthcare reform to some extent, and people registered their vote about it. The one issue of healthcare, however, was enmeshed in many other issues, most notably jobs and the economy. And it is questionable how much the electorate was actually engaged and understood the big issues. By and large, the “conversation” was a media “push” of carefully crafted messages and advertising manipulation to tell people how to vote. Can there, should there, be a dialogue about healthcare, especially in regard to the trade-offs that citizens as stakeholders should make that counterbalances the influence of vested interest groups?
The lack of opportunity for participation in healthcare goes much deeper than (just) 100 patients per hospital given the opportunity to provide feedback on their hospital stay. It also goes to the core of how people are engaged in their own treatments. People are the most important determiners of their own health. The research is very clear that personal behavior is three to four times more important than healthcare in producing good health. But it is also clear that people do not “comply” with treatment or “adhere” to prescriptions. And patients are not engaged in decision making where their preferences are most important, especially when considering elective procedures that have equivocal medical outcomes. This general lack of acceptance and practice of shared, or informed, decision making is another signal of the need for transforming the ways to engage people. It’s one thing not to vote and make your voice heard in Washington. It’s quite another thing to be absent from decisions about your own life and death. Similarly, the excellent movement to have patient-centered medical homes is very important to improve the coordination of care, but it is not the answer to achieving a patient/people-centric health system with optimal patient engagement.
Finally, only a small minority of people/consumers use “standardized” information like HCAHPS to select hospitals or health plans for a variety of reasons, not the least of which is that they do not have a whole lot of choice. They depend on their doctors to make referrals to hospitals and on their employers to select insurance plans for them. People do not act like the rational consumers that markets espouse, because, er, healthcare is a poor market. And it is pretty widely accepted that public reporting of performance information is directed much more at providers than at people. Providers do respond to the data even though the rationale for doing it is for “consumer decision making.”
People who have health issues do want to talk about them. In fact, for many older people, health is a major agenda in their lives. It can occupy much of their time with frequent and regular medical visits. And the uncertainty and worry about the life-and-death consequences are at the forefront of their attention with seemingly an unquenched appetite for discussion, understanding, and resolution. This yearning for answers and guidance is not always provided by the medical system, and people remain frustrated by the incomplete responses to their questions and concerns.
The medical system might simply not be capable of providing the level of communication and engagement that many people want. And because they have not gotten it, they have receded from behaving in ways to elicit it because it has just not reinforced their needs. It should be no surprise to anyone that the medical system is fragmented and uncoordinated and lacks good skills in communication. For example, how successful have you been in having records transferred from one healthcare provider to another? In getting lab results or biopsy results in a timely way? In just trying to have a doctor call you back? How would a consumer react if this transaction and communications failure happened routinely in banking—for example, if deposits went to the wrong account, if the bank could not post a deposit for a week, or if it did not know what the balance in the account was and would not provide cash at the ATM? It doesn’t happen in banking and it shouldn’t happen in healthcare.
Clearly, the medical system can and should make improvements in communications, but it should not be the only avenue for patient voice. More and more people are favoring connections and communications with their peers and depending less on pronouncements from systems with their seemingly inherent obstacles to communicating with customers. Good customer service is more of a surprise than an expectation in most industries today. People want to hear about what friends say about a hotel, not what the hotel marketers are saying. People want to evaluate products and services and “pass it forward” for others in the community to benefit from. The idea of top-down surveys might feel like a top-down extraction of information rather than engagement. It’s time for a change to get people engaged in healthcare. Politics and polling provide some clues.
It is important to recall that there was a time in the politics of the U.S. when citizen participation was a mainstay in shaping social issues and solutions. This was during the gilded age of community planning and it was particularly so for health. One important example was the Oregon Health Plan in the 1970s and 1980s, which included a great deal of citizen deliberation about priorities for healthcare, including what services would be paid for under Medicaid. It was the right approach to engage citizens in making trade-offs. Indeed, the only way to control costs might be to understand that resources are limited and trade-offs need to be made and that the politic process needs to activate deep citizen participation. Community planning and citizen engagement peaked during the Great Society era enabled by the legislation driven by President Lyndon Johnson. But citizen participation was, by and large, driven off the cliff when a market-oriented approach to healthcare, as ushered in by President Reagan–era policies, surged ahead of a government/community approach. Perhaps the pendulum has swung back a bit.
Why not have a “moon shot” on one big outcome in healthcare, like a presidential election? Get everybody involved, measure success, make improvements, and rejoice in victories? That one big outcome could be the well-being of citizens in the country. European and Asian countries and Canada are very clear that the success of a country is based not solely on its GDP but on the well-being of its citizens as well. And these countries believe that government should respond to the signals from its citizen customers and be accountable for improving well-being. These signals are measured and reported through surveys on well-being.
The Canadian Index of Well-Being (CIW) is a single composite measure derived from eight measurement domains (see Figure 4.2).13 These include measures related to “healthy populations,” as well as other determinants of well-being, including education, living standards, community vitality, democratic engagement, time use, leisure/culture, and environment.

Source: Canadian Index of Well-Being (2012). Reprinted with permission from the Canadian Index of Well-Being.
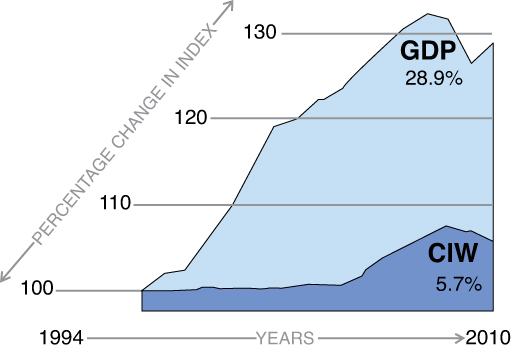
Figure 4.2 Components and growth rates of the Canadian Index of Well-Being.
The percentages in the figure are the changes in the index from 1994 to 2010. So the 5.7% change in overall well-being represents a very modest annual change of less than 0.4%. During the same period, the economy, as measured by the GDP, increased 28.9%, or about 1.7% per year (see Figure 4.3). The improvements in GDP are not well correlated with improvements in CIW. For example, for the first ten years in the chart (until 2003), the CIW remained flat although GDP increased 23%.
Source: Canadian Index of Well-Being (2012). Reprinted with permission from the Canadian Index of Well-Being.
Figure 4.3 Percentage change in GDP and CWI.
Note also that China measures well-being, or happiness. The China index also shows the same lack of correlation between growth in GDP and growth in well-being.
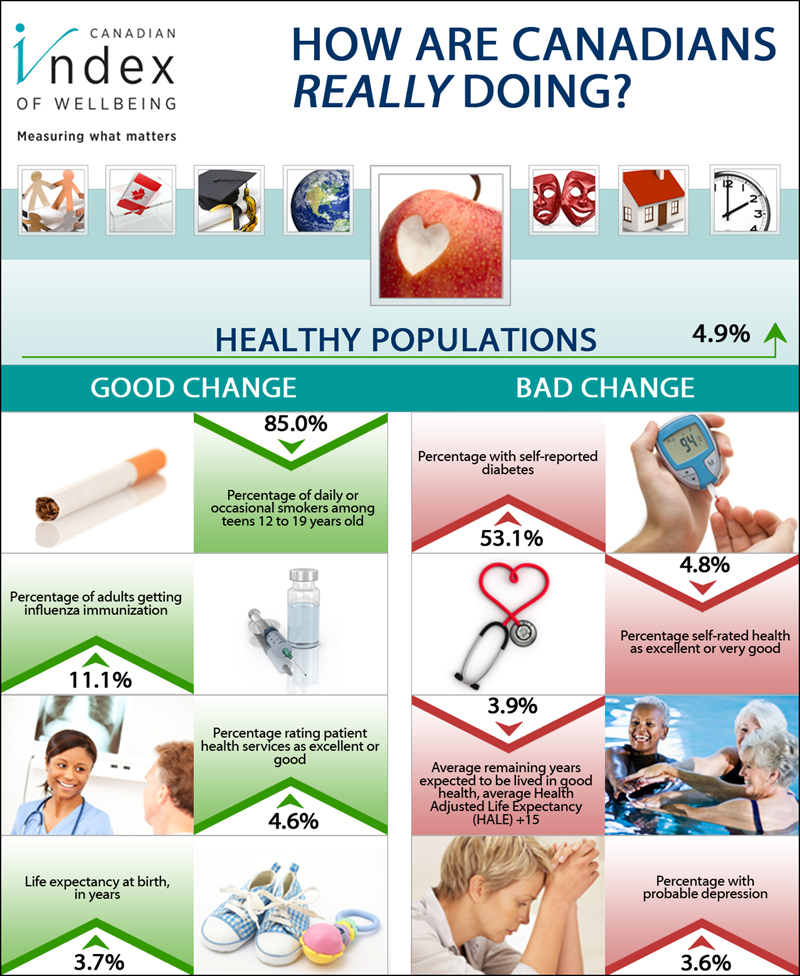
The “healthy populations” domain includes measures on smoking, immunization, life expectancy, probability of depression, and good health years remaining (see Figure 4.4). Some measures require citizen participation through Statistics Canada surveys to populate the metrics, including patient ratings of health services, self-reported diabetes, and self-rated overall health.
Source: Canadian Index of Well-Being (2012). Reprinted with permission from the Canadian Index of Well-Being.
Figure 4.4 CWI: healthy populations.
Note that the improvement rate over the 17 years is 4.9% and the major positive change included a drop in smoking among teens of 85%, which was partially offset by an increase in self-reported diabetes of 53.1%.
In the U.S., there is a good deal of surveying on health and healthcare. In terms of health, multifaceted measures of health at the county level, called County Health Rankings,14 are publicly available. And comprehensive views of quality of healthcare based in part on population surveys are reported at the national and state levels by AHRQ and the Commonwealth Fund. But the evidence is not compelling that the information in these very good reports is being translated into action by governments and health systems responsible for the well-being of their populations. And, again, it is more aimed at the policy and provider professionals than to the individual citizens.
The learning from political polling might boil down to this: Keep it simple, keep it focused, make it public, and make it meaningful. In Canada, the provinces “compete” to be recognized as the best place for citizen well-being. Alberta is the place to live in Canada, according to the CIW. And they use it to improve government services to its citizens. Ideally, the index would be used to hold political figures accountable for the well-being of those they serve, as they are for education, roads, and jobs.
In the U.S., the technology exists to have a meaningful well-being index at the national, state, and local level. Underlying much of the surveying of people about their health in the U.S. is CDC’s Behavioral Risk Factor Surveillance System, commonly referred to as BRFSS.15 The CDC conducts 400,000 interviews a year. It includes 16 core sections that are asked of all respondents, including questions on health status, healthy days, and risk factors such as exercise, smoking, and blood pressure. It also has 34 optional sections, including sections on managing chronic diseases such as diabetes, heart attack, and depression. It also includes questions on related but nonmedical issues, including reactions to race, for example. BRFSS is usually reported at the state level. It can also “oversample” a geographic area such as a city for a more granular read on health. Cities and towns, rather than states, regions, and nations, are more localized and amenable to community engagement and action, and that is where the focus should be on measurement. The bottom line is that BRFSS is an amazing resource for “polling” people about health and well-being in geographic units that are most meaningful to them.
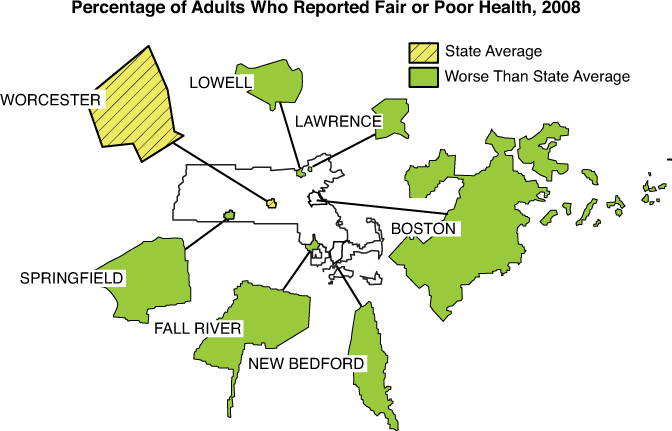
An example of oversampling at the city level is taken from the work of the Public Health Department for the Commonwealth of Massachusetts.16 The state paid for the oversampling of large, relatively poorer cities on a few survey questions of the BRFSS. The results for one of these questions, which asked respondents to rate their overall health as excellent, good, fair, or poor, are included in Figure 4.5.
Source: The Massachusetts Department of Public Health, 2009. Reprinted with permission from the Massachusetts Department of Public Health.
Figure 4.5 Health ratings by cities in Massachusetts.
The chart shows the percentage of respondents who reported fair or poor health. One city, Lawrence, had 30% of its citizens reporting fair or poor health, compared with the state average of 15%. New Bedford, also a relatively poor city, had a rate of 26%. These are compelling data to show a marked (2:1) difference in perceived health that should warrant some action.
The problem with taking action might be that the technology overhangs the sociology (yet again!). It is possible to poll people about their perceptions of health and to achieve a good deal of scientific accuracy. (Note that some researchers perpetuate inaction by questioning the validity of self-reported health assessments.) However, the sociology might not be in place to do anything with the information, therefore rendering the measurement process relatively useless. In the State of Massachusetts, the government’s role was to inform and educate through its publications and public presentations. Alternative action might include state aid or organizing community groups to improve health or public hearings to understand, explain, set an agenda, and coalesce community action for improvement. It might also include a public reporting and pay-for-performance program to reward municipalities that are making progress. In all fairness to the state, and to other states, the budget crisis over the past few years resulted in very significant reductions in funding for public health programs.
So the point here is that a survey needs to have meaning for the respondents. It should engage people beyond just producing answers. The topics need to be of interest to the people. It has to be simple. Preferably, it rallies a community’s interest. Greater use of BRFSS and a moon race on well-being are good possibilities. But the process of engagement and the ways the data are produced might be anachronistic. More on this in the “New Data: Democratization” section.
Predictions: Voting and Winning
The data derived from political polls are an important element for predictive modeling about likely winners. But there is much more involved in making accurate predictions. It is instructive to look at Nate Silver’s FiveThirtyEight Methodology17 to understand how sophisticated it is. There are seven steps:
1. Determine the weighted polling average across all available polls, which takes into account the recency, sample size, and pollster accuracy rating of each poll.
2. Adjust the polling average based on trend lines, house effects, and likely voter status.
3. Perform regression analysis of nonpoll factors (when there are few polls) that incorporates information on partisan voting index, composition of party identification in the state’s electorate, sum on individual contributions received, incumbency status, recent approval and favorability ratings, and stature.
4. Take a “snapshot” by including the regression results with the weighted polling average to arrive at a new polling average.
5. Make an initial projection that takes into account distributing the undecided vote, adjusting large leads due to likely regression to the mean, and adjustments that current standing might not be the most accurate forecast.
6. Make adjustments to the projections based on other factors related to possible errors including when polls disagree, there is a larger number of undecided voters, and how far the poll is from Election Day.
7. Do a series of simulations that include decomposing the error associated with a forecast into local and national components and then randomly generating the errors over the course of 100,000 simulation runs.
The FiveThirtyEight predictions were highly accurate. On the eve of the election, the method predicted that Obama had an 83.7% probability of winning with 305 electoral votes. The actual number of Electoral College votes for President Obama was 327. What is even more intriguing is that the prediction of electoral votes was just about the same as was generated five months earlier despite all the campaign activities that ensued.
As a brief aside, the accuracy and methodology of polling could make voting obsolete. For example, polling can ensure representation from many segments, not just by states for the Electoral College determination. The Electoral College is a requirement going back hundreds of years to the Founding Fathers. Having to go the polls is inefficient and exhausting. Some voters in Florida waited six hours. Some subgroups are less likely to get to the polls due to transportation, work, and health issues. In addition to ensuring better representation, polling could be no less meaningful for citizen participation than voting. Polls can be conducted in different ways, including in person, by mail, and via the Internet. And polling can enable an ongoing conversation and ask more questions, more efficiently. Why should citizens have input on national issues (only) once every other year?
Predictive modeling in politics is used for more than projecting a winner. It has been used extensively across industries and in academic research, but only recently in campaign politics. It started in the 2004 presidential campaign and took off in the 2008 campaign. Obama’s analysts built predictive models to characterize different types of voters by their likelihood to vote for him and what their views were likely to be on issues such as pro-choice or pro-life. A vendor, TargetPoint,18 looks at the aggregate effect of a chain of variables on the likelihood to vote Republican. For example, if you add male, 59 years of age, and white to the formula, that bumps up the probability. If you add that the voter drives an SUV, that bumps it up again. And if the person has a Bible in the household, that bumps it up to 85% likely to vote Republican.
Predictive modeling can also be used for campaign operations, such as raising money, by understanding, for example, what type of individual is likely to unsubscribe from e-mail as related to different types of solicitations. This can lead the campaign not to ask for money, but perhaps only to ask for information, from certain individuals and thereby not suffer a disconnect from the voter. When it comes to sensitive subjects like contraception, a campaign could rely on its extensive predictive models of individual attitudes and preferences to find friendly recipients. For example, it might mean pulling e-mail addresses only for those who had identified themselves as women on their registration forms and whose voter records included a flag marking them as likely pro–abortion rights.
Other models go from predicting the behavior of groups of individuals to targeting the individual. For example, one vendor, Constituent Cloud,19 says that its proprietary algorithm ranks “each and every voter in your district” on “voters that will help you win” using data such as party, voting history, geography, race, and sex.20 These data are visualized. One vendor, Moonshadow, promises to “visually ‘fly over’ your state, viewing in great detail the location of every voter in your selection or ‘zoom down’ to the rooftop level to get information about the occupants of a single household.”21 With the right data and the right math and models, it is possible to go to a state and have a list of citizens, addresses, and their profile for a canvas worker to start a targeted house-to-house conversion process.
Predictive modeling works better with more data, and more data about the individual enables better targeting and customization. Political campaigns are relatively deprived of an ongoing stream of data about their clients (voters). Retail has mountains of purchasing data, banking has money transactions data, healthcare has claims and electronic medical records data, and sports has ongoing player performance data. Politics does have traditional data sources from voter registration, exit polling, opinion polling, and donation history data, but the periodicity is just every few years. And, like most industries, it wants more information on the individual. In fact, organizations like NationBuilder22 provide free access to voter files to anyone.
One way to get more data is through “microlistening.” One shortcoming of polling is that it cannot pick up on the intensity or priorities of voters’ positions. The Obama campaign used “microlistening” to dig deeper on these issues. The voter’s words are often included in the canvaser’s notes, call-center phone conversation, or “share your story” on the Web site. The campaign used text analytics to unlock the unstructured data so that it could be integrated with other structured data.23
The campaigns also used the information that came from campaign workers and interested supporters. For example, when people registered for Obama’s Dashboard, it asked them for permission to add information. This included such data as their name, picture, gender, networks, list of friends, and “any other information” left open for sharing on Facebook. It also asked for information on birthday date and city. And it requested approval to send e-mail and post to each respondent’s Facebook wall.24
Political campaigns are collecting information about individuals without their knowledge or permission as well. Some of it is provided “implicitly,” for example, through their clicks on Web sites picked up by “cookies” that track every move. Campaigns are also tapping information available from data purveyors such as Acxiom,25 Experian,26 Equifax,27 and Spokeo.28 According to the New York Times, the campaigns spent over $13 million on acquisition of data like “whether voters may have visited pornography Web sites, have homes in foreclosure, are more prone to drink Michelob Ultra than Corona or have gay friends or enjoy expensive vacations.”29 Consultants to both campaigns confirmed that they had purchased data from companies on “voters’ shopping histories, gambling tendencies, interest in get-rich-quick schemes, dating preferences and financial problems.”30 The political director of the Romney campaign mentioned how the retailer Target anticipates habits and “we’re doing the same thing with how people vote.”31
In summary, political campaigns gather lots of information about voters, directly from them through polling, “listening,” and campaign-worker interviews, and indirectly about them through clicks and purchased data. Together with better and cheaper computing power and more expertise in the data sciences, including predictive modeling especially, the campaigns achieved a sea change in capabilities, which might have spelled the difference in winning the election. According to the Obama campaign’s data director, they gained valuable insights about voters’ “motivations, attitudes, protestations...allowing campaigns to finally see through the fog of the crowd and engage voters one by one.”32 Isn’t that exactly what healthcare needs to do?
Healthcare needs to predict and connect better. Its predictions are usually about which treatments work best for a given diagnosis and what course the treatments will take, including life expectancy (prognosis). But new data outside the usual bounds of available healthcare data, such as claims and member enrollment, offer new opportunities in predictive modeling. For example, adaptations for healthcare from the banking industry include the Healthcare Improvement Capability Score (HICS) on how patients respond and contribute to prevention and treatment through their own behaviors, social assets, and attitudes. Predictive modeling in this way can engage patients one by one by knowing how they are likely to respond and what messages are best for them. For example, an older woman, like my mother, who has a specific pattern of visits to her doctor, an amalgam of conditions, certain behavior patterns within healthcare and outside it, certain social assets, and her own attitudes and motivations, would respond to specific messages and treatments and not to others. Healthcare can certainly predict how “she will vote” about her health.
Another example of using personal data outside the normal purview of healthcare, derived from politics, is convincing the “fence sitters” to become a part of the healthcare system. These are people who do not engage the healthcare system or get in too late, and suffer consequences of illnesses that might have been prevented or treated earlier. They need to be known and proactively courted, just as in politics. But finding them might not simply be a function of currently available data. Predictive modeling using a more comprehensive data set might discover the characteristics of this microsegment and lead to targeting campaigns to “bring them in.”
Another example of using personal data is the prediction of the likelihood of obesity. Obesity is an overwhelming epidemic in the U.S. Medical treatment is difficult because it involves much more than illness care. It requires behavioral change and social supports outside the medical boundaries, including availability of nutritious foods, transportation, and more. It is preferable to get people into the healthcare system before illness onset by identifying the likelihood of obesity. The most important indicator of obesity is the body mass index (BMI). It is very simple to calculate and requires just two pieces of data: height and weight. Yet health plans do not collect this information routinely. Claims data do not include it. EHR data might include it and it might be extractable. But the easiest way to get the data is to buy it. And it is available from third-party data aggregators.
These are just a few examples of the potential applications for new forms of personal data that are readily available in the marketplace. The use of these data is governed by privacy laws and ethical standards. My view throughout this book is that these data can be used to engage people more in their healthcare and thereby make them better. I do not endorse the use of the data to improve the business at the expense of the patient.
The use of personal data is not as prevalent in healthcare as in retail or politics. Part of this is due to HIPPA laws on the protection of personal data in healthcare. Part of it is the industry not looking over the fence to what other industries are doing. Part of it is also the medical mind-set of what data are important and what are not.
New Data: Democratization
This time around everyone finally appears to understand that real relationships with voters are what drive volunteer engagement in campaigns.
—Strata Conference, Get the (Data) Vote Out, June 20, 2012
An important aspect of data democratization that materialized in the 2012 political campaigns is the power over the data. It has to do with who owns it and how it’s used. It’s about “open data” and making it available for all to see and use without much filtering or top-down directions. It empowers campaign workers to make their own choices. It facilitates “stake building” that “turns people who are casually interested in a candidate into door-knockers and repeat donors.”33
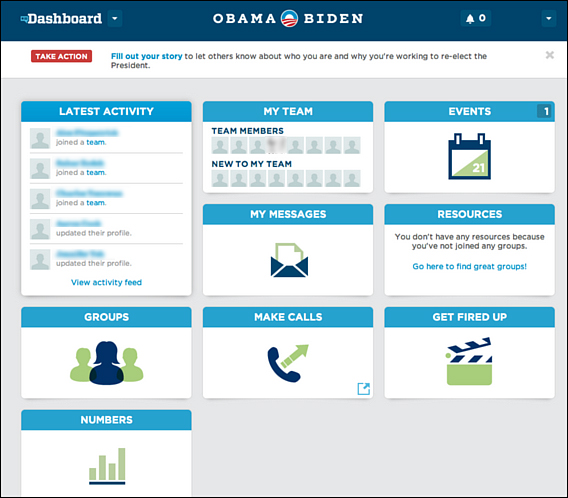
A good example of this is the Obama Campaign Dashboard (Figure 4.6 shows a screen shot of the author’s dashboard). This was an amazing decision support system for campaign workers. It includes the workers’ performance metrics on how they are contributing to the campaign. It provides resources to do their job better, including telephone numbers of undecided voters to call, contact information of other campaign workers, and ways to facilitate fundraising. And it helps keep the spirit and momentum with workers through “get fired up” motivational videos. It communicates the latest about the campaign. And it is fun and engaging.
Source: Obama Presidential Campaign, 2012. Reprinted with permission from the Obama Campaign.
Figure 4.6 Obama Campaign Dashboard.
This availability of data through this state-of-the-art business intelligence application “turns the keys over to the field workers”34 to enable them to create their own blog, create a fundraising page, or organize house parties or online groups. The results of all the points of engagement are stored in the data warehouse to reinforce a cycle of building information about people’s level of interest and activity.
This approach was very successful because it recognized the realities of the workforce for political campaigns. It is composed mostly of underpaid and voluntary workers who believe in the cause and the candidate and pound the pavement to get out the vote. The need to inspire, motivate, and keep up the momentum with these workers such that they were effective with voters was very important. The get-out-the-vote success of the Obama campaign, fueled by data and democratized through its deployment, was a major contributor to winning the election.
In healthcare, there is the obvious need to bring all relevant information about a patient to the desktop of the treating clinician and to do this with compelling clinical decision support features. There is also the need for patients to be much more engaged in the health and healthcare process. A patient dashboard would help. The dashboard would include all relevant data, tools, motivational materials, and decision frameworks. This is not a personal health record or a clinical portal that is often just a depository of clinical facts. It is an action-oriented personal dashboard that includes “my information” and “my journey plans.” It is integrated with doctors, insurers, and other caregivers. The most obvious difference between it and EHRs or HIEs is that it is oriented toward people/patients. It is on their terms. It has the express purpose of establishing them as a contributing member of the team.
Another aspect of data democratization is to turn the keys over to people in terms of the types of data they chose to share/provide and the ways they do it. Social media is a major communications transformation for political campaigns. It is an important tool for campaigns to locate and woo supporters and to gather data from them. For voters it is a platform to receive and send information to peers that can advocate or denounce a candidate. The ubiquity and centrality of mobile devices like smartphones complements social media such that the combination might be the dominant communications preference for campaigns going forward.
Two emerging opportunities with social media include sentiment analysis and network power.
Sentiment analysis is a key analytic method for social media. It is a set of methods that detect, measure, report, and exploit attitudes, opinions, and emotions in online, social, and enterprise information sources. It gives explanations about data and associated behaviors picked up in transaction records.
In political campaigns, one can measure sentiment by looking at the number of tweets or likes, as well as whether they are positive or negative.
USA Today partnered with Twitter, Topsy (a data analytic group), The Mellman Group, and Northstar Opinion Research to publish a Twitter “election meter” that tracked the favorability sentiment expressed by Twitter users for President Obama and Mitt Romney, on a scale from 0 to 100 (with 100 being the most positive).35 For example, on August 27, 2012, the index for the 12 swing states showed a favorability score of 21 for Obama and 41 for Romney. The trend over time is probably more important than the absolute numbers. However, the meter did not correspond with multiple polls that showed Obama ahead in the swing states. One limitation might be that the Tweeters are not representative of the general population, and it is difficult to attribute geography to a Tweet. So it is too early to interpret the predictive power of voter sentiment. It is worth noting that Newt Gingrich had a great positive sentiment index at 84% but lost support among voters and bowed out of the race.
The second opportunity that social media brings to politics is to facilitate political action outside the usual boundaries of campaigns by strengthening individuals’ network power. As we have seen, politicians’ campaigns might have far more information about voters than voters have about them. In the future, those people who create voter networks of size and significance might have more bargaining power with political candidates than their checkbooks ever could. For example, the amassing of swayed voters could be used as political capital. This use of social media technology might actually transform the playing field such that large contributions are not all that matters and that networks of relationships of trust are what can be counted on to bring influence to politics. For example, the power of networks is understood when one considers that Facebook users have an average of about 400 connections and 50 voters in their network.
In healthcare, social media can extend the truly unique aspect of analytics as developed more fully in political campaigns. As discussed earlier, the special feature of polling is in getting data directly from people and engaging them through the process by participating in the big race on who will be president. We discussed how polling can be applied in healthcare for a moon race for improving well-being and thereby increasing peoples’ stake in improving their health and the healthcare for all. But there is one caveat: People might not respond to questions generated in a top-down way.
People comfortable with social media are breaking away from standard ways of giving feedback. For example, rather than responding to a satisfaction survey from the Hilton Hotel, some people prefer to get and give feedback on neutral sites. These sites, like TripAdvisor, provide standard ratings on hotels and restaurants, include star ratings, and perhaps most important, offer qualitative comments from travelers who have been there. These sites are considered more trustworthy, and there is an emerging philosophy that people are taking care of one another with helpful information. (It is also interesting to note that every negative entry this writer has made about a hotel or restaurant has been followed up by the restaurant, which speaks to the power of negative comments affecting other customers and maybe even going viral.) An analogous “HealthAdvisor site” would facilitate the generation of helpful information about the quality and satisfaction of healthcare providers.
People do not necessarily need a structured site like HealthAdvisor to spread comments. Facebook and Twitter are used to inform friends, families, and colleagues about the good, bad, and ugly in their lives. These networks can be very large and can create an epidemic of good or bad will. So it is important to healthcare providers and health plans to learn from the conversations about them, to induce dialogues, and to manage the buzz. What is unusual is that the content is uncontrollable and unstructured. Hence, monitoring sentiment and comments on social media sites is important.
Conclusions
Politics as exemplified by the U.S. presidential campaign of 2012 is the ultimate showcasing of the extraordinary contributions of analytics to the success of an industry. By all accounts, the election was won due to the data-driven execution of the Obama campaign. Analytics contributed to the overall strategies and all the tactics that supported them. The analytics sweet spots include polling, predictive analytics, and data democratization. The potential adaptations for healthcare are profound. On the one hand, polling is an antidote to the relatively blind pursuits of covert big data. It engages the minds of people directly and lays the potential to involve them in the pursuit of their own better health and that of other citizens through better-informed policies. Predictive analytics demonstrated the amazing power of the method to be accurate within a few electoral votes many months before the actual votes were cast, raising the question of whether the voting process is anachronistic. Finally, the influence of social media and mobile, continuing to emerge in politics, lays the foundation for more responsive ways for people to influence politics through the power of networks and to redefine who controls the flow of information and the types of information of most interest to voters and patients.