
11. Human Resource Analytics
Aims and objectives of the chapter
• Discuss human resource analytics
• Establish the need for HR effectiveness metrics
• Discuss the effectiveness of benchmarking HR Metrics
• Consider HR effectiveness metrics with regard to internal efficiency and effectiveness
• Discuss internal HR operational metrics
• Examine total compensation effectiveness metrics
• Discuss the span of control management effectiveness metric
• Discuss how perceptions about HR effectiveness metrics have changed
More than ever before, the human resource (HR) function is being challenged by senior business executives, such as chief executive officers (CEOs), chief operating officers (COOs), and chief financial officers (CFOs), to demonstrate the value of the human capital employed and the value of the HR function using the language of business: accounting. Business success in general is measured, evaluated, and scrutinized using concrete numbers, as in dollars and cents. Why not demand from the HR function the same analytical rigor?
The emphasis on valuing, evaluating, and measuring HR investments stems from the fact that management throughout the world clearly recognize that the effectiveness of their HR assets can be a major competitive advantage. The effectiveness of human resources (the employees) can be the main contributing factor in becoming a successful organization. Therefore, business leaders have said that managing their human resources is their most important responsibility.
The Background for the Use of HR Analytics
An organization’s financial effectiveness is evaluated through the use of financial ratios. The discipline of using financial ratios is a key tool in the evaluation of the financial success or failure of any business (both for-profit and nonprofit organizations). Financial ratios are also used to value a business (its assets and liabilities). Various stakeholders, both internal and external, use financial ratios to judge organizational performance. The stakeholders can be investors, stock analysts, business valuation specialists, investment bankers, internal management, government regulators, and many others. In other words, financial ratios are integral to managing and evaluating a business or even a nonprofit organization. The discipline of financial metric analysis and evaluation by using financial ratios has widespread usage.
The use of quantitative metrics is common, except for the HR function. The utilization of metrics and reporting on them for human resources is lagging. In comparison, metrics drive performance in other business functions such as sales, finance, operations, supply chain management, and marketing. As organizational resources become scarce, all staff functions (information technology, research and development, and human resources) are also being scrutinized as to their abilities to add value. The efforts expended by these functions toward the achievement of organizational objectives are being questioned.
A lack of data and appropriate information systems that might otherwise facilitate the collection and reporting of HR analytics and metrics often hamper HR personnel. This lack of effective and relevant data has prevented the HR department from “coming to the table.” Whatever data the HR function can collect and report is out of sync with the information and data structures of the entire organization. Therefore, the HR function is often not regarded as a strategic function. Instead, the HR function is regarded as a purely operational and administrative function.
The data the HR function usually develops and disseminates is mainly tactical and operational. Examples include performance appraisals, healthcare costs per employee, turnover rates, absentee rates, cost per hire, workers’ compensation costs, to name a few.
The Need for HR Analytics
HR metric systems are needed for two main reasons. The first is the evaluation of the effectiveness of the actual investments made in human capital. The second is the evaluation of the HR function itself. This chapter first covers the issues of measuring the effectiveness of human capital investments. The focus then turns to measuring the effectiveness of the HR function. The chapter closes with a discussion about compensation and benefit program metrics.
There is a need to use quantifiable metrics and financial ratios to determine the value of the two dimensions mentioned in the preceding paragraph. There is a need to use human capital management analytics.
In recent years, this topic has elicited a great deal of conversation. It has been discussed widely, in seminars, conferences, journal articles, books, and on the Internet. The use of HR metrics is not a new phenomenon. Discussion on this topic has continued steadily from the 1960s.
Early approaches centered on auditing the HR function. Then in the 1970s and 1980s, more value-added approaches started being utilized. Competitive HR benchmarking, HR satisfaction surveys, and HR cost monitoring and HR key indicators started being discussed and used.
Although the concepts were being discussed, the actual usage was found in only a few companies in the 1960s and 1970s. But since the mid-1980s, the discussion about HR metrics has become more intense. We also see a wider use and increased sophistication of the concepts. Concepts such as return on investment (ROI), evaluation of the HR departments as a profit center, balanced scorecards, and human capital metrics are now in the forefront of HR thinking.
Therefore, more and more HR professionals will be challenged to show the value of the investments in human capital assets quantitatively. The challenge will also be to show the ROI for human capital initiatives.
Measuring the Effectiveness of HR Investments
HR professionals will add value by not only deciding what to measure but also by deciding how to interpret the data and compare the data to benchmarks within industry segments. In addition, HR professionals need to focus on improving the methodology for securing the type of information the organization needs to achieve its overall goals. The concept being advocated here is that HR professionals should look at improving their metric data systems from being just tactical and operational to being integrated with the strategic organizational data system that is used for overall financial performance evaluation. This involves tying HR metrics with key financial success factors that are normally used to measure business or organizational success.
Conceptual connections between HR plans, programs, and activities and business performance need to be understood and developed, as has been demonstrated in Chapter 2. And HR metrics are needed that capture the impact of HR investments on business performance. This chapter describes some of these connected metrics. Let’s first look at metrics that lend themselves to effective industry benchmarking, and then consider various HR value indicators.
Benchmarking HR Effectiveness Metrics
Benchmarking is the process of comparing an organization’s processes and related performance metrics, first to the standards within the same industry group and then with the standards across all industry groups. Also market intelligence and competitive intelligence—comparing to direct competitors and the industry—is a common practice in benchmarking. In the financial area, organizations compare financial performance with those of others in the same industry group and then across all industries.
HR professionals should use benchmarking, and if they already are, they should enhance the analytical rigor in their benchmarking efforts. The analytical rigor should be commensurate with that used by accounting, investment, and finance professionals. Metrics that you can use for benchmark comparisons include the following:
• Revenue per employee: A company’s sales in relation to the number of employees they have. This is an overall measure of an organization’s employee productivity.
• Profit per employee: A precisely defined metric using earnings before interest, taxes, depreciation, and amortization (EBITDA) in the numerator.
• Number of employees per HR staff: A very useful HR department effectiveness measure. In the past, the industry average for this ratio was 100 employees to 1 HR staff member. Actual practice varied. In recent times, with the advent of HR department automation, a good target for this ratio is approximately 80 employees to 1 HR staff.
• Total HR department expenses versus total operating expense: A measure of the operational efficiency of an organization’s HR department.
• Training investments: A measure of the total training dollars divided by total headcount.
• Total compensation: A measure of total compensation as a percentage of net income before taxes.
• Internal placement: A measure of the percent of management positions filled internally.
• Employee benefits costs: A measure of employee benefit costs as a percentage of total payroll cost.
Supporting the benchmarking contention, Dr. Jac Fitz-enz, a leading proponent of HR metrics and the founder of Saratoga Institute,1 has often suggested that HR metrics should look toward integrating the metrics with the entire organizational metric system instead of just focusing on internal HR department metrics.
1 Saratoga Institute was sold to PricewaterhouseCoopers, and this service is now part of PwC’s Human Capital Consulting Services.
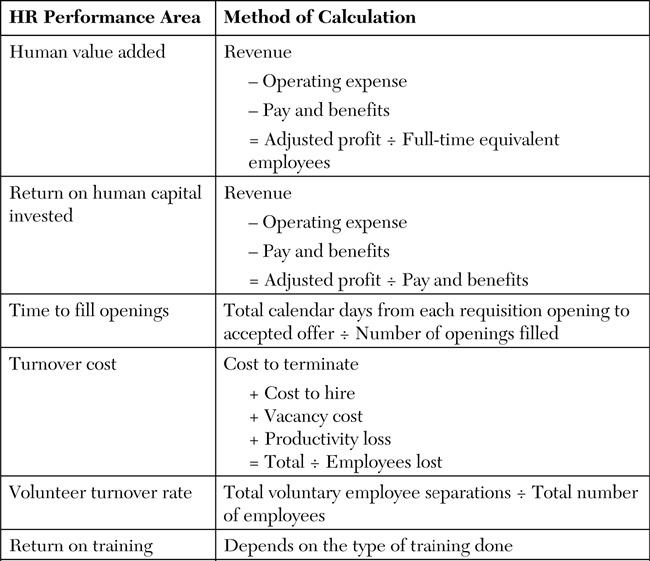
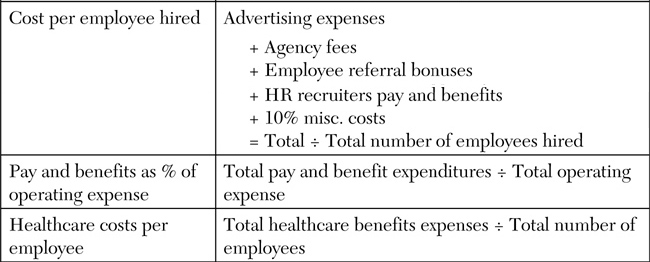
Exhibit 11-1 is adapted from an article Dr. Fitz-enz wrote for HR Focus magazine. It gives a sample of metrics recommended by Dr. Fitz-enz. Dr. Fitz-enz endorses the concept of benchmarking the metrics.
Exhibit 11-1. HR Business Performance Metrics Suitable for Benchmarking2
2 Source: Adapted from Jac Fitz-Enz, “Top 10 Calculations for Your HRIS,” HR Focus, April 1998, p. S-3.
We have thus far discussed metrics appropriate for external benchmarking; after all, much has been written about developing outward-looking metrics appropriate for benchmarking. But there is another reason HR analytics are necessary: to measure HR effectiveness, not just for benchmarking purposes but also for the optimization of human resources and HR management. In other words, although it is necessary to develop metrics for external comparisons, it is also vital to use HR metrics to effectively and efficiently manage human resources internally. So, organizations need to develop a comprehensive HR metric structure for both external comparisons and for internal management use.
What follows is a comprehensive review of all HR effectiveness metrics that are appropriate for both internal and external purposes. Notice that some of these metrics are also listed as benchmarking metrics (for external comparisons). Also within this category of HR effectiveness metrics one can include those that evaluate HR department efficiencies.
Human Capital Effectiveness Metrics
As previously mentioned, HR effectiveness metrics are those measures that are used to evaluate the overall organizational human resource effectiveness. In other words, they are an evaluation of the effectiveness of an organization’s human capital investments. These metrics include the following:
• Revenue per employee (revenue factor): Also used in benchmarking.
• Expense factor: Current literature on HR effectiveness advocates the use of total operating expenses dividing by the total headcount. A better measure for the expense factor might be total HR-related expenses (as discussed in previous chapters) divided by the total headcount. Of course, total HR-related expenses are not aggregated in Generally Accepted Accounting Principles (GAAP)-based accounting consolidations. HR departments, by analyzing journal entries and ledger accounts, can calculate the aggregate total HR-related expenses.
• Profit per employee: This is an income factor. For this metric, many hold that the total operating income should be used. However, total operating income can mean many things. Total operating income can be gross profit, or net cash operating income (net income adjusted for noncash items), or net operating income after taxes (NOPAT), or net income before taxes (that is, earnings before interest and taxes [EBIT]), or earnings before interest, taxes, depreciation, and amortization (EBITDA). Clearly for a financial metric to evaluate HR effectiveness, one needs to select a metric that correlates directly with the efforts of the human resources of the company. Therefore, the most effective profit metric that correlates clearly with the organization’s HR efforts is EBITDA, because this measure excludes the extraneous accounting and tax-related issues. Profit per employee is also an appropriate external benchmarking factor.
A case can be made, though, that discounted free cash flow, a true metric of the intrinsic value of a company, should be used. Therefore, another effective metric of HR effectiveness is discounted free cash flow divided by the total headcount. And for that matter, organizations can use any metric of economic value added as an HR effectiveness indicator.
The next metric category (turnover rate) can be used to evaluate human asset retention and depletion. These effectiveness metrics have been around for a while. But with the new emphasis on the value of human resources as a core facilitator of organizational value, they are now looked at in a new light.
• Turnover rate: The number of employees terminating per 100 employees employed within a given time period. It can be broken into two components: voluntary turnover rate and involuntary turnover rate. Some organizations add the two types of turnover and calculate a total turnover rate per 100 employees.
Note that the metrics described so far are just descriptive statistics. Unless you convert these statistics to a normative model or a predictive model, they might not be of much value. Normative and predictive models not only analyze the present but also suggest different alternatives for future action using a standard decision criterion.
Organizations can build a model to predict voluntary employee turnover. The first step in this model is to hypothesize, based on exit interviews, the possible causes of voluntary turnover. When the appropriate sets of causes are conceptually agreed to, a correlation matrix can be developed with voluntary turnover rates and data on causes from the exit interviews. The data on causes can be derived from the use of a semantic differential scale (a type of scale that is designed to measure the connotative meaning of concepts, which are meant to capture attitudes). Of course, the semantic differential scale needs to be built into the exit interview questionnaire. This resulting correlation matrix indicates those hypothesized causes for voluntary turnover that have the largest correlation with the voluntary turnover rate.
The next step in the analysis is to develop a predictive voluntary turnover model, as follows:
Y = a + b x1 + b x2 + b x3 - - - - - b xn
Where Y = Voluntary turnover rate
a = Intercept
b1 – n = Slopes of the independent variables
x1 – n = Reasons and causes or Independent variables
Another important point to consider with regard to the dimensions of HR effectiveness is what element should be the denominator of the ratio calculation. Is total headcount appropriate, or would full-time equivalent (FTE) be a more appropriate metric? PwC–Saratoga Institute advocates the use of FTE in the denominator. The FTE number could be a better data point because nowadays most organizations use a flexible workforce, with a variety of employee working arrangements (full time, job share, part time, temporaries, telecommuters, flexible-schedule employees, and others). No matter the working arrangement the various employees work under, all of them are contributing to the HR effectiveness of the organization.
Internal HR Operational Metrics
Traditional HR management operational metrics focus on the efficiency, quality, and the speed of delivering HR services. To facilitate this type of analysis, statistical models are built to analyze the costs and benefits associated with specific HR activities.
The typical metrics used are as follows:
• HR process cycle time: The cycle time for each HR process, such as selection and staffing, benefit claims administration, and payroll and salary administration. Cycle time refers to the average time required to complete the activity, start to finish.
• The HR service quality: Assessed via the use of internal customer satisfaction surveys.
• HR process costs: The cost of the various HR processes, such as staffing, benefit claims administration, and payroll and salary administration.
• Offer-acceptance ratios: For staffing effectiveness.
• Training evaluation: Also called the development rate. It is calculated as the number of employees trained divided by total headcount (that is, access to training).
• Training costs: The average dollar amount spent for training an employee. Training efficiency requires that this factor should show a declining rate with the passage of time. The training cost factor is calculated by using the average training dollar and dividing it by the number of employees trained.
Total Compensation Effectiveness Metrics
Total compensation and benefit effectiveness metrics represent the final category of HR effectiveness metrics.
Some researchers contend that the value of human capital is best measured by using compensation data. Compensation data is the proxy value of human capital. Compensation is a monetary metric, and so it can be used as a value metric. Within this context, some of the metrics of compensation and benefit effectiveness that can be applied to the valuation of human capital are as follows:
• Compensation to revenue ratio factor
• Compensation to total expense ratio factor
• Executive compensation to the number of executives ratio factor
• Span of control factor (a managerial effectiveness indicator)
Compensation to revenue factor is a metric of total compensation costs as a ratio of total revenue. Improving organizational efficiencies should reduce this ratio over time. It is undesirable to see compensation expenses growing at a higher rate than the revenue growth rate. Many consider this ratio a valid employee-productivity metric.
Compensation to total expense factor is also an employee-productivity metric. Because of improving organizational efficiencies, this metric should show a downward trend over time. Many consider this to be a valid HR effectiveness metric. It is calculated by dividing total compensation expenses by total expenses. Note that total expenses in accounting terminology include both the cost of goods sold and the period expenses. Therefore, all income statement expenses are used as the denominator.
Total compensation expenses include all elements of compensation as described in this book
• Base salary
• Incentives
• Employee benefits
• Executive compensation
• Sales compensation
• Expatriate and international compensation
• Equity compensation
• All pay adders, such as overtime pay
Executive compensation expenses to the number of executives factor has gained importance as a metric because of the recent public outcry about excessive executive compensation paid to a handful of executives. For this metric, total compensation paid to vice presidents and above is divided by the number of executives. This metric can readily be used to compare with the ratios of comparable organizations. Another ratio used to determine the relationship of executive compensation to the pay of the total employee population is the ratio of senior executives’ total compensation as a ratio of the lowest-paid employee. The ratio establishes a reasonableness of executive pay indicator. A modified version of the ratio is the total compensation of the top ten executives as a ratio of the bottom ten executives.
The United States often ranks number one (for unreasonableness) when calculations are made using this ratio. In 2010, for instance, CEO pay in the United States was 325 times that of the average worker pay, according to the annual Executive Excess survey published by the Institute for Policy Studies, a Washington, D.C.-based research group critical of high executive pay. According to a February 2007 Heritage Institute summary of various survey data, the multiple has increased from about 24 in 1965 to 262 in 2005.
In an August 2008 article,3 Graef Crystal, a renowned executive compensation consultant, indicated that the larger the company in sales size, the larger the differential between CEO and average worker pay. For the denominator, he used the 2007 Bureau of Labor Statistics average American worker annualized pay of $36,100. For the numerator, he used the pay of CEOs of very large companies. For the company with the highest sales rank, the differential was 525; for the company with the lowest sales rank, the ratio was 162.
3 Found on the Internet: www.Graefcrystal.com/images/CEO_worker_pay_ratios_web_7_1_.08.pdf.
Executive compensation surveys also provide industry average data on the various executive compensation elements. For example, an examination of executive compensation might indicate that perquisites make up only 5% of the average of the total executive compensation package, or that the annual incentive compensation is 50% of total cash compensation.
Span of control factor is a management effectiveness metric. Common practice suggests that there is an optimum number of employees that one manager or supervisor can manage. With corporate delayering initiatives, this number has been increasing in recent years. In the past, an optimum number of employees supervised by a single manager or supervisor was approximately 6 employees. Nowadays, this ratio has gone up to 10 or 12 employees. The logic of this change is (1) the increasing use of automation and information technology, (2) enlightened management practices, (3) improving worker skills, and (4) the need to manage costs.
Another dimension of the span of control ratio is total managerial compensation dollars divided by the number of managers. This is the average total compensation for the management employee group. This metric can also be compared with other comparable companies.
Other effectiveness metrics used by compensation professionals to evaluate compensation programs include the following:
• Average performance rating: Average performance rating is the sum of performance ratings divided by the number of employees.
• Average merit increase: Average merit increase is the sum of all merit increases granted divided by the number of employees.
• Grade creep: Grade creep or inflation is the number and percentage of employees in each grade from one year to the next.
• Compa-ratio: Compa-ratio is the average salary divided by the midpoint within each grade, pay program, job family, and in the company as a whole.
• Market index: Market index is the average salary divided by the job or position’s market average salary.
• Actual incentive compensation payout as a percentage of target payout: Incentive payout percentage is the actual average incentive compensation payout divided by the target incentive payout. This metric can be calculated in total dollars or by using the average actual payout and the average target payout.
• Change in incentive compensation payout as a percentage of the change in net income: Incentive payout effectiveness is a metric that evaluates the alignment of incentive compensation paid out versus net income. In recent times, especially in executive compensation, the increases in incentive compensation payouts have been higher than the growth in net income. In public companies, compensation committees of the board of directors are charged with the fiduciary responsibility to monitor and attest to the reasonableness of executive compensation. The compensation committees should ask to regularly see a presentation of these metrics to monitor the reasonableness of executive compensation.
A Changed Paradigm
Most often, a company’s compensation staff focuses on objectives from one angle only: competitiveness. Compensation professionals consider their job is primarily to ensure that pay packages are externally competitive. Questions commonly addressed by the compensation staff center involve the following:
• Are salaries commensurate with the averages in the relevant market?
• Are the company’s programs similar in features to that of our competitors?
• What is the company’s ability to pay? What can we afford to pay?
These are appropriate questions. But human resources employed by an organization are primarily responsible for increasing revenue and the value derived by various stakeholders. The human resources in an organization drive the top line and the bottom line. They are responsible for creating new products, making the products, selling the products, and maintaining customer satisfaction.
Therefore, in analyzing HR effectiveness ratios, focus needs to be placed both on the numerator and the denominator of the ratio.
In other words, compensation professionals should focus on not only the supply side (of human resources) of the equation but also pay attention to the demand side.
The supply side has traditionally received the most attention. On the supply side, compensation and benefit professionals design programs to attract and retain the numbers and types of employees an organization needs.
The demand side considers what employees need from their compensation programs and which types of compensation plans and programs create the highest satisfaction levels for the employees. By focusing on the demand side, organizations can motivate employees to enhance productivity and improve the top line. Various consulting companies have developed and marketed programs that assist clients to design programs that address both the supply side and the demand side. These programs often encourage employee input into the compensation design process. The demand side focuses on employee performance.
Key Concepts in This Chapter
• The need for HR analytics
• Measuring the effectiveness of HR investments
• Benchmarking HR effectiveness metrics
• HR effectiveness metrics
• Revenue per employee
• Profit per employee
• Training investments
• Total compensation costs
• Internal placement effectiveness
• Employee benefit costs
• Expense factor
• Turnover rates
• Internal HR operational metrics
• Training evaluation
• Training cost factor
• Total compensation effectiveness metrics
• Span of control
• Compensation program effectiveness metrics