
Chapter 5. Employee Health, Wellness, and Welfare
We often think of vital human capital decisions being made by business leaders and their HR colleagues, but some of the most important talent decisions in every organization are made by employees themselves. Employee decisions that affect their health and wellness have profound effects that are often overlooked. This chapter shows how to capture and evaluate these effects.
In 2009, Steve Burd, CEO of the U.S. supermarket chain Safeway, took eight trips to speak to U.S. politicians about reforming the health-care system. Safeway’s health-care costs had been rising 10 percent per year for several years prior to 2004, but since then the company had kept health-care costs flat, compared to a 40 percent average increase in U.S. companies. How did Safeway do it? The company fully pays for an array of preventative visits and tests, but employees pay in full the next $1,000 in expenses and 20% of costs after that, up to a $4,000 maximum. Noting that 75 percent of health-care costs result from four conditions (cardiovascular disease, cancer, diabetes, and obesity), Safeway has a voluntary program that tests employees for smoking, weight, blood pressure, and cholesterol. Every area they pass results in a reduction in their insurance premiums of up to $1,560 per family per year.1
According to the Centers for Disease Control (CDC), “chronic diseases account for more than 75 percent of the nation’s $2 trillion medical care costs.”2 Behavior determines approximately 50 percent of health status, and genetics and environment determine another 20 percent each. Access to care accounts for the remaining 10 percent.3
This chapter deals with the economic impacts of employee lifestyle choices on health-care costs, the return on investment of worksite health-promotion programs, and the costs and benefits of employee assistance programs. Our objective is not to describe the structure, content, or operational features of such programs, but rather to present methods for estimating their economic impact on an organization. To provide some background on this issue, let’s begin by considering the relationship of unhealthy lifestyles to health-care costs. Following that, to provide some perspective on firm-level decisions about health-care expenditures, we present a logical framework that illustrates how changes in employee health affect financial outcomes.
Health, Wellness, and Worksite Health Promotion
It is important to note that the concept of health includes more than just the absence of illness. Wellness represents the balance of physical, emotional, social, spiritual, and intellectual health.4 A 2009 Towers-Watson study found that companies that perform best in controlling health-care costs more often take these actions:5
• Clearly articulate their strategies: Fully 84 percent of high performers use results measures to build action plans for performance improvement, versus 43 percent of low performers.
• Engage leaders: The vast majority of high performers (86 percent) have secured senior management involvement, which is a critical performance factor (compared to 57 percent of low performers).
• Understand their employee populations: Three-quarters of high performers measure employee health status and risks by population segment (compared to 46 percent of low performers).
• Engage employees: Most high performers (65 percent) provide health-care communications, employee education, and access to health information year-round (compared to only 34 percent of low performers).
• Optimize investments: Fully 80 percent of high performers take steps to align subsidies and resources with employees’ most significant needs (compared to only 29 percent of low performers).
• Support employee health: Seventy-four percent of high performers actively help employees understand and manage their health and health risks (compared to only 22 percent of low performers).
• Measure for success: The majority of high performers measure such critical success factors as employees’ understanding and use of resources and tools (81 percent of high performers versus 47 percent of low performers), as well as employee attitudes and understanding of their benefit programs (82 percent of high performers versus 53 percent of low performers).
The potential relationships between employee health and organizational productivity are obvious, but the issue is particularly significant in the United States, where health care is largely paid for by corporations and individuals instead of being provided more universally by the government. Even in the United States, organizations did not begin to seriously address the issue of health-care cost containment until a substantial increase in health-care costs forced them to look for savings. How large of a run-up? From 2000 through 2005, U.S. employers hiked workers’ annual contributions for family health coverage by 68 percent, from an average of $1,600 to $2,700.6 A 2009 Kaiser Family Foundation study found that 22 percent of workers now pay deductibles of more than $1,000, up from 10 percent in 2006. Premiums for employer-sponsored health insurance rose 5 percent in 2009 to $13,375 for a family, more than doubling from $5,791 ten years ago.7
Rising health-care costs often translate into less disposable income for employees because wage increases have not kept pace with rising employee health-care contributions. Higher insurance premiums can also cut into disposable income. In 2010, the U.S. Department of Health and Human Services chided health insurance companies for “massive increases” such as the 39 percent premium increase for individual plans from one company in California.8 To illustrate, average out-of-pocket medical costs for employees more than doubled between 2000 and 2005, with wages growing only 18 percent.9 Employers may offset increased health-care costs by holding down wages.10 Even with such cost shifting, health-related employer costs have risen dramatically. Moreover, no matter who bears the cost, opportunities to reduce such costs can benefit both employers and employees.
Two Broad Strategies to Control Health-Care Costs
To help control spiraling medical costs, organizations can pursue one or both of two broad tactics:
• Improve workers’ health habits
• Reduce employer payments for employee health insurance or health care
Unfortunately, evidence indicates that employees who are most at risk often find it most difficult to change to healthier lifestyles, so the first strategy can be difficult. Employers can use economic incentives to motivate employees. A combination of the two approaches links employee lifestyle choices to their personal health insurance or medical-care costs. Rockford Products Corp., which makes metal parts used in items from Caterpillar earthmovers to yo-yos, combed through 15 years of records and found that 31 of 32 workers who had heart attacks or required major heart surgery—including 2 who keeled over in the factory—were smokers.11 Pitney Bowes, Inc., used statistical modeling to identify future high-cost health claims caused by failure to adhere to prescribed medication. The company modified its pharmacy benefit structure to make such medications affordable. For example, the company moved statins used to treat high cholesterol and angiotensin-converting enzyme (ACE) inhibitors for treating high blood pressure to a zero-copay tier, making these drugs free of charge. “We see fewer emergency room visits, and we also see people being able to come to work and be more productive,” says Andrew Gold, executive director of global benefits planning. “That creates an overall benefit to the company and to employees.”12
Wellness programs therefore hold considerable promise as a strategy to reduce those costs. Support for such programs is growing, as a Wall Street Journal/Harris poll found.13 More than half of all adults surveyed (53 percent) said it would be fair to ask people with unhealthy lifestyles to pay higher insurance premiums than people with healthy lifestyles, whereas 32 percent said it would be unfair. When asked the same question in 2003, 37 percent said it would be fair, whereas 45 percent said it would be unfair. The American Institute for Preventive Medicine estimates that 62 percent of employers have some type of health-improvement program in place.14
Of course, health and wellness investments can also translate into savings for companies. The 2010 Towers-Watson survey found that the high-performing companies had a health-care cost of $9,240 per employee per year, compared to $11,244 for low-performing companies. Although 35 percent of low performers reported double-digit cost increases in the prior year, 33 percent of high performers kept their cost increases below 4 percent. Even more interesting is that the cost reductions were not simply achieved by passing along costs to employees. The annual employee contribution in high-performing companies was $2,028, compared to $2,496 in low-performing companies.15 As noted in Chapter 3, “The Hidden Costs of Absenteeism,” research suggests that for every $1 spent on direct pharmacy costs, an organization incurs $2.30 in health-related productivity costs.
As lucrative as these returns can be, not all investments in employee health are appropriate for all companies, and they don’t work equally well in all situations or for all employee groups. How can organizations analyze their options and make choices?
We now turn to the logic that connects investments in employee health and welfare to strategic organizational outcomes.
Simply put, the logic of the costs and benefits of employee health and wellness can be traced through the following logical connections:
• Organizations invest in programs that attract, select, develop, or encourage employees to improve their health at the worksite and in their lifestyles.
• Organizations invest in employee assistance programs to address specific employee health issues.
• Employees respond by adopting healthier lifestyle behaviors both at work and away from work.
• Healthier employees require less treatment for health problems, reducing employer-paid health-care services or group health insurance premiums.
• Healthier employees are available at work more often because they are absent less (due to both personal health and family health issues), and they separate less frequently.
• Healthier employees perform better at work due to greater physical and mental capacity.
Figure 5-1 shows logical connections between changes in employee health and financial outcomes. The process begins with organizational policies and practices that encourage employees to make healthy lifestyle choices, or with assistance with specific issues such as alcoholism or drug abuse. These might include staffing policies, changes in insurance programs (as those at Pitney Bowes, described previously), programs to educate employees about health-risk factors, health screenings, and opportunities to improve personal fitness. You’re probably wondering, “Okay, but how much can my company expect to gain from these efforts?” One estimate attributes fully 15–25 percent of corporate health-care costs to employees’ unhealthy lifestyles.16
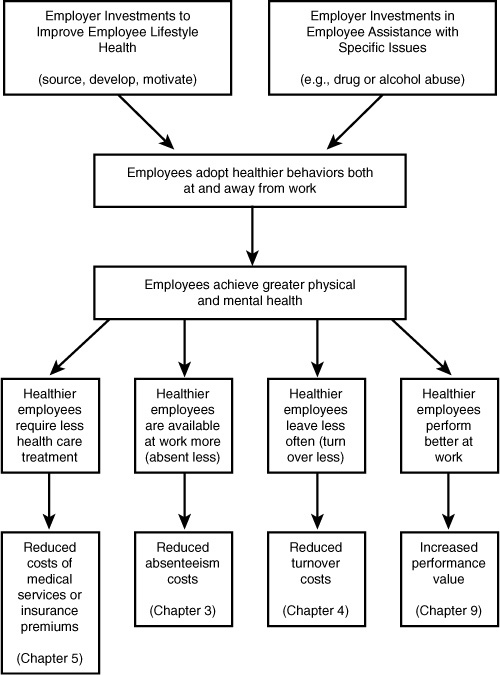
Figure 5-1. Logic of employee health and wellness.
In light of these potential savings, some companies have adopted policies to preempt higher health-care costs by not hiring those with unhealthy lifestyles in the first place. For example, Rockford Products imposes a $50 per month fee on employees who smoke, are obese, or suffer from hypertension.17 Turner Broadcasting won’t hire smokers. Multi-Developers won’t hire anyone who engages in what the company views as high-risk activities: skydiving, piloting a private aircraft, mountain climbing, or motorcycling. Weyco, Inc., an insurance-consulting firm, gave smokers 15 months to quit and offered smoking-cessation programs to help them do so. After that, it tested employees for evidence of nicotine in their bodies. If they failed the test, they were fired.18
Continuing on with the logic of Figure 5-1, if organizational policies and practices are effective, this should lead to changes in the behavior of employees, and, eventually, in the health of employees over time. Improved health may be reflected in outcomes such as higher levels of cardiovascular fitness, weight loss, and lower levels of stress. Those changes, in turn, should lead to changes in behaviors, such as reduced absences, accidents, and employee turnover, accompanied by higher levels of employee productivity. Changes in behavior should be reflected eventually in improved financial outcomes: fewer insurance claims; lower overall medical costs; reductions in the costs of employee absence, accidents, and turnover; and higher sales value of products and services.
As Figure 5-1 suggests, a useful first step in estimating the savings that accrue from a workplace health promotion (WHP) program is to choose which health-related costs are actually reduced. Some firms establish WHP programs with very specific objectives, such as to reduce the rising costs associated with premature births or to realize cost savings through early cancer detection and treatment. Programs with specific objectives make evaluation more straightforward. Unfortunately, however, the great majority of WHP programs are implemented without such specific objectives.
A survey of wellness program objectives for selected Fortune 500 companies showed these top five objectives:
- To promote better health
- To improve cardiovascular fitness
- To reduce coronary risk factors
- To decrease health-care costs
- To improve employee relations19
How might we evaluate objectives 1 and 5? Improvements in objectives 2 and 3 are important, to be sure, but how do they relate specifically to a firm’s health-care costs? Finally, with respect to objective 4, how might we demonstrate the extent to which a reduction in health-care costs was due to a WHP program and how much to other factors?
The 2010 Towers-Watson health-care cost survey revealed measurement practices and intentions shown in Figure 5-2. The measures tend to be closely focused on immediate program usage patterns and employee attitudes toward health management and benefits. Yet the ultimate outcomes of these attitudes and behaviors are not among the most commonly listed measures.
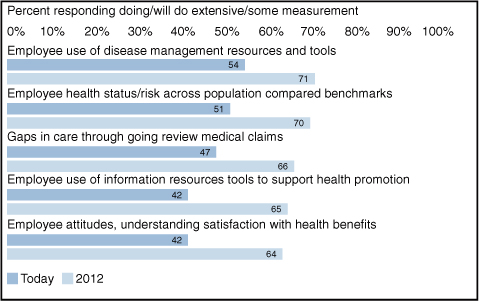
Figure 5-2. Health cost measurement in U.S. companies.
This is not to diminish the good intentions or employment commitment of firms that instituted wellness programs. However, comparing this list of objectives with the logical approach of Figure 5-1 suggests that setting more specific objectives and carefully analyzing the connections can significantly enhance the ability to measure the effects of such programs (and even the effects themselves).
At first glance, it might appear that changing employees’ unhealthy lifestyles is a win-win for employer and employees. However, some practices would reject applicants with certain lifestyles or even dismiss employees for certain behaviors (for example, smoking, skydiving). If an employer wants to institute such policies, can employees contest them? U.S. civil rights laws generally don’t protect individuals against such “lifestyle discrimination” because smokers and skydivers aren’t named as protected classes. In addition, more than half of all states prohibit termination for various types of off-duty conduct (for instance, use of tobacco products). U.S. employers also need to beware of violating the Americans with Disabilities Act (ADA). Obesity, for example, is generally not considered to be a disability under the ADA.20 However, in 2009, the U.S. government implemented the Genetic Information Nondiscrimination Act, which restricts employers’ and health insurers’ ability to collect and disclose genetic information, including family medical history. Some employers say the law stymies wellness-promotion efforts by barring them from offering financial incentives to complete health surveys that ask about family history.21
Companies that market their WHP programs provide statistics to support their claims of savings in health-care costs, but calculating how much any given employer can expect to save is difficult because program sponsors use different methods to measure and report cost-benefit data. When a program’s effects are measured and for how long they are measured are crucial considerations. For example, DuPont found that the greatest drop in absenteeism due to illness occurred in the first two or three years; then it leveled off. Other effects, which might not appear for three years or longer, are so-called lagged effects. The greatest savings should accrue over time because of the chronic nature of many illnesses that WHP programs seek to prevent. However, employers should actually expect to see an increase in health-care claims after initial health assessments are done, as employees remedy newly identified problems.22
In Chapter 1, “Making HR Measurement Strategic,” we noted that analytics relies on rigorous research designs and statistical analyses to draw proper conclusions from data. In Chapter 2, “Analytical Foundations of HR Measurement,” we emphasized the need to use control groups that did not participate in a treatment (for example, education about healthy lifestyles) in the context of an experimental or quasi-experimental research design to rule out alternative explanations for results.
Unfortunately, many companies use no control groups when evaluating their WHP programs. Without a control group of nonparticipating employees, it is difficult to tell how much of the improved health is due to the WHP program and how much is due to popular trends (for example, the general fitness craze), changes in state or local health policies and regulations, and changes in medical insurance. Other potential methodological problems include biases due to self-selection (those at high risk are less likely to participate) and employees who drop out of a program. The resulting evaluations have little internal or external validity because they report results only for employees who voluntarily participate in and complete the program.
Researchers also need to address unit-of-analysis issues. Thus, if data is evaluated across worksites at the level of the individual employee, the effect of a WHP program tends to be overstated because the design ignores within-worksite variation. In practice, substantial differences have been found across different worksites receiving the same intervention.23 Conversely, if the unit of analysis is the plant or worksite, a very large number of sites per intervention is necessary to achieve adequate statistical power to detect effects, if they exist (see Chapter 2 for more on statistical power).
It is advisable to commit to health promotion with a corresponding commitment to data collection. Without data, evaluation is impossible. In the accompanying sidebar, General Motors provides a good example of harnessing analytics and the power of existing data to gain insights into the potential value of workplace health programs.
Measures: Cost Effectiveness, Cost-Benefit, and Return-on-Investment Analysis
Typically, the evaluation of a WHP program relies on some form of cost-effectiveness, cost-benefit, or return-on-investment (ROI) analysis. We discussed these concepts in some detail in Chapter 2, and we apply them here.
Cost-Effectiveness Analysis
Cost-effectiveness (C/E) analysis identifies the cost of producing a unit of effect within a given program. To illustrate, suppose a worksite hypertension-control program incurs an annual cost of $50,000 for a 100-employee population. The average reduction in diastolic blood pressure per treated individual is 8 millimeters of mercury (mm/Hg). The C/E ratio is as follows:
$50,000 / 100 ÷ 8 mm/Hg = $62.50 per mm/Hg reduction
C/E analysis permits comparisons of alternative interventions designed to achieve the same goal. For example, the cost of $62.50 to reduce each mm/Hg achieved by the program could be compared to alternative programs to reduce diastolic blood pressure that are not offered at the worksite. Unfortunately, from a financial perspective, C/E analysis fails to address the issue of whether the program should have been offered in the first place. Cost-benefit analysis overcomes that problem.
Cost-Benefit and Return-on-Investment Analysis
Cost-benefit (C/B) analysis expresses benefits in monetary terms. One of the most popular forms of C/B analysis is ROI analysis (noted in Chapter 2).
Suppose that a WHP program costs a firm $250,000 during its first year of operation. The measured savings are $65,000 from reduced absenteeism, $110,000 from reduced employer health-care payments (assuming a self-funded plan), and $90,000 from reduced employee turnover. The ROI before interest and taxes is calculated as shown in Table 5-1.
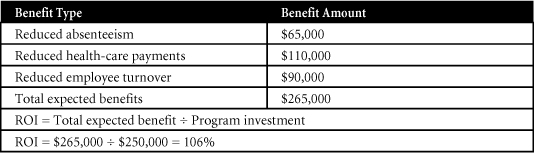
Table 5-1. ROI of WHP Program
The preceding analysis is for a single time period. Data for future time periods (costs and benefits) should be discounted to the present. The numbers provided here are abstract, and firms need to pay careful attention to how they derive them. With respect to absenteeism, for example, savings need to be attributed directly to the WHP program. Employees might take fewer sick days in a given year, and the cost savings from those days not used may be attributed to decreases in employee absenteeism, but how does one know that the savings are due to the WHP program? The same is true for savings attributed to reduced health-care payments or reduced employee turnover. Measures are blind to the logic and rationale behind the numbers. This is where sound analytics and research design play an important role. To attribute changes in any of the outcomes of interest to a WHP program, a combination of methods may be necessary, such as employee survey data combined with focus groups and structured individual interviews.
Although the logic and techniques of C/E and C/B analysis (including ROI) appear straightforward, there are several unresolved issues, as noted in Chapter 2. Much subjectivity is involved in the choice of variables to include in these models, in attributing savings directly to a WHP program, in estimating the timing and duration of program effects, and in discounting the dollar value of costs and benefits that occur in future time periods. Because of this subjectivity, it is important to conduct sensitivity analyses (to examine the impact of variations in assumptions on C/E and C/B ratios) and break-even analysis (see Chapter 2) to identify the minimum levels of dependent variables (such as early cancer detection or savings in absenteeism) that will allow recovery of investments in the WHP program.
Solving the Analysis and Measurement Dilemmas to Improve Decisions about WHP Programs
To summarize, these analytical issues can affect decisions about WHP programs:
- Managers have difficulty identifying the health-related costs that actually decreased.
- Program sponsors use different methods to measure and report costs and benefits.
- Program effects may vary depending on when they are measured (immediate versus lagged effects).
- Program effects may vary depending on how long they are measured.
- Few studies use control groups.
- Potential biases exist as a result of self-selection and exclusion of dropouts.
- Analysis at the level of the individual employee ignores within-site variation. However, analysis at the level of the worksite may produce low statistical power to detect effects.
- Data on effectiveness is limited in the choice of variables, estimation of the economic value of indirect costs and benefits, estimation of the timing and duration of program effects, and estimation of the present values of future benefits.
A sound experimental design is one that allows cause-and-effect relationships to emerge. In this section, we present an evaluation strategy that includes a mix of features that are rarely gathered in actual evaluations but should serve as an ideal toward which organizations should aim. The strategy begins with a determination of the demographics of an organization (age, gender, race, and ethnicity), identification of high-risk employees, expected participation rates, and start-up and maintenance costs required to reach an organization’s goals (such as reducing the incidence and costs of undetected cancerous conditions).
The next step is to develop a testing and tracking system to quantify the outcomes of the WHP program for both participants and nonparticipants. Individuals in these two groups should be matched as closely as possible in terms of characteristics such as gender, age, weight category, and lifestyle variables. Pre- and post-comparisons can be made for both groups in terms of behavioral changes, health-care costs, fitness level, absenteeism, turnover, injury rate and severity, productivity, and job satisfaction. Quantifiable variables (such as health-care costs and absenteeism) must be analyzed separately by demographic or socioeconomic cohort, for both participants and nonparticipants. Regression, path analysis, or meta-analysis can rule out alternative explanations for observed results. Finally, cost-benefit analyses must include present and future benefits, expressed in current dollar values.
Although a growing number of studies report favorable C/E or C/B results, it is difficult to evaluate and compare the studies because no widely accepted approach currently exists for estimating costs and benefits. Different authors use different assumptions in their estimates of WHP intervention costs and dollar benefits, and small changes in assumptions can have large effects on the interpretation of results. Meta-analyses (that is, quantitative cumulations of research results across studies) and single studies that are based on very large sample sizes can deal with many of these methodological difficulties.29 Several such analyses have now been done for WHP programs, as the next section demonstrates.
Process: Communicating Effects to Decision Makers
In communicating the results of WHP programs, it may be helpful to begin by presenting some national-level statistics to serve as benchmarks against which to measure a firm’s employees. Consider four broad categories of such data: chronic conditions, smoking, regular exercise, and lifestyle choices.
Chronic Conditions
A 2007 Milken Institute report, An Unhealthy America,30 analyzed 2003 data (the most recent available) from the Medical Expenditure Panel Survey by the Agency for Healthcare Research and Quality. Their findings included the statement that more than half of all Americans suffer from one or more chronic diseases. Each year millions of people are diagnosed with chronic disease, and millions more die from their condition. Despite dramatic improvements in therapies and treatment, disease rates have risen dramatically. Diabetes has become a new national epidemic, and rapidly rising rates of obesity and cardiovascular disease threaten to cancel the gains we have made over the past decades. The study estimated that the total impact of these diseases on the U.S. economy is $1.3 trillion annually, including productivity losses of $1.1 trillion per year and $277 billion per year spent on treatment.
A 2007 study in the Journal of Occupational and Environmental Medicine found that costs of productivity loss were four times the cost of direct medical costs for a chronic condition.31 This includes the cost of “presenteeism” (see Chapter 3), in which employees are present at work but are producing much less due to poor health or distractions.32
Figure 5-3 shows the estimated cost projections for several chronic conditions through the year 2023.
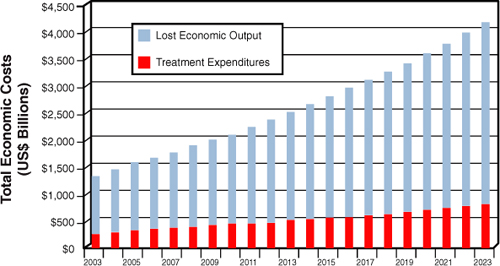
Figure 5-3. Estimated treatment costs and lost economic output due to chronic conditions (2003–2023).
Milken Institute estimated that, with modest reductions in obesity and smoking, 27 percent of these costs might be avoided, amounting to trillions of dollars. Although these percentages may not apply to individual firms, this suggests that opportunities abound for reducing firms’ health-care costs. Employees with chronic diseases such as asthma, diabetes, and congestive heart failure, all of which can be managed, account for 60 percent of the typical employer’s total medical costs.33 One report estimated that 4 percent of employees with serious health conditions account for almost half of their employers’ annual healthcare spending.34
When you have presented this broad information as background, consider presenting a second, more focused set of information that relates more directly to ROI analyses of WHP programs in your own organization.
ROI Analyses of WHP Programs
The return for such programs has been reported at anywhere from $1.81 (Unum Life) to $6.15 (Coors) per dollar invested. Peer-reviewed evaluations and meta-analyses show that ROI is achieved through improved worker health, reduced benefit expense, and enhanced productivity.35 A review of 72 articles concluded that health-promotion programs achieve an average ROI of $3.48 per $1 invested when considering health-care costs alone, $5.82 when considering absenteeism, and $4.30 when both health-care costs and absenteeism are considered.36 In a separate investigation, researchers conducted a 38-month case study of 23,000 participants in Citibank N.A.’s health-management program. They reported that, within a two-year period, Citibank enjoyed an ROI of between $4.56 and $4.73.37 A follow-up study found improvements in the risk profiles of participants, with the high-risk group improving more than the “usual-care” group as a result of more intensive programs.
Worksite health-promotion programs attempt to reduce the health risks of employees at high risk, while maintaining the health status of those at low risk. Using an 18-year data set comprised of 2 million current and former employees, University of Michigan researchers found that increases in costs when groups of employees moved from low risk to high risk were much greater than the decreases in cost when groups moved from high risk to low risk.38 Programs designed to keep healthy people healthy will likely provide the greatest ROI.
In conclusion, when communicating results to decision makers in your firm, we recommend that you begin with some broad statistics on health care, move on to more focused results that relate to WHP, and finish with results from your own firm, rooted in strong inferences based on a research design such as the one shown in the preceding list. Chief financial officers (CFOs) may be a more receptive audience than one might think. Figure 5-4 shows the perceived percentage returns for each dollar spent improving workplace safety, among a sample of 231 corporate financial decision makers. Only 13 percent estimated returns at less than 100 percent, and 68.7 percent estimated returns between 100 percent and 300 percent. These results apply to investments in workplace safety, but they suggest that financial decision makers may be comfortable with estimated returns that are quite high compared to typical investments.
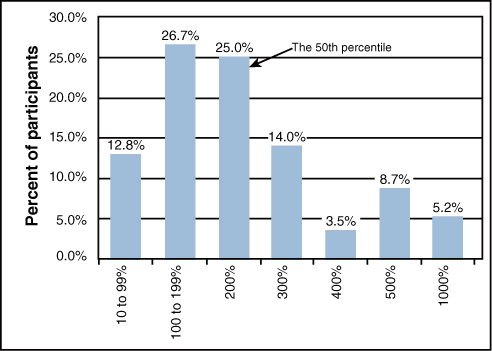
Figure 5-4. Corporate financial officers’ estimated returns to workplace safety investments.
Improving Employee Welfare at Work: Employee Assistance Programs (EAPs)
Whereas WHP programs focus on prevention, employee assistance programs (EAPs) focus on rehabilitation. An EAP is a system that provides confidential, professional care to employees whose job performance is or may become adversely affected by a variety of personal problems. Supervisors are taught to look for symptoms of declining work performance such as the following and then to refer employees to the EAP for professional help: predictable absenteeism patterns (for example, Mondays, Fridays, or days before or after holidays), unexcused or frequent absences, tardiness, and early departures; arguments with fellow employees; injuries caused to other employees through negligence, poor judgments and bad decisions; unusual on-the-job accidents; increased spoilage or broken equipment through negligence; involvement with the law; or a deteriorating personal appearance.39
The Logic of EAPs
Today 87 percent of employers with more than 1,000 employees and 51 percent of those with 50–99 employees offer EAPs.40 Modern EAPs are comprehensive management tools that address behavioral risks in the workplace by extending professional counseling and medical services to all “troubled” employees. A troubled employee is an individual who is confronted by unresolved personal or work-related problems. Such problems run the gamut from alcoholism, drug abuse, and high stress to marital, family, and financial problems. Although some of these may originate “outside” the work context, they most certainly will have spillover effects to the work context.
An emerging application of EAPs for critical incident stress response (CISR) is for unexpected, life-threatening, and time-limited events that cause symptoms of post-traumatic stress syndrome. These might include the death of a child, attempted or actual physical assault, break-ins, or a suicide attempt or completed suicide of a patient or prisoner. A 2009 paper by Mark Attridge describes that a CISR program following bank robberies in Australia showed worker absence reduced by 60 percent, and medical benefits and workers’ compensation costs reduced by 66 percent. CISR after raids at post office businesses reduced sickness and absence by 50 percent. CISR after traumatic incidents at an Australian prison reduced the costs of assisting stressed employees by 90 percent.41 Indeed, the economic downturn produced a new sort of “critical incident,” the experience of a job loss or impending financial hardship by the employee or a member of the family. Aetna Behavioral Health, part of Aetna Inc., a health insurer, saw a 60 percent increase in EAP program members seeking help in the third quarter of 2008 versus the same period in 2007, with financial stress the main source of the increase.42
Statistics such as these lead to one inescapable logical conclusion: The personal problems of troubled employees can have substantial negative economic impacts on employers. To help resolve those problems, many employers have adopted employee assistance programs.
Costs and Reported Benefits of EAPs
EAPs are either internal or external. An internal EAP is an in-house service staffed by company employees. An external EAP is a specialty-service provider hired by the employer; it may have multiple locations, to make it easy for clients to access. Such arrangements are especially convenient to small employers who do not have the resources to provide internal services. On the other hand, a comparison of the two models found that internal EAPs received 500 percent more referrals from supervisors and 300 percent more employee cases. Perhaps this is because most employees do not seek assistance on their own—they get help only when referred by their supervisors.43 Costs of the two types of programs are similar: $21.83 per employee per year for internal programs and $18.09 for external programs.44
A large-scale review of the cost-effectiveness of EAPs concluded, “There is no published evidence that EAPs are harmful to corporate economies or to individual employees .... All of the published studies indicate that EAPs are cost-effective.”45 By offering assistance to troubled employees, the companies promote positive employee-relations climates, contribute to their employees’ well-being, and enhance their ability to function productively at work, at home, and in the community.46
From a business perspective, well-run programs such as those at GM or ChevronTexaco seem to pay off, with benefit-cost ratios of 3:1, 5:1, or more. On the other hand, not all programs are equally effective, and anecdotal evidence of the effectiveness of EAPs abounds. Findings do not generalize across studies, however, unless the EAP is implemented in the same way. For example, as noted earlier, in some companies, counselors are available on-site. In other companies, it is possible to access an EAP counselor only through a toll-free telephone number. Evidence indicates that when counselors are available on-site instead of solely through a toll-free number, the programs are more effective.47 Results of the programs will be more interpretable, to the extent that proper research designs and methods for collecting data are followed. This is the purpose of analytics in the LAMP model, and we consider it further in the next section.
Enhanced Analytical Considerations in EAPs
Actual results may not be quite as rosy as have been reported in the literature or the media. Evaluation may be ex-ante (estimates computed before implementation of an EAP) or ex-post (measurement of the costs and benefits of actual program operations and impacts after the fact). Evaluation may be expressed in qualitative terms or in quantitative terms.
If evaluation is expressed in quantitative terms, as many operating executives demand, two major issues must be considered. One is how to establish all program costs and benefits. To establish its costs, an EAP must incorporate an information system that can track factors such as insurance use, absenteeism, performance analysis, accidents, and attendance data. A second issue is how to express and translate the costs and benefits into monetary values. Benefits derived from an EAP may be very difficult to translate into economic terms. In addition, unless proper experimental controls are exercised, cause-effect relations between EAP involvement and one or more dependent variables may be difficult or impossible to identify. As a reminder, these ideas are summarized as follows:
• Identify all program costs and benefits.
• Express costs and benefits in economic terms.
• Demonstrate that implementation of the EAP has caused changes in outcomes of interest.
A Template for Measuring the Effects of EAPs
In the following sections, we present detailed methods for expressing the returns of EAPs in economic terms for four important outcomes: productivity, employee turnover, unemployment costs, and savings in supervisors’ time. These are by no means exhaustive, but they illustrate high-quality analysis elements that are often feasible but overlooked in typical situations.
Productivity
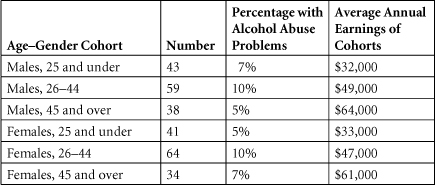
The productivity losses associated with troubled employees can be staggering. Here is one method for determining the productivity cost (ex-ante) attributable to employees who abuse alcohol.48 To use the method properly, compute the following formula separately for each age–gender cohort. Then sum the costs for all age–gender cohorts.
No. of workers in age–gender cohort in workforce
× Proportion of workers in age–gender cohort with alcohol–abuse problems
× Annual earnings
× Productivity decrease attributable to alcohol
= Cost of alcohol-related reduced productivity
Two key inputs to this formula might be difficult to acquire:
• The proportion of workers in each age–gender cohort with alcohol abuse problems
• The productivity decrease attributable to alcohol
Over all cohorts, however, national figures suggest that 5 percent to 10 percent of a typical workforce suffers from alcohol abuse,49 and that the figure may be as high as 16 percent across all full-time employees.50 In well-controlled studies, productivity losses attributable to alcohol abuse have ranged from 14 percent to 21 percent.51 However, one researcher has estimated that personal problems overall affect 18 percent of the workforce, resulting in an overall productivity loss of 25 percent.52 It is important to note that the latter figure is an estimate, not a precise number derived on the basis of controlled research. It is used in the calculations shown here simply for illustrative purposes. Keep this in mind in analyzing the example and in applying the formula to actual work situations.
For one age–gender cohort in any given workforce, inputs to Equation 1 might be as follows:
100 workers in age–gender cohort in workforce
× 10 percent with alcohol abuse problems
× Annual earnings of $45,000 per worker in cohort
× 20 percent productivity decrease attributable to alcohol
= Cost of alcohol-related reduced productivity of $90,000
At a more general level, the city of Phoenix developed the following formula through its Project Concern to determine the costs due to troubled employees, as well as (ex-ante) the amount of money that could be saved in terms of improved productivity through an EAP:53
Compute the average annual wage of employees by dividing the average total number of employees into the annual payroll for employees.
Determine the proportion of the payroll for troubled employees. To do that, multiply the average annual wage by 18 percent of the total number of employees (average percentage of troubled employees identified across many studies).54
Determine the present loss in productivity due to troubled employees. To do so, multiply the result of step 2 by 25 percent (average productivity loss across studies).55
Identify the potential amount saved per year by an EAP. To do that, multiply the result of step 3 by 50 percent (actual success rate reported by Project Concern).
To illustrate, let us assume that a firm employs 100 workers, at an annual payroll cost of $4.5 million, or $45,000 per worker (step 1). To calculate the payroll for troubled employees, let us assume that 18 percent, or 18 workers, are troubled × $45,000 annual earnings/worker = $810,000 (step 2). To determine the present cost of reduced productivity for these troubled workers, multiply $810,000 × 25 percent = $202,500. Finally, to determine the potential amount of money that could be saved per year through an EAP, multiply $202,500 × 50 percent = $101,250.
Note that potential savings in this example reflect only the direct cost of labor (just one component of productivity). To the extent that such savings do not reflect the contribution of improved use of capital and equipment that can be realized by a fully productive employee, they will underestimate the actual level of savings the firm can realize.
Costs of Employee Turnover in EAPs
Turnover savings realized through the implementation of an EAP are “opportunity savings” (see Chapter 2) because they reflect costs that were not actually incurred.
In the hypothetical example that follows, let’s assume that 10 percent of 2,500 employees (250) can be expected to quit each year. Assume further that of the 250 employees who are expected to quit, 20 percent of them (50 employees) use the firm’s EAP. Of those 50, assume that 30 represent production employees, 10 are administrative/technical, and 10 are managerial. Based on the method for calculating the fully loaded cost of turnover that we described in Chapter 4, “The High Cost of Employee Separations,” (that is, separation, replacement, and training costs), potential turnover costs may be stated as shown in Table 5-2.
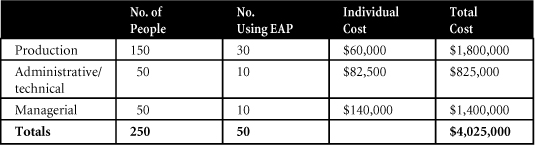
Table 5-2. Potential Turnover Costs
For those employees who use the company’s EAP, assume that the actual number who terminate or quit after EAP involvement is as shown in Table 5-3, a 50 percent turnover reduction.
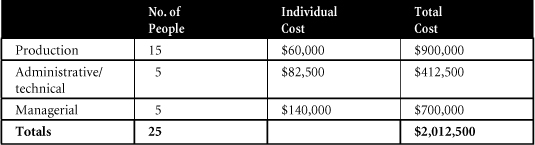
Table 5-3. Post-EAP Terminations
Suppose as well that one result of EAP diagnosis is that some employees are hospitalized for their condition, at a cost of $295,600 per year. So, the overall cost of the EAP is the program budget of $400,000 plus the hospitalization of $295,600, or $695,600 per year.
To compute the ROI, use these numbers:
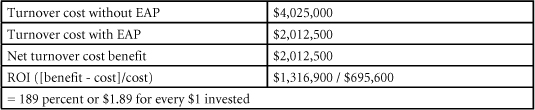
Compiling this information year after year is particularly useful because numbers can be compared across years and trends can be identified.
Unemployment Compensation in EAPs
Assume in the preceding example that employees who quit draw unemployment compensation for an average of six weeks, at an average of 60 percent of full-time pay. If the firm’s average hourly wage rate was $24 per hour in 2010, the savings in unemployment compensation would be $24 × 25 people × 40 hours/week × 6 weeks × .62 = $89,280. Obviously, this figure could be considerably larger if the hourly rate, the number of employees saved, or the duration of the unemployment compensation increased.
Savings in Supervisors’ Time in EAPs
Continuing with our hypothetical example, if the EAP were not available, supervisors would be forced to deal with employee problems. The hours that supervisors save by not dealing with problems is equal to the total number of hours spent in counseling sessions for the 50 employees who took part in the firm’s EAP. Assume that each employee received 20 hours of counseling, on average. Thus, the supervisors had at least 1,000 hours to carry out their duties more effectively. Assuming that the average cost of one hour of supervisory time (wages plus benefits and overhead costs) was $57.50 in 2010 dollars, the economic value of that time was $57.50 × 1,000 = $57,500. Remember, as we cautioned in Chapter 2, the total pay of supervisors does not vary whether they are counseling troubled employees or not. The economic value of their time is simply a proxy, and an imperfect one at that, for the opportunity cost of the lost value that supervisors would have been creating if they had not been using their time to counsel troubled employees.
Future of Lifestyle Modification, WHP, and EAPs
Based on the research reviewed in this chapter, it is clear that WHP and EAP programs can yield significant payoffs to organizations that adopt them. However, it also is clear that the programs do not work under all circumstances and that the problems associated with assessing relative costs and benefits may be complex. At the very least, we need well-controlled, longitudinal studies to investigate program costs and benefits and the extent to which behavior changes are maintained over time. Moreover, the type and structure of programs should be evaluated for their success and impact on different populations of workers (older/younger; male/female; high, moderate, and low risk; racial or ethnic group), especially in light of the changes in the composition of the workforce that are taking place.56 We need to understand the factors that affect employee participation or nonparticipation and the factors that promote long-term changes in behavior. If we then build these factors into lifestyle modification, WHP, and EAPs, and if we are successful in attracting troubled or at-risk employees into the programs, the programs will flourish, even in an era of limited resources.
Exercises
Software that calculates answers to one or more of the following exercises can be found at http://hrcosting.com/hr/.
- Sobriety, Inc., a marketer of substance abuse programs, is concerned about the cost of alcohol abuse among its own employees. Based on the following data, what is the productivity cost associated with employees who abuse alcohol? Among all cohorts, the productivity decrease attributable to alcohol abuse is 20 percent.
- The following data shows turnover costs for the 4,000 employees of Hulakon, Inc., for one year. In any given year, 12 percent of the employees can be expected to quit.
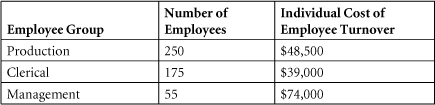
A total of 120 employees participate in the company’s EAP (62 production employees, 44 clerical employees, and 14 managers). As a result of that involvement, the following numbers of employees actually quit.

Hospitalization costs comprise $189,000, or 56 percent of the total amount annually budgeted for the EAP. What is Hulakon’s ROI for its employee assistance program for this one year?
- Your firm is considering establishing an EAP, but it is unsure of which provider to select. Top management has asked you to assess the strengths and weaknesses of possible providers. Make a list of questions to ask each one.
1. Strassel, Kimberley A., “Mr. Burd Goes to Washington,” The Wall Street Journal, June 19, 2009, A13.
2. Eric Kimbuende, Usha Ranji, Janet Lundy, & Alina Salganicoff (2010). U.S. Healthcare Costs: Background Brief. The Kaiser Family Foundation. March 2010. http://www.kaiseredu.org/topics_im.asp?imID=1&parentID=61&id=358#6b.
3. The Institute for the Future, “Health and Health Care 2010: The Forecast, The Challenge,” (2nd ed.) 2003 page xxii. Princeton, NJ: Jossey-Bass. http://www.iftf.org/system/files/deliverables/SR-794_Health_%2526_Health_Care_2010.pdf.
4. M. P. O’Donnell, “Definition of health promotion: Part III: Expanding the definition,” American Journal of Health Promotion, 1989, 3, 5.
5. Towers Watson press release, “Towers Perrin Health Care Cost Survey Shows Average Annual Per-Employee Cost of $9,660 in 2009—and the Health Care Affordability Gap Widens,” September 24, 2008. www.towersperrin.com/tp/showdctmdoc.jsp?url=master_brand_2/usa/press_releases/2008/20080924/2008_09_24b.htm&country=global.
6. “Health Hazards,” BusinessWeek, September 26, 2005, 13.
7. Johnson, Avery, “Firms Reducing Health Benefits, Surveys Find,” The Wall Street Journal, September 26, 2009, A6
8. Yoest, Patrick, “Report Takes Aim at Rising Health-Insurance Premiums,” The Wall Street Journal Online, February 18, 2010.
9. Weisser, C., and A. Gengler, “50 Ways to Cut Your Health Care Costs,” Money (November 2006), 124–134.
10. Cascio, W. F., “The Costs—and Benefits—of Human Resources,” in International Review of Industrial and Organizational Psychology 22, ed. G. P. Hodgkinson and J. K. Ford (Hoboken, NJ: John Wiley & Sons, 2007).
11. Aeppel, T., “Ill Will: Skyrocketing Health Costs Start to Pit Worker vs. Worker,” The Wall Street Journal (June 17, 2003), A1, A6.
12. Sammer, Joanne, “Big Picture on Drug Benefits,” HR Magazine 55, no. 3 (March 10, 2010), 33–36.
13. Miller, S., “More Favor Incentives to Change Employee Health Behavior,” July 2006, at www.shrm.org/rewards/library_published/benefits/nonIC/CMS_017859.asp.
14. American Institute for Preventive Medicine, “The Health & Economic Implications of Worksite Wellness Programs,” American Institute for Preventive Medicine. Farmington Hills, MI. 2008. Page 4. http://www.healthylife.com/template.asp?pageID=75.
15. Towers Watson, 2010 Health Care Cost Survey (Stamford, Conn.: Towers-Watson, 2010). http://www.towerswatson.com/assets/pdf/1265/2010_HCCS.pdf.
16. C. Hirschman, “Off duty, out of work,” HRMagazine, 48:2, February 2003, 50–56.
18. M. Safer, “Whose life is it anyway? Are employers’ lifestyle policies discriminatory?,” 60 Minutes, CBS Broadcasting, at www.cbsnews.com/stories/2005/10/28/60minutes/main990617.shtml.
19. “Planning Wellness: Getting off to a Good Start,” Absolute Advantage, 5:6, 2006, http://www.welcoa.org/freeresources/pdf/aa_v5.4.pdf.
20. Cascio, W. F., “Weight-Based Discrimination in Employment: Legal and Psychological Considerations,” paper presented at the annual conference of the Society for Industrial and Organizational Psychology, Dallas, May 2006.
21. Tuna, Cari, “Wellness Efforts Face Hurdle,” The Wall Street Journal Online, February 1, 2010.
23. R. E. Glasgow, J. R. Terborg, J. F. Hollis, H. H. Severson, and S. M. Boles, “Take heart: Results from the initial phase of a worksite wellness program,” American Journal of Public Health, 85, 1995, 209–216. See also R. W. Jeffery, S. A. Forster, S. H. French, H. A. Kelder, H. A. Lando, D. R. McGovern, D. R. Jacobs, and J. E. Baxter, “The healthy worker project: A worksite intervention for weight control and smoking cessation,” American Journal of Public Health, 83, 1993, 395–501.
24. Janus, P. A., “Weight Discrimination and the Law,” 2002, at www.Lexis-Nexis.com.
25. Hawkins, L. Jr. “As GM Battles Surging Costs, Workers’ Health Becomes an Issue,” The Wall Street Journal, April 7, 2005, A1, A11.
26. Hertz, R. P., A. N. Unger, M. McDonald, M. B. Lustik, and J. Biddulph-Krentar, “The Impact of Obesity on Work Limitations and Cardiovascular Risk Factors in the U.S. Workforce,” Journal of Occupational and Environmental Medicine 46, no. 12 (2004): 1,195–1,203.
27. The Automotive Lyceum, 2007 GM-UAW Labor Agreement. Downloaded November 8, 2007 from www.christonium.com/automotive/ItemID=1193346768436.
28. World Health Organization, “Economic Benefits of Physical Activity,” 2003, at www.who.int/hpr/physactiv/economic.benefits.shtml.
29. Schmidt, F. L., and N. S. Raju, “Updating Meta-analytic Research Findings: Bayesian Approaches Versus the Medical Model,” Journal of Applied Psychology 92 (2007): 297–308. See also Hunter, J. S., and F. L. Schmidt, Methods of Meta-Analysis: Correcting Error and Bias in Research Findings, 2nd ed. (Thousand Oaks, Calif.: Sage, 2004).
30. DeVol, Ross, and Armen Bedroussian, An Unhealthy America (Santa Monica, Calif.: Milken Institute, October 2007).
31. Loeppke, R., et al., “Health and Productivity as a Business Strategy,” Journal of Occupational and Environmental Medicine 49, no. 7 (2007): 712–721.
32. Sean Nicholson, Mark V. Pauly, Daniel Polsky, Claire Sharda, Helena Szrek, and Marc L. Berge “Measuring the Effects of Work Loss on Productivity with Team Production,” Health Economics 15, no. 2 (2006): 111–123.
33. Britt, J., “Expert: Disease Management Programs Cut Health Care Costs,” May 27, 2004, at www.shrm.org.
34. Lewis, Diane E., “Employers Focus on Chronic Ailments,” The Boston Globe (May 4, 2006), B7. www.boston.com/business/healthcare/articles/2006/05/04/employers_focus_on_chronic_ailments/.
36. Aldana, S. G., “Financial Impact of Health Promotion Programs: A Comprehensive Review of the Literature,” American Journal of Health Promotion 15, no. 5 (2001): 295–320.
37. Ozminkowski, R. J., R. Z. Goetzel, M. W. Smith, R. I. Cantor, A. Shaughnessy, and M. Harrison, “The Impact of the Citibank N.A. Health Management Program on Changes in Employee Health Risks over Time,” Journal of Occupational and Environmental Medicine 42, no. 5 (2000): 502–511.
38. Edington, D. W. “Emerging Research: A View from One Research Center,” American Journal of Health Promotion 15, no. 5 (2001): 341–349.
39. N. R. Lockwood, “Employee assistance programs: An HR tool to address top issues in today’s workplace,” 2005, at www.shrm.org.
40. Galinsky, Ellen, James T. Bond, Kelly Sakai, Stacy S. Kim, and Nicole Guintoli, 2008 National Study of Employers (New York: Families and Work Institute, 2008). See Table 13, p. 24. www.familiesandwork.org/site/research/reports/2008nse.pdf.
41. Attridge, Mark, The Business Case for Workplace Critical Incident Stress Response: A Literature Review of Clinical and Cost-Effectiveness Research (Crisis Care Network, June 30, 2009). www.crisiscare.com/news/news_wp_attridge.pdf.
42. Deaenlle, Conrad, “A Corporate Perk for a Stressful Time,” The New York Times, January 18, 2009. www.nytimes.com/2009/01/18/jobs/.
43. S. Prochaska, “Employee assistance programs: What does HR need to know?” May 2003, at www.shrm.org.
44. U.S. Department of Health and Human Services, “Employee Assistance Programs: Fact Sheet,” 2006, at http://workplace.samhsa.gov/WPResearch/EAP/FactsEAPfinal.html.
45. Blum, T., and P. Roman, Cost-Effectiveness and Preventive Implications of Employee Assistance Programs (Washington, D.C.: U. S. Department of Health and Human Services, 1995).
46. Stone, D. L., and D. A. Kotch, “Individuals’ Attitudes Toward Organizational Drug Testing Policies and Practices,” Journal of Applied Psychology 74 (1989): 518–521.
47. Collins, K. R., “Identifying and Treating Employee Substance Abuse Problems,” January 2003, at www.shrm.org.
48. Parker, D. L., J. M. Shultz, L. Gertz, R. Berkelman, and P. L. Remington, “The Social and Economic Costs of Alcohol Abuse in Minnesota, 1983,” American Journal of Public Health 77 (1987): 982–986.
49. N. R. Lockwood, “Employee assistance programs: An HR tool to address top issues in today’s workplace,” 2005, at www.shrm.org.
50. National Institute of Alcohol Abuse and Alcoholism, 2006, at www.niaaa.nih.gov/.
52. Masi, D., Designing Employee Assistance Programs (New York: American Management Association, 1984).
53. Wagner, W. G., “Assisting Employees with Personal Problems,” Alexandria, Va.: Personnel Administrator Reprint Collection Series, Employee Assistance Programs, 1984.
56. Lawler, E. E., and J. O’Toole, The New American Workplace (New York: Palgrave Macmillan, 2006).