
Chapter 6. Employee Attitudes and Engagement
Every year, Fortune magazine conducts an annual survey of the “100 Best Companies to Work For.” Firms strive to be named to this list because they receive twice as many applications as firms that are not on the list, and they enjoy employee turnover levels that are less than half those of their competitors.1 In short, people want to work at places where they are treated well. If satisfied employees really do fuel corporate profits, one would expect “100 Best” employers to outperform broad indexes of firms that are publicly traded—and they do.2
In one well-controlled study, for example, researchers compared the organizational performance of Fortune’s “100 Best Companies to Work For” with two sets of other companies, a matched group and the broad market of publicly traded firms, over a six-year period.3 They found that organization-level employee attitudes of the “100-Best” firms were both highly positive and stable over time. They also found that the return on assets and market-to-book value of the equity of publicly traded companies included on the “100 Best” list were generally better than those of a matched comparison group. That finding established an important link between employee attitudes and organization-level financial performance.
As for stock returns, the same study found that the “100 Best” companies outperformed the broad market when considering cumulative (longer-term) returns (82 percent versus 37 percent from 1998 to 2000), although not consistently for annual returns. The authors concluded: “At the very least, our study finds no evidence that positive employee relations comes at the expense of financial performance. Firms can have both.”4 Similar results have been reported in the accounting and finance literature.5
Of course, finding a correlation between financial performance and employee attitudes does not mean that enhancing employee attitudes caused the superior financial performance of the organizations in the study. Chapter 2, “Analytical Foundations of HR Measurement,” showed that correlation is not the same as causation. For example, people like to work for companies that are financially successful. It is just as plausible that when companies become financially successful, their employees display positive attitudes. This is, in fact, the case for people whose jobs are a “central life interest.”6 For an investor, the link between employee attitudes and financial performance of the firm is a valuable signal, and the direction of causality is irrelevant. From a manager’s perspective, however, “what causes what” is extremely important because it affects decisions about talent.
Given the positive financial results cited earlier for “100 Best” companies, it is perhaps not very surprising that measuring attitudes such as satisfaction, engagement, and commitment has become big business. There are many consulting products and internal organizational processes to define and track employee attitudes and to relate those attitudes to a variety of operational and financial results. Yet the working models of most business leaders are often no more sophisticated than a belief that “happy employees are productive employees” or that “becoming a great place to work will create superior financial results.” Of course, a valuable logic and measurement system would do better, by articulating the connections between attitudes and organizational outcomes and directing measures to the areas that best articulate those connections.
Measures, often in the form of employee surveys, are valuable to the extent that they lead to actions or decisions designed to improve organizational effectiveness and to promote long-term, relevant change.7 This chapter presents frameworks that HR and business leaders can use to collect and interpret relevant measures to make better decisions about programs to improve employee attitudes, even if the decision is not to invest in them. Such systems can certainly identify where attitude-assessment or employee-engagement programs are valuable. Our purpose, however, is not simply to provide tools to sell such investments, but to enhance decisions about employee attitudes.
Attitudes Include Satisfaction, Commitment, and Engagement
Attitudes are internal states that are focused on particular aspects of or objects in the environment. They include three elements: cognition, the knowledge an individual has about the focal object or employment aspect; the emotion an individual feels toward the object or aspect; and an action tendency, a readiness to respond in a predetermined manner to the object or aspect.
One reason that it is important to have a clear and logical framework for understanding how attitudes connect to organizational success is that attitudes are often multidimensional. Thus, job satisfaction is a multidimensional attitude. In its 2009 survey of employees from small, medium, and large companies in a wide range of industries, the Society for Human Resource Management found that the top five drivers of job satisfaction were job security, benefits, compensation/pay, opportunities to use skills and abilities, and a safe feeling in the work environment.8
Job satisfaction is related to, but not identical with, employee engagement. Job satisfaction connotes a state of satiation; it is an outcome. Engagement connotes activation—feelings of energy, enthusiasm, and a positive affective state.9 Although conceptually distinct, the two are highly correlated.10
Likewise, organizational commitment is a bond or linking of an individual to the organization that makes it difficult to leave.11 It is the emotional engagement that people feel toward a firm.12 Commitment can be to the job or the organization and can take the form of a commitment to contribute, to stay, or both.
Commitment is closely related to the concept of employee engagement.13 Engagement is a positive, fulfilling, work-related state of mind that is characterized by vigor, dedication, and absorption.14 Vigor refers to high levels of energy and mental resilience while working, the willingness to invest effort in one’s work, and persistence even in the face of difficulties. Dedication is characterized by a sense of significance, enthusiasm, inspiration, pride, and challenge at work. Absorption consists of being so fully concentrated, happy, and deeply engrossed in one’s work that time passes quickly and one has difficulty detaching oneself from work.15 Engagement fuels discretionary efforts and concern for quality. It is what prompts employees to identify with the success of their companies, to recommend them to others as good places to work, and to follow through to make sure problems get identified and solved.
Satisfaction, Commitment, and Engagement as Job Outcomes
The 2008 National Study of the Changing Workforce was based on survey responses from 2,769 wage and salaried employees.16 That study identified six dimensions of effective workplaces that include both work and nonwork factors: job challenge and learning, autonomy, supervisor task support, climate of respect and trust, work-life fit, and economic security. The researchers found that greater overall workplace effectiveness, a summary index that includes all six criteria, was strongly related to three important work outcomes: greater engagement (R2 = .473), job satisfaction (R2 = .466), and desire to stay with the organization (R2 = .187). At the same time, however, each outcome related somewhat differently to the six criteria, as shown in Table 6-1.
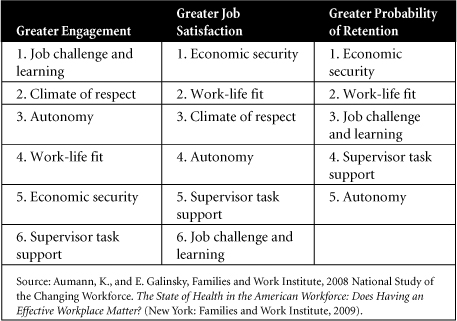
Table 6-1. Effective Workplace Dimensions That Significantly Predicted Work Outcomes, Rank-Ordered by Relative Importance
Source: Aumann, K., and E. Galinsky, Families and Work Institute, 2008 National Study of the Changing Workforce. The State of Health in the American Workforce: Does Having an Effective Workplace Matter? (New York: Families and Work Institute, 2009).
Note, for example, that although job challenge and learning is the most important predictor of engagement, relative to the other effective workplace dimensions, it is the sixth-best predictor of job satisfaction and the third-best predictor of intent to stay. Whereas work-life fit and economic security rank fourth and fifth in the prediction of engagement, they are the two top predictors of job satisfaction and intent to stay, with economic security the best predictor of both.
The Logic Connecting Employee Attitudes, Behaviors, and Financial Outcomes
At a more general level, employee satisfaction, commitment, and engagement affect organizational performance through employee behaviors. Employees with lower attitudes may be absent, may be late for work, may quit more often, or may place less emphasis on customer satisfaction than those with more positive attitudes. Evidence indicates that this is often the case.17 Figure 6-1 shows these ideas graphically.
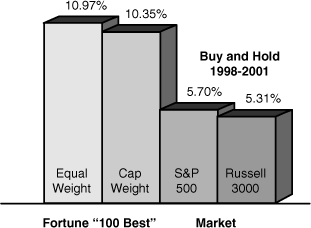
Figure 6-1. Logical relationships among employee attitudes, behaviors, and financial outcomes.
Figure 6-1 shows that enhancing employee attitudes can affect a firm’s financial performance. Changing employee attitudes can have direct effects on employee turnover and absence, with the associated effects on the costs of absence and turnover (see Chapters 3, “The Hidden Costs of Absenteeism,” and 4, “The High Cost of Employee Separations”). Having a reputation as a satisfying place to work may enhance the ability to recruit more or higher-quality applicants (see Chapters 8, “Staffing Utility: The Concept and Its Measurement,” and 10, “The Payoff from Enhanced Selection”). In addition, some evidence suggests that employee attitudes directly affect employee performance, particularly the tendency for employees to do tasks that are beyond their formal job descriptions (often called “citizenship behaviors”) and to convey positive emotions to customers. These latter connections show up in productivity or service costs and in sales and revenue levels (see Chapter 9, “The Economic Value of Job Performance”).
It is also important to note that the relationships shown in Figure 6-1 vary depending on the nature of the talent pool and the work. For jobs whose contributions depend significantly on interacting with customers and conveying positive emotions, the effects of attitudes on service performance may be paramount. For jobs that seldom encounter a customer, but in which teamwork and cooperation are key, citizenship behaviors may be the vital connection. For jobs in which the costs of absence and turnover are very significant, the effects of attitudes on these behaviors may be the vital measurement question. Just as with all measurement, employee attitudes have different effects depending on what elements of employee behaviors are pivotal.
Of course, employee attitudes also relate to important outcomes that are less tangible or measurable by traditional financial systems, including individual growth and well-being, organizational adaptability, and goodwill. Many organizations measure employee attitudes not only because they provide leading indicators of tangible financial performance, but because they are a signal about more subtle nonfinancial results. In other words, they see improving employee attitudes as a worthy goal in and of itself. We recognize the nonfinancial outcomes of employee attitudes and their independent value as an organizational goal, but we focus in this chapter on the connections between financial outcomes and employee attitudes.
Employee Engagement and Competitive Advantage
It is important to note that engagement behaviors operate at the individual, team, and organizational levels.18 From the perspective of competitive advantage, the aggregate level of employee engagement matters, for that affects work-unit performance as well as overall organizational performance. As Macey and Schneider (2008b) noted, “The unit manager responsible for a work group of 10 frontline employees thinks very differently about the meaning of 8 out of 10 people being engaged than does a division manager who thinks about 8,000 out of 10,000.” These proportions have very different implications for the kinds of interventions the respective managers think about and the likely consequences of their change efforts.
At the level of the work unit, performance improves when highly engaged team members devote extra effort to innovation, cooperate with each other, and effectively adapt to change.19 Having an engaged employee base can facilitate adaptation to change, which is essential to innovation, continuous improvement, and competitiveness.20 If one aggregates these kinds of behaviors from highly engaged employees across work units of the organization, this should lead to the kinds of outcomes that speak directly to competitive advantage: improvements in customer satisfaction, profitability, and shareholder value.21 These are the kinds of outcomes that managers and investors care about. Figure 6-2 shows graphically some relationships among individual, work-unit, and organizational levels of engagement and financial outcomes that produce competitive advantage.
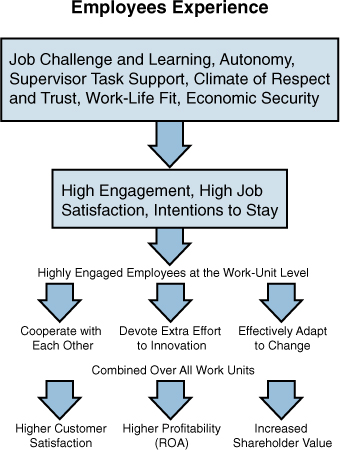
Figure 6-2. Logical relationships among behavioral indicators of employee engagement at the individual and work-unit levels, and, when aggregated at the organizational level, how engagement relates to competitive advantage.
Our next section describes a study that empirically linked high levels of employee engagement to improvements in service climate, customer loyalty, and financial outcomes.
A well-controlled field study suggests that employee engagement promotes a positive service climate (shared perceptions of practices and behaviors that are expected and rewarded with regard to customer service)22 and customer loyalty.23 The researchers selected a sample of three employees and ten customers from each of 120 hotel and restaurant work units. They demonstrated that organizational resources (for example, training, supervisor support, performance feedback) and employee engagement predict service climate, which, in turn, predicts employee performance and then customer loyalty.
Loyal customers, in turn, tend to do two things:
• Recommend the organization to others
• Generate repeat business
Both of these have been shown to lead to changes in revenue growth, lagged about one fiscal quarter.24 Figure 6-3 illustrates graphically these logical connections.
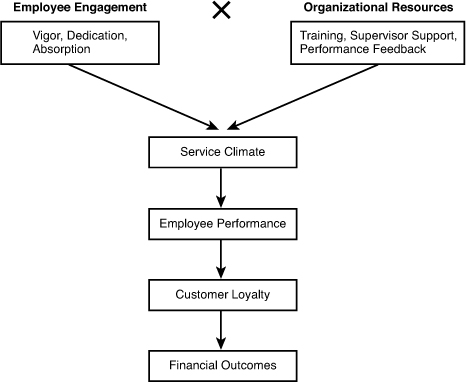
Figure 6-3. Logical connections among employee engagement, employee performance, customer loyalty, and financial outcomes.
Note in the figure that the relationship between employee engagement and organizational resources is multiplicative, not additive. That is, it is represented as employee engagement times organizational resources, not plus organizational resources, because if either of those is low or, in theory, zero, the other element cannot compensate enough to affect service climate and the remaining elements of the model in a positive manner.
At a broader level, the Corporate Leadership Council found that every 10 percent improvement in commitment can increase an employee’s level of discretionary effort by 6 percent and performance by 2 percent, and that highly committed employees perform at a 20 percent higher level than noncommitted employees. Another study by Hewitt Associates reported that double-digit growth companies have 39 percent more highly engaged employees and 45 percent fewer highly disengaged employees than single-digit growth companies.25 These studies provide very useful examples that connect employee attitude measures to intermediate processes, and ultimately to customer behaviors and financial results.
Still, these results do not allow us to say “what causes what.” Although employee engagement may cause double-digit financial growth in companies, it is equally plausible that double-digit-growth companies are fun, exciting places to work, and, as a result, employees are highly engaged. Academic researchers, consulting firms, and the in-house research departments of large companies conduct studies like these regularly, and their findings are often extracted in media reports. To be better consumers of measures and correlations between attitudes and financial performance, it is important that readers be aware of key qualifications and limitations of study findings. The next sections of the chapter present a summary of common ways to measure attitudes and then introduce some analytical principles that help ensure that the conclusions from the data are valid.
Measures of Employee Attitudes
Measures of employee attitudes are fairly well developed.26 Job satisfaction is a multidimensional attitude. We can assess how satisfied someone is with a job as a whole (the global feeling about the job) by asking, for example, “Overall, how much enjoyment do you find in your work?” Alternatively, we might assess and sum up satisfaction with facets of the job, such as satisfaction with pay, colleagues, the nature of the work, and supervision. If the purpose is to understand the overall effect of jobs, global ratings are the best choice. If the assessor wants to know how to improve job satisfaction in a particular situation, the facet approach is more diagnostic.27
Organizational commitment is also a multidimensional attitude with three distinct components. Affective commitment refers to an employee’s emotional attachment to an organization and a desire to stay. Continuance commitment refers to the extent to which an employee believes that leaving would be costly. Normative commitment refers to an employee’s feelings that staying with the current organization is the right thing to do.28 There are well-developed measures of each of these components of commitment. For example, here is an item from the Organizational Commitment Questionnaire, a measure of affective commitment: “It would take a lot to get me to leave this organization.”29
We noted earlier that employee engagement is closely related to job satisfaction and commitment, for it is a positive, fulfilling, work-related state of mind characterized by vigor, dedication, and absorption. Two well-known measures of engagement are the Gallup Organization’s Q12 and the Utrecht Work Engagement Scale 9. The Q12 assesses 12 employee perceptions of work characteristics and people-related management practices (measures of employee satisfaction-engagement) that play a large role in triggering a profitable, productive workplace. Employees respond on a 1–5 Likert-type scale, where 5 is Extremely Satisfied and 1 is Extremely Dissatisfied. Consider three sample items:30
• I know what is expected of me at work.
• In the last six months, someone at work has talked to me about my progress.
• The mission/purpose of my company makes me feel that my job is important.
Each item is a causal contributor to engagement, and the composite or sum of the items is said to measure engagement through the measurement of its causes. Likewise, each item is actionable and generalizably related to important business outcomes,31 as we describe in a later section.
The Utrecht Work Engagement Scale 9 (UWES-9)32 is a nine-item measure of vigor, dedication, and absorption. Because the three factors are highly intercorrelated (above 0.8), it is probably best to use the total score from the UWES-9 as a measure of engagement at work. In responding to each item, employees indicate how often they feel this way about their jobs, from Never (0) to Always (6). Here are the nine items:
- At my work, I feel bursting with energy.
- At my job, I feel strong and vigorous.
- When I get up in the morning, I feel like going to work.
- I find the work that I do full of meaning and purpose.
- I am enthusiastic about my job.
- My job inspires me.
- Time flies when I am working.
- When I am working, I forget everything else around me.
- I feel happy when I am working intensely.
Before adopting any particular measure, it is important to consider the logical relationships you want to examine. The descriptions in this section can help you make better choices. Broad, global measures of job satisfaction or commitment may be appropriate for examining general employee attitudes, but it may often be appropriate to choose measures that focus on particular work facets that more clearly distinguish the elements of satisfaction, commitment, or engagement. Too often organizations adopt the most popular or well-known measure, without realizing that decades of research have produced many alternatives.
Analytical Principles: Time Lags, Levels of Analysis, and Causal Ordering
The following sections address three important issues that can help illuminate attitude-behavior relationships: appropriate intervals of time to assess these relationships; individual and organizational levels of analysis; and causal relationships between attitudes and important organizational outcomes.
Unfortunately, the research literature produces no consensus about what the most appropriate time lag might be for collecting relevant information either on the same variable measured at two different times (for example, attitudes of employees about their supervisors) or when attempting to assess the relationship between two or more variables (for example, aggregated employee attitudes and organizational performance). Indeed, organizational performance may even drop a bit immediately following the implementation of a change in management practices, as the organization adapts.33 At the very least, such relationships must be relatively stable. Stability is important because if a variable is not stable over time, it cannot be predicted reliably by another variable. Hence, if lagged analyses are the major focus of interest, the stability of those lags is important.
As an example of how different time lags can produce different results, consider the results of a longitudinal study.34 The researchers analyzed employee attitude data from 35 companies over eight years at the organizational level of analysis relative to financial (return on assets) and market performance (earnings per share) using a variety of lagged analyses. They found consistent and significant positive relationships over various time lags between aggregated attitudes about satisfaction with security, pay, and overall job satisfaction (OJS) and financial and market performance.
The same researchers also examined one-year, two-year, three-year, and four-year lags. They found remarkable stability in employee attitudinal data at the organizational level of analysis. The one-year lags ranged from a low of 0.66 (satisfaction with work group) to a high of 0.89 (satisfaction with security). Even the four-year lags revealed substantial stability, ranging from a low of 0.40 (satisfaction with work facilitation) to a high of 0.78 (satisfaction with empowerment).
With respect to financial indicators, return on investment (ROI), return on equity (ROE), return on assets (ROA), and earnings per share (EPS) were significantly correlated across time. Median correlations were 0.57 (ROI-ROE), 0.73 (ROE-ROA), 0.94 (ROI-ROA), 0.38 (ROI-EPS), 0.48 (ROE-EPS), and 0.33 (ROA-EPS). However, they were differentially stable over time, with ROI being the least stable (median one-year lag r = 0.47) and ROA being the most stable (median one-year lag r = 0.74). Based on these results, the researchers used ROA as the most stable indicator of organizational financial performance. They used EPS as an indicator of market performance, although it was not as stable as ROA (median one-year lag r = 0.49).
These results show that both attitude measures and organizational performance measures may vary in their stability over different time spans. If possible, it is wise to collect data on attitudes and organizational outcomes (behavioral or financial) at multiple time periods and choose the interval that yields the most stable and representative relationships. It is also useful to consider the logical connections and strategic decision factors in choosing time lags. In organizations with stable and long-term employment relationships, the relationship between attitudes and financial outcomes spanning several years may be quite relevant and valuable, because such organizations would reap the rewards of attitude change over many years. In organizations where employee tenure or time in a job is less, the relevant strategic issue may be the effect of attitudes on outcomes that occur much sooner.
Levels of Analysis
Studies of the relationship between employee attitudes and customer satisfaction or turnover, using cross-lagged correlational analyses (that is, correlations between employee attitudes and customer satisfaction or turnover, computed at different times) have been inconclusive regarding the direction of causality, as noted previously.35 Still, such studies provide tantalizing evidence that the collective employee attitudes of the organization or business unit may be correlated with overall performance of that organizational or business unit, even if, for particular individuals, the attitudes are only weakly correlated with individual-level performance. For example, we noted that the Gallup Organization identified 12 worker beliefs (measures of employee satisfaction-engagement) that relate most closely to workplace profits and productivity.36 Its multiyear study was based on an analysis of data from more than 100,000 employees in 12 industries.
A subsequent meta-analysis (see Chapter 2) included data from almost 8,000 business units in 36 companies.37 The results showed a consistent, reliable relationship between the level of the 12 beliefs among employees and unit-level outcomes such as profits, productivity, employee retention, and customer loyalty. At the level of the work group, groups that demonstrated positive attitudes were 50 percent more likely to achieve above-average customer loyalty and 44 percent more likely to have above-average profitability.
At the level of the business unit (division, plant, and so on), those in the top quartile on employee engagement had, on average, from $98,000 to $146,000 higher monthly revenues or sales (in 2010 dollars) than those in the bottom quartile. A $98,000 monthly difference translates into more than $1 million ($1,176,000) per year. Interestingly, researchers found significant variances among work groups or operating units within the same company, suggesting that even companies that do well overall may have significant opportunities to improve individual business units.
In a 2009 study of 50 multinational companies by the London office of Towers Watson, those with high levels of employee engagement outperformed those with low levels on three important financial indicators: 12-month change in operating income (19.2 percent versus –32.7 percent), 12-month net income growth rate (13.7 percent versus –3.8 percent), and 12-month earnings per share growth rate (27.8 percent versus –11.2 percent).38
Understanding how the connections between attitudes and organizational outcomes vary depending on the unit of analysis is important. Again, one implication is that organizations should not presume that the whole story is in the relationships between individual employee attitudes and their behaviors. It appears that even when relationships at the individual level are weak, there may still be strong relationships when the aggregated attitudes of employees are related to aggregate performance at the work group or business unit level. Choosing the appropriate level of analysis is a matter both of the power of the statistical test and of the strategic question at hand. In most organizations, fundamental strategic issues involve business unit or work-group performance (for example, store sales, customer satisfaction, ROI), and interventions typically take place at the level of the unit, not at the level of the individual employee.39 Thus, results suggesting that relationships may be more powerful or stable at this level of analysis are encouraging.
Causal Ordering
Based on meta-analysis, described earlier, the authors concluded that the causal order runs from employee attitudes to organizational performance, although they recognized that multidirectional (reciprocal) relationships might also be expected. In the earlier section on time lags, we cited a study that included longitudinal data from 35 companies on employee attitudes and longitudinal data from the same companies on organizational financial and market performance (eight years of data).40 Using both of these sets of data, the researchers were able to explore questions involving causal ordering and time lags among the two sets of variables.
Their analyses revealed statistically significant and stable relationships across various time lags for three of seven attitude scales. Overall job satisfaction and satisfaction with security were predicted by ROA and EPS more strongly than the reverse, although some of the reverse relationships were also significant. Satisfaction with pay exhibited a more reciprocal relationship with ROA and EPS. Based on these results, it is clear that relationships among employee attitudinal variables and organizational performance are complex and may be multidirectional or reciprocal in nature. Researchers can therefore be misled if they simply assume, on the basis of cross-sectional data, that employee attitudes predict organizational financial or market performance, but not vice versa, and if they do not allow for the possibility of reciprocal relationships. To avoid this trap, researchers must collect employee attitude data and organizational performance data longitudinally, at multiple points in time. Doing so allows researchers to test forward and backward lags and to draw meaningful inferences about causal priorities.
The remainder of this chapter shows how financial and attitudinal measures can be synthesized to produce an estimate in dollars of the costs and benefits of human resource management programs designed to improve employee attitudes. We begin with the behavior-costing approach to attitude valuation and then illustrate its application at SYSCO Corporation.
Estimating the Financial Impact of Employee Attitudes: The Behavior-Costing Approach
The behavior-costing approach to employee attitude valuation is based on the assumption that measures of attitudes are indicators of subsequent employee behaviors.41 These behaviors can be assessed using cost-accounting procedures, and they have economic implications for organizations. The conceptual framework underlying behavior costing stems from psychological theories that emphasize that employees’ behavior at work is the result of choices about whether to appear at the workplace (“participation membership”),42 and of choices about how to behave at work (“work strategies”).43 This framework assumes that employees will be more likely to come to work than be absent or quit if they are satisfied with their jobs. In addition, they are likely to exert more effort and to choose more effective job performance strategies if they expect to be rewarded, either intrinsically or extrinsically, for their efforts.44
These ideas suggest that attitudinal indexes of employee satisfaction and engagement should be the best predictors of participation membership, because they reflect perceptions of the rewards associated with being at work, They also suggest that attitudinal indexes of employee motivation should predict job performance, because they reflect some of the performance outcomes contingent on doing a good job: competence, achievement, and self-realization.
Behavior Costing at SYSCO: The Value-Profit Chain
SYSCO, the largest food marketer and distributor in North America, illustrates the behavior-costing approach nicely. It began with a logical framework that describes how SYSCO creates value from its human capital. The framework is based on a service-profit-chain model developed earlier.45 That new model included a more descriptive explanation of the process of creating customer value, with a broader range than the service sector, per se. Figure 6-4 shows SYSCO’s model.
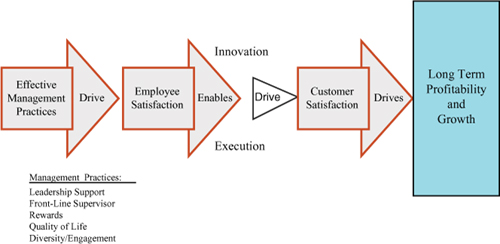
Figure 6-4. SYSCO’s value-profit chain.
Logic: The Causal Model
As Figure 6-4 shows, effective management practices drive employee satisfaction (and engagement). A satisfied and engaged workforce, in turn, enables a company to pursue excellence in innovation and execution. The logical proposition is that higher employee satisfaction-engagement drives innovation and execution, which, in turn, enhances customer satisfaction, customer purchasing behavior, and, eventually, long-term profitability and growth. Certainly, management needs to put in place systems, people, technology, and processes that will initiate and sustain innovation and execution—the principal components of an effective value-profit chain. Technology and processes are easily copied by competitors, but a highly skilled, committed, and fully engaged workforce is difficult to imitate.
Analytics: Connecting the Model to Management Behaviors
SYSCO’s basic management model—the set of practices that describe how the company seeks to engage the hearts and minds of employees with its employer brand—has been termed the 5-STAR management model.46 That model is all about taking care of people, extending the same respect to employees as managers do to their external customers. The framework is general enough to apply to any type of company structure or business model, and it gives businesses wide discretion in actual implementation. As Figure 6-4 shows, the five principles of the STAR model (“Management Practices” in Figure 6-4) are as follows:
• Ensuring that leaders offer direction and support
• Strengthening front-line supervisors
• Rewarding performance
• Addressing employees’ quality of life
• Including employees by engaging them and leveraging diversity
Although specific leadership and management practices that address each of the 5-STAR principles are beyond the scope of this chapter, we want to emphasize that employee attitudes are integral components of the STAR model because, as a set, those attitudes reflect employee satisfaction-engagement, a key component of the value-profit chain. At a broader level, Figure 6-4 shows how SYSCO creates value from its human capital. It shows clearly the intermediate linkages between employee attitudes and financial performance. Indeed, the logic of the model is so compelling that it is taught to every manager and employee from the first day on the job.
Measures
To measure the attitudes of its employees, SYSCO developed a work climate/employee engagement survey built around each of the 5-STAR principles. All members of each SYSCO operating company participate in a comprehensive annual self-assessment and impromptu and informal assessments on an as-needed basis.47 The total survey comprises 61 items, but SYSCO found that just 14 of them differentiated the top-performing 25 percent of its 147 operating companies from the bottom 25 percent. Table 6-2 shows these items.
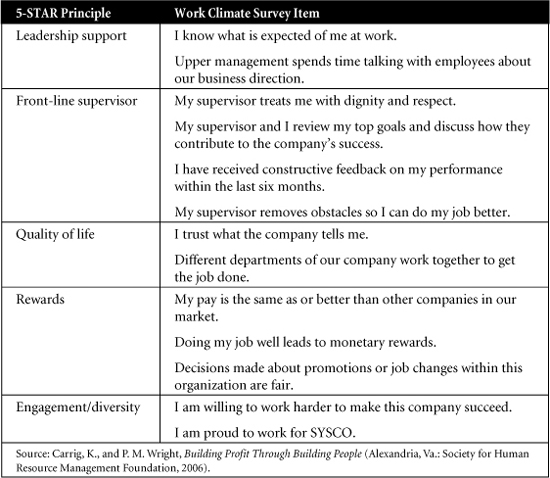
Table 6-2. The 14 Most “Impactful” Items from SYSCO’s Work Climate/Employee Engagement Survey
Source: Carrig, K., and P. M. Wright, Building Profit Through Building People (Alexandria, Va.: Society for Human Resource Management Foundation, 2006).
Consider just one of the items in Table 6-2, under “Front-line supervisor,” item #4: “My supervisor removes obstacles so I can do my job better.” A multiyear study of hundreds of knowledge workers in a variety of industries that tracked their day-to-day activities, emotions, and motivations through 120,000 journal entries strongly supports this driver of engagement. The study found that “workers reported feeling most engaged on days when they made headway or received support to overcome obstacles in their jobs.”48 They reported feeling least engaged when they hit brick walls. In short, small dents in work meant as much as large achievements.
Analytics Combined with Process: The SYSCO Web Portal for Managers
SYSCO has a decentralized organizational structure comprised of 147 autonomous operating companies. It employs an organization-wide rewards system to encourage managers of the autonomous operating companies to share information with each other and to transfer best practices within the organization. SYSCO built a “best business practices” web portal on its intranet to provide a platform for organization-wide improvement. The web architecture offered a framework for managers to do two things: share information on their own operating company’s successful practices and learn from the best practices of other SYSCO operating companies.
SYSCO also assesses the performance of each operating company in terms of balanced-scorecard metrics in four areas: financial, operational, human capital, and customer performance. Scores on the work climate/employee engagement survey comprise one element of the human capital metrics, along with measures of productivity (employees per 100,000 cases shipped) and employee retention (among marketing associates, drivers, and night warehouse employees). Managers of operating companies can use the “best business practices” portal to identify and learn from operating companies in the top quartile of performance on one or more metrics in the balanced scorecard.
As an example, consider the area of safety (specifically, the costs of workers’ compensation for work-related injuries). By leveraging best practices and shared, reciprocal visits among managers of its operating companies, SYSCO reduced the performance gap in workers’ compensation costs between the top and bottom 25 percent of operating companies, and it increased company-wide safety results by nearly 50 percent over a five-year period. As a result, SYSCO cut by half its overall cost of workers’ compensation as a percentage of sales. That represented a significant improvement in performance and an annual cost savings to the company of $36 million.49 Note that operating managers worked with the set of key metrics—operations, financial, customers, and human capital—to leverage best practices to reduce the costs of workers’ compensation. Work climate/employee engagement scores comprise only one element of human capital metrics, which, in turn, comprise only one component of the balanced scorecard. One cannot conclude that improvements in work climate/employee engagement scores alone contributed to reductions in the costs of workers’ compensation.
SYSCO’s in-house research also supports other links in the value-profit chain. Table 6-3 shows that SYSCO operating companies with the most satisfied employees consistently receive the highest scores from their customers and have higher retention of marketing associates and drivers.
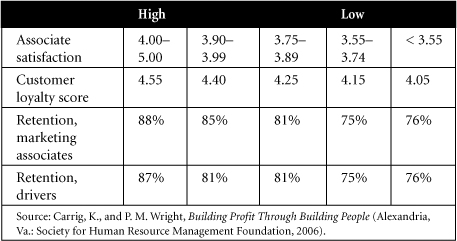
Table 6-3. Satisfied Employees Deliver Better Results
Source: Carrig, K., and P. M. Wright, Building Profit Through Building People (Alexandria, Va.: Society for Human Resource Management Foundation, 2006).
The data in Table 6-3 are tantalizing, but some important questions are left unanswered. Clearly, retention is higher in operating companies with better associate satisfaction-engagement. Although results for customer loyalty and employee retention are in the right direction (high/low customer loyalty systematically tracks with high/low employee retention), it is not clear that those results are statistically significant and, thus, whether they generalize beyond the particular situation. Furthermore, causes and effects are not clear. Does making employees more satisfied and engaged cause customers to be more loyal? Or is it more rewarding to work in operating companies with loyal customers, and, as a result, that employees who work there tend to be more satisfied and engaged? The information in Table 6-3 simply does not provide answers to those important questions. This is not meant to deny the tangible and important contributions of the SYSCO analysis. It does, however, suggest that continued improvements in logic, analytics, measures, and process are vital, even in advanced systems like SYSCO’s.
Translating the Analysis into Dollar Values
Table 6-3 does not include cost savings associated with improvements in the retention of marketing associates and drivers, but those cost savings were significant. We can use those retention numbers, along with the costing principles discussed in Chapter 4, to provide an example of the economic effect of attitudes.
In 2000, retention rates for these groups were 75 percent and 65 percent, respectively. By 2005, those retention rates improved to 88 percent and 87 percent, respectively. SYSCO then estimated the replacement and training costs of these three groups of employees as $50,000 per marketing associate and $35,000 per driver. Assuming 100 employees per business unit, from 2000 to 2005, each business unit saved (in terms of costs that were not incurred) $650,000 among marketing associates and $770,000 among drivers, for a total savings of $1.42 million. Corporate-wide savings in retention over all categories of employees from 2000 to 2005, assuming 10,000 employees, totaled $156.5 million.50 Such savings contributed to the firm’s long-term profitability and growth.
Integrating the Attitude-Analysis System into Organizational Systems
Today top executives at SYSCO meet on a quarterly basis to review the metrics. Their purpose is to see whether those numbers are, in fact, consistent with the operating expenses and the pretax earnings of each operating company, as well as with those of the corporation as a whole. What led SYSCO executives to pay attention to the human capital indices? HR researchers found a high multiple correlation (R2 = 0.46) between work climate/employee engagement scores, productivity, retention, and pretax earnings. This means that 46 percent of the variation in pretax earnings was associated with variation in the combination of these three employee-related variables.
In short, SYSCO leaders began to pay attention when they realized that the human capital indices served as indicators of financial results that the executives could see in their own operating companies. The relationship is lagged about six months, and although exact cause-effect relations have not been determined, the business model that the company uses assumes that employee satisfaction-engagement drives customer satisfaction, which drives long-term profitability and growth. In short, SYSCO has been able to determine not only what practices and processes are helping to drive the human capital indices, but also how those, in fact, influence the financial metrics over time. This led SYSCO to develop the business model shown earlier in Figure 6-4.
A Final Word
A number of challenges remain in relating attitudes to costs (see Table 6-4). Note that although the logic of the attitude-cost models shown in Table 6-4 is similar, the major differences lie in how much of the process chain each approach actually measures.
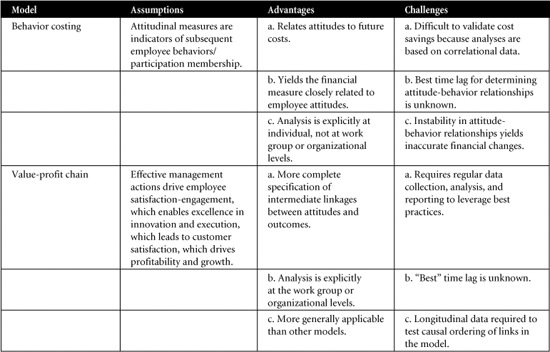
Table 6-4. Assumptions, Advantages, and Challenges of Attitude-Cost Models
Certainly, refinements are needed in the methods described here, but the potential of cost-benefit comparisons of attitude-behavior relationships is enormous. If organizations can develop compelling, logical frameworks that relate employee attitudes and employee engagement to financial outcomes, and if they can use sound analytics and measures to draw meaningful conclusions from their data, they can engage in a more rational decision-making process regarding where they should and should not make investments. Most important, they will be able to identify critical decision pivot points where this kind of information will make the biggest difference.
- Your boss has asked you for evidence that shows the link between employee attitudes such as job satisfaction, commitment, and engagement, and both individual and organizational outcomes. In other words, convince him that attitudes matter. What sort of evidence might you present?
- Develop a logic diagram that shows the common and unique outcomes that employee satisfaction, commitment, and engagement might be related to.
- What is SYSCO’s value-profit chain? Explain each link in the model and why it is important in understanding how management practices affect employee satisfaction-engagement, customer satisfaction, and, ultimately, long-term profitability and growth.
- You have read that SYSCO’s value-profit chain serves as a business model for the company. As a senior manager, respond to the following questions:
What implications might such a model have for recruitment, selection, orientation, training, performance management, and incentive compensation?
What practical issues have to be considered in deploying the model throughout the company?
- You are the CEO of a public relations company. You have just read about the 5-STAR management model in the value-profit chain and want to implement it in your company. Develop a detailed strategy for embedding the model into your organization’s culture.
References
1. Cascio, W. F., and C. Young, “Work-Family Balance: Does the Market Reward Firms That Respect It?” in From Work-Family Balance to Work-Family Interaction: Changing the Metaphor, ed. D. F. Halpern and S. E. Murphy (Mahwah, N.J.: Lawrence Erlbaum Associates, 2005).
2. See, for example, Edmans, A., “Does the Stock Market Fully Value Intangibles? Employee Satisfaction and Equity Prices,” (August 12, 2009), downloaded from http://ssrn.com/abstract=985735, May 28, 2010; Cappelli, P., “The Value of Being a Best Employer” (June 26, 2008), downloaded from www.hreonlne.com, June 26, 2008; and Watson, N. “Happy Companies Make Happy Investments,” Fortune (May 27, 2002), 162.
3. Fulmer, I. S., B. Gerhart, and K. S. Scott, “Are the 100 Best Better? An Empirical Investigation of the Relationship between Being a ‘Great Place to Work’ and Firm Performance,” Personnel Psychology 56 (2003): 965–993.
5. Filbeck, G., and D. Preece, “Fortune’s Best 100 Companies to Work for in America: Do They Work for Shareholders?” Journal of Business Finance & Accounting 30, no. 5 (2003): 771–797.
6. Vosburgh, R. M., “State-Trait Returns! And One Practitioner’s Request, Industrial and Organizational Psychology 1 (2008): 72–73.
7. Harter, J. K., and F. L. Schmidt, “Conceptual Versus Empirical Distinctions among Constructs: Implications for Discriminant Validity,” Industrial and Organizational Psychology 1 (2008): 36–39. See also Macey, W. H., and B. Schneider, “Engaged in Engagement: We Are Delighted We Did It,” Industrial and Organizational Psychology 1 (2008a): 76–83.
8. Society for Human Resource Management, Employee Job Satisfaction: Understanding the Factors That Make Work Gratifying (Alexandria, Va.: SHRM, 2009).
9. Macey, W. H., and B. Schneider, “The Meaning of Employee Engagement,” Industrial and Organizational Psychology 1 (2008b): 3–30.
10. Newman, D. A., and D. A. Harrison, “Been There, Bottled That: Are State and Behavioral Work Engagement New and Useful Construct ‘Wines’?,” Industrial and Organizational Psychology 1 (2008): 31–35. See also Harter and Schmidt, 2008.
11. Klein, H. J., J. C. Molloy, and J. T. Cooper, “Conceptual Foundations: Construct Definitions and Theoretical Representations of Workplace Commitments,” in Commitment in Organizations, ed. H. J. Klein, T. E. Becker, and J. P. Meyer (New York: Taylor & Francis, 2009). See also Mathieu, J. E., and D. M. Zajac, “A Review and Meta-analysis of the Antecedents, Correlates, and Consequences of Organizational Commitment,” Psychological Bulletin 108, no. 2 (1990): 171–194.
12. Carrig, K., and P. M. Wright, Building Profit through Building People: Making Your Workforce the Strongest Link in the Value-Profit Chain (Alexandria, Va.: Society for Human Resource Management, 2006).
13. Macey and Schneider, 2008; Harter and Schmidt, 2008; and Newman and Harrison, 2008.
14. Schaufeli, W. B., A. B. Bakker, and M. Salanova, “The Measurement of Work Engagement with a Short Questionnaire: A Cross-National Study,” Educational and Psychological Measurement 66 (2006): 701–716. See also Schaufeli, W. B., M. Salanova, V. González-Romá, and A. B. Bakker, “The Measurement of Engagement and Burnout: A Two-Sample Confirmatory Factor-Analytic Approach,” Journal of Happiness Studies 3 (2002): 71–92.
15. Salanova, M., S. Agut, and J. M. Peiroá, “Linking Organizational Resources and Work Engagement to Employee Performance and Customer Loyalty: The Mediation of Service Climate,” Journal of Applied Psychology 90 (2005): 1,216–1,227.
16. Aumann, K., and E. Galinsky, Families and Work Institute, 2008 National Study of the Changing Workforce. The State of Health in the American Workforce: Does Having an Effective Workplace Matter? New York: Families and Work Institute. Downloaded from www.familiesandwork.org/site/research/reports/HealthReport.pdf, June 1, 2010.
17. Brooks, S. M., J. W. Wiley, and E. L. Hause, “Using Employee and Customer Perspectives to Improve Organizational Performance,” in Customer Service Delivery, ed. L. Fogli (San Francisco: Jossey-Bass, 2006); Cohen, A. “Organizational Commitment and Turnover: A Meta-analysis,” Academy of Management Journal 36 (1993): 1,140–1,157; Ostroff, C., “The Relationship between Satisfaction, Attitudes, and Performance: An Organizational-Level Analysis,” Journal of Applied Psychology 77 (1992): 963–974; Ryan, A. M., M. J. Schmit, and R. Johnson, “Attitudes and Effectiveness: Examining Relations at an Organizational Level,” Personnel Psychology 49 (1996): 853–883; Rogg, K. L., D. B. Schmidt, C. Shull, and N. Schmitt, “Human Resource Practices, Organizational Climate, and Customer Satisfaction,” Journal of Management 27 (2001): 431–449; and Schaufeli, W., and A. B. Bakker, “Job Demands, Job Resources, and Their Relationship with Burnout and Engagement: A Multi-sample Study,” Journal of Organizational Behavior 25 (2004): 293–315.
18. Macey and Schneider, 2008a.
19. Griffin, M. A., S. K. Parker, and A. Neal, “Is Behavioral Engagement a Distinct and Useful Construct?,” Industrial and Organizational Psychology 1 (2008): 48–51.
20. Graen, G., “Enriched Engagement through Assistance to Systems Change: A Proposal,” Industrial and Organizational Psychology 1 (2008): 74–75.
21. Macey and Schneider, 2008b.
22. Schneider, B., S. S. White, and M. C. Paul, “Linking Service Climate and Customer Perceptions of Service Quality: Test of a Causal Model,” Journal of Applied Psychology 83 (1998): 150–163.
24. Rucci, A. J., S. P. Kirn, and R. T. Quinn, “The Employee-Customer-Profit Chain at Sears,” Harvard Business Review 76 (January/February 1998): 82–97.
25. Corporate Voices for Working Families, “Business Impacts of Flexibility: An Imperative for Expansion,” November 2005, downloaded from www.cvworkingfamilies.org/system/files/Business%20Impacts%20of%20Flexibility.pdf, June 1, 2010.
26. Feldman, J. M., and J. G. Lynch, Jr. “Self-Generated Validity and Other Effects of Measurement on Belief, Attitude, Intention, and Behavior,” Journal of Applied Psychology 73 (1988): 421–435; and Olson, J. M., and G. R. Maio, “Attitudes in Social Behavior,” in Handbook of Psychology, Volume. 5, Personality and Social Psychology, ed. T. Millon and M. J. Lerner (Hoboken, N.J.: Wiley, 2003).
27. Parker, S. K. “Job Satisfaction,” in Encyclopedia of Industrial and Organizational Psychology, Volume 1, S. ed. G. Rogelberg (Thousand Oaks, Calif.: Sage, 2007). See also Balzer, W. K., and J. Z. Gillespie, “Job Satisfaction Measurement,” in Encyclopedia of Industrial and Organizational Psychology, Volume 1, ed. S. G. Rogelberg (Thousand Oaks, Calif.: Sage, 2007).
28. Allen, N. J., “Organizational Commitment,” in Encyclopedia of Industrial and Organizational Psychology, Volume 2, ed. S. G. Rogelberg (Thousand Oaks, Calif.: Sage, 2007).
29. Mowday, R. T., R. M. Steers, and L. W. Porter, “The Measurement of Organizational Commitment,” Journal of Vocational Behavior 14 (1979): 224–247.
30. The Gallup Q12 Employee Engagement Questionnaire, downloaded from www.shrm.org/Publications/hrmagazine/EditorialContent/2010/0510/Pages/0510fox3.aspx, May 19, 2010. See also Harter, J. K., F. L. Schmidt, and T. L. Hayes, “Business-Unit-Level Relationship between Employee Satisfaction, Employee Engagement, and Business Outcomes: A Meta-analysis,” Journal of Applied Psychology 87 (2002): 268–279.
32. Schaufeli, Bakker, and Salanova, 2006.
33. Pil, F. K., and J. P. MacDuffie, “The Adoption of High-Improvement Work Practices,” Industrial Relations 35, no. 3 (1996): 423–455.
34. Schneider, B., P. J. Hanges, D. B. Smith, and A. N. Salvaggio, “Which Comes First: Employee Attitudes or Organizational Financial and Market Performance?,” Journal of Applied Psychology 88, no. 5 (2003): 836–851.
35. Ryan, et al., 1996; Schneider, White, and Paul, 1998.
36. Micco, L., “Gallup Study Links Worker Beliefs, Increased Productivity,” HR News (September 1998), 17.
37. Harter, Schmidt, and Hayes, 2002.
38. Fox, A., “Raising Engagement,” HR Magazine (May 2010), 35–40.
39. Pugh, S. D., and J. Dietz, “Employee Engagement at the Organizational Level of Analysis,” Industrial and Organizational Psychology 1 (2008): 44–47.
40. Schneider, Hanges, Smith, and Salvaggio, 2003.
41. Mirvis, P. H., and E. E. Lawler III, “Measuring the Financial Impact of Employee Attitudes,” Journal of Applied Psychology 62 (1977): 1–8.
42. March, J. G., and H. A. Simon, Organizations, 2nd ed. (New York: Wiley, 1993).
43. Lawler, E. E., Motivation in Work Organizations (San Francisco, Calif.: Jossey-Bass, 1994).
44. Vroom, V. H., Work and Motivation (New York: Wiley, 1964).
45. Heskett, J. L., T. O. Jones, G. W. Loveman, W. E. Sasser, Jr., and L. A. Schlesinger, “Putting the Service-Profit Chain to Work,” Harvard Business Review 72 (March/April 1994): 164–174.