
Chapter 7. Investigate Project Monitoring and Controlling
This chapter covers the following PMP exam topics:
![]() Monitor and Control Project Work—4.4
Monitor and Control Project Work—4.4
![]() Perform Integrated Change Control—4.5
Perform Integrated Change Control—4.5
![]() Validate Scope—5.5
Validate Scope—5.5
![]() Control Scope—5.6
Control Scope—5.6
![]() Control Schedule—6.7
Control Schedule—6.7
![]() Control Costs—7.4
Control Costs—7.4
![]() Control Quality—8.3
Control Quality—8.3
![]() Control Communications—10.3
Control Communications—10.3
![]() Control Risks—11.6
Control Risks—11.6
![]() Control Procurements—12.3
Control Procurements—12.3
![]() Control Stakeholder Engagement—13.4
Control Stakeholder Engagement—13.4
(For more information on the PMP exam topics, see “About the PMP Exam” in the Introduction.)
Monitoring and controlling refers to all the activities and processes necessary to successfully manage a project and its associated risks. For the PMP exam, monitoring and controlling relates to 11 out of the 47 project management processes defined in the PMBOK.
In essence, monitoring and controlling is all the effective activities that a project manager performs to keep project performance and resource utilization at optimal levels. The magnitude and frequency of these activities are dictated by the size and organizational impact of a project. No matter the size of a project, there are three core elements that support effective monitoring and controlling:
![]() Effective definition of the project baseline and milestones
Effective definition of the project baseline and milestones
![]() Effective tracking of project activities and resource utilization
Effective tracking of project activities and resource utilization
![]() Effective risk definition for proposed corrective or preventive actions
Effective risk definition for proposed corrective or preventive actions
The following sections address the various processes associated with monitoring and controlling and how these processes ensure that a project stays on track.
The monitoring and controlling process group questions comprise 25% of the PMP exam. Although that’s not as many questions as a couple other process groups, it still demands a respectable amount of attention.
Integration and Scope Management
![]() Monitor and Control Project Work—4.4
Monitor and Control Project Work—4.4
![]() Perform Integrated Change Control—4.5
Perform Integrated Change Control—4.5
![]() Validate Scope—5.5
Validate Scope—5.5
![]() Control Scope—5.6
Control Scope—5.6
1. What is a corrective action?
![]() A. An action to correct something in a project
A. An action to correct something in a project
![]() B. An action that fixes the requisition process
B. An action that fixes the requisition process
![]() C. An action that brings future project events into alignment with the project plan
C. An action that brings future project events into alignment with the project plan
![]() D. Both B and C
D. Both B and C
2. Which type of diagram is most helpful in determining the root cause of project plan variances?
![]() A. Control chart
A. Control chart
![]() B. Ishikawa diagram
B. Ishikawa diagram
![]() C. Responsibility assignment matrix
C. Responsibility assignment matrix
![]() D. Histogram
D. Histogram
3. Which of the following is a tool and technique for the perform integrated change control process?
![]() A. Facilitated workshops
A. Facilitated workshops
![]() B. Questionnaires and surveys
B. Questionnaires and surveys
![]() C. Meetings
C. Meetings
![]() D. Prototypes
D. Prototypes
4. Which of the following is NOT an output of the control scope process?
![]() A. Accepted deliverables
A. Accepted deliverables
![]() B. Work performance information
B. Work performance information
![]() C. Change requests
C. Change requests
![]() D. Project management plan updates
D. Project management plan updates
1. Answer C is correct. Remember that for the PMP exam, you are looking for the best possible answer. As per the PMBOK Guide, Fifth Edition, the best possible answer is C. Answer A is accurate, but it is not the best possible answer. Answer B is the result of a corrective action, but it is not the definition of what a corrective action is.
2. Answer B is correct. An Ishikawa diagram, also called a cause-and-effect diagram, is used to determine the root cause of an outcome.
3. Answer C is correct. Meetings are a tool and technique for the perform integrated change control process. All other answers are tools and techniques for the collect requirements process.
4. Answer A is correct. Accepted deliverables is an output of the validate scope process. All other answers are tools and techniques for the control scope process.
The monitoring and controlling process group addresses 9 of the 10 PMI knowledge areas, permeating nearly all aspects of a project. The activities in this process group help to prescribe a measured and controlled project execution environment.
Note
Why is monitoring and controlling important? In general, all project failures and cancellations can be traced back to lack of effective controls in one or more of these areas: scope, cost, quality, and risk management.
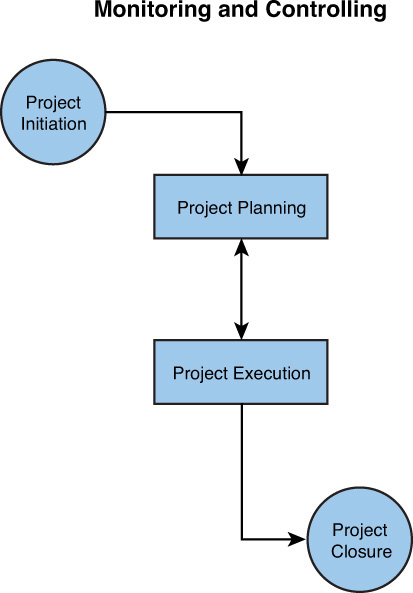
Figure 7.1 shows how the process groups of the project management methodology are related. You can see that all of them must be monitored and controlled for effective project completion. Note, however, that Figure 7.1 only shows a single closing iteration. Remember that closing can occur at every phase in a multi-phase project. It doesn’t happen only once in all cases.
Factors That Cause Project Change
To effectively monitor and control a project, a project manager must prepare organizational processes that work like sentinels on the fence. These sentinels help the project manager identify events (people, cultural, or strategic) that might force a change to the project or the environment where the project is executing. In other words, your project will be influenced by elements outside its normal execution and identified risks. These processes can include elements such as
![]() Execution trend analysis
Execution trend analysis
![]() Risk trigger management
Risk trigger management
![]() Forecast reports (like weather forecasts)
Forecast reports (like weather forecasts)
![]() Work package progress status and variances reports
Work package progress status and variances reports
![]() Lessons learned from similar projects
Lessons learned from similar projects
![]() Best practices
Best practices
![]() Corporate strategy committee resolutions
Corporate strategy committee resolutions
These are some examples of project control processes and their elements:
![]() You could use earned value analysis to determine how your project is performing against the planned activities, schedule, and cost.
You could use earned value analysis to determine how your project is performing against the planned activities, schedule, and cost.
![]() You can prescribe corrective or preventive actions after performing trend analysis in work packages variances.
You can prescribe corrective or preventive actions after performing trend analysis in work packages variances.
![]() You can identify a potential project change request after evaluating defect and frequency control charts.
You can identify a potential project change request after evaluating defect and frequency control charts.
![]() When executing enterprise projects, you can arrange a monthly meeting with the company CEO to discuss progress and new corporate initiatives.
When executing enterprise projects, you can arrange a monthly meeting with the company CEO to discuss progress and new corporate initiatives.
Note
Monitoring and controlling is an iterative group of processes. Milestones tend to have a compilation of work packages and deliverables under them. If you monitor and control activities only at their completion, you might not learn of problems until late in the project. Like the autopilot in an airplane, the main function of project control is to make frequent minor course corrections instead of waiting until you are far off the planned course.
Monitor and Control Project Work
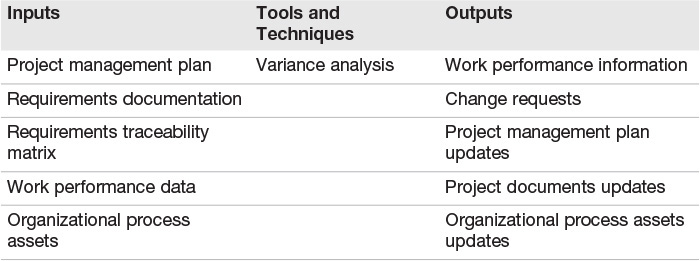
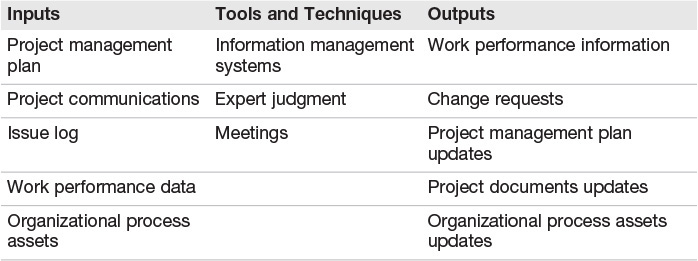
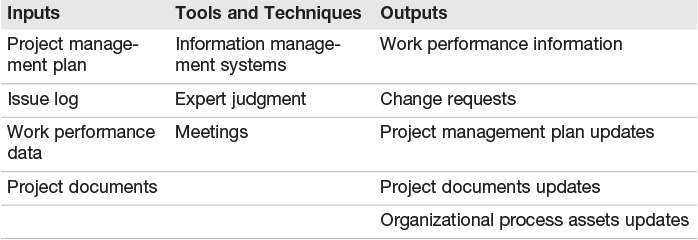
The monitor and control project work process is the first process in the monitoring and controlling process group. This process formally specifies what the project manager requires as inputs to properly monitor and control the project execution activities. As with all other PMI processes, the monitor and control project work process also defines the tools and techniques that are used and the expected outputs of the process. Table 7.1 shows the inputs, tools and techniques, and outputs for the monitor and control project work process.
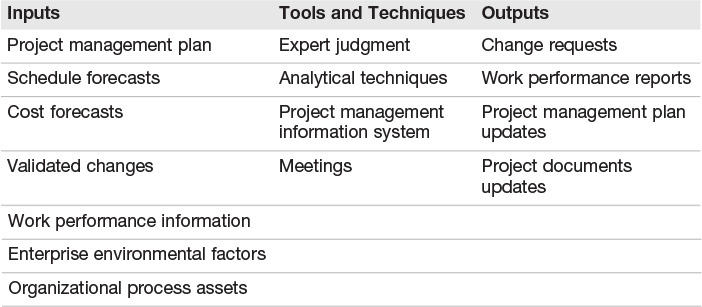
As you can see, this process is a high-level process that requires expert judgment on the part of the project manager to assess whether the project is within the constraints of the plan. Any deviations require intervention or requests for changes to the plan.
Perform Integrated Change Control
When an opportunity for change is identified, the project manager must make time to acknowledge the request for change, evaluate its associated risks, and consider its potential not just to the timeline but also to scope, cost, staff, quality, make-or-buy decisions, and communication. The perform integrated change control process helps identify whether a requested change is gold plating or whether it has a direct effect on the project deliverables and its return on investment.
ExamAlert
What is gold plating? Gold plating is a change to a project or a work package within a project that has not gone through an adequate change control management process. Such requests often initiate from informal requests. Ensure that all change requests are routed through the formal procedures.
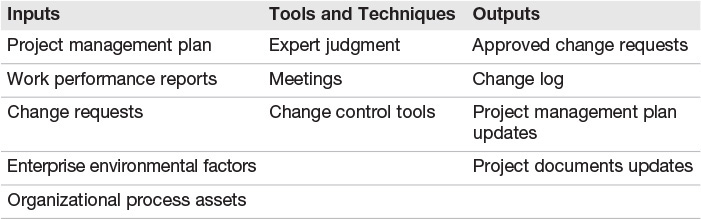
Table 7.2 shows the inputs, tools and techniques, and outputs for the perform integrated change control process.
After you determine that a proposed change has merit and supports the project objectives, the change request is submitted to the change control board for final determinations. For the most part, the interaction with the change control board is defined in the planning stage and can remain in place until the completion of the project. In the event that the organization has a project management office, the members of the change control board can change to accommodate strategic impact or affected areas in the project organization.
Note
What is a change control board? A change control board is an enterprise decision-making body tasked with approving the changes to projects or their impact in strategic initiatives.
In addition, you should monitor any trends in requested changes that could indicate inadequate requirements definition in the planning stage of your project.
The Project Feedback Loop
Earlier chapters discussed the five distinct PMI process groups: initiating, planning, executing, monitoring and controlling, and closing. But what of the external changes that occur during the execution of a project? This is where iterative information gathering and dissemination processes serve as information feedback loops.
One of the challenges of the traditional linear methodology approaches is that they do not clearly provide methods to incorporate organizational changes midstream and do not verify their range to target impacts. In other words, a project without feedback loops makes the assumption that nothing outside the project will change throughout the life of the project; the requirements will not change or are frozen.
Note
A project with frozen structure and processes is likely to encounter problems or even fail because it does not take into account any discoveries or organizational changes that might occur during its execution.
Remember that enterprise changes can have a direct effect on the viability of a project. Some examples of events that you might want to be made aware of in advance are
![]() A hostile takeover
A hostile takeover
![]() A divestment of a business unit
A divestment of a business unit
![]() Personnel or resource availability reduction
Personnel or resource availability reduction
![]() A corporate relocation
A corporate relocation
Validating and Controlling Project Scope
The scope management knowledge area defines two processes in the monitoring and controlling process group. The first process, validate scope, is the formal process of accepting project deliverables. It provides a mechanism to verify that deliverables meet or exceed project requirements. The second process, control scope, is the process of managing the project’s status and any changes to the scope baseline. Let’s look at each of the processes individually.
The validate scope process provides a project manager with a formal process to classify deliverables as acceptable or unacceptable. Table 7.3 shows the inputs, tools and techniques, and outputs for the validate scope process.
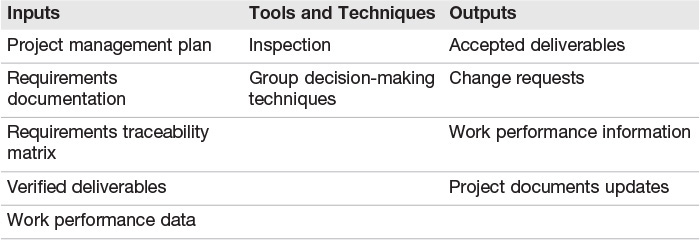
One output of the validate scope process is the collection of change requests. These requests are individually addressed through the perform integrated change control process and might result in approved change requests.
Pay attention to how the outputs of processes are used as inputs to other processes. As you just saw with change control, processes in the executing process group and the monitoring and controlling process group are intermingled. In other words, processes are not just ordered by their PMI section number. The actual flow is important. Know how PMI process outputs and inputs match up.
The next process in the monitoring and controlling process group is the control scope process. This process monitors and controls all changes to the scope baseline to ensure that the changes are being handled in a structured manner. Table 7.4 shows the inputs, tools and techniques, and outputs for the control scope process.
A primary component of the project management plan is the scope baseline. The scope baseline defines the project scope and its associated deliverables, and it documents the acceptance parameters of the final product. This baseline helps in clarifying any details that might have been left in a to-be-determined (TBD) mode during the project initiation phase or items that require further clarification with the project sponsor or its stakeholders. The project process indicators in this process are
![]() The work breakdown structure (WBS)
The work breakdown structure (WBS)
![]() Work package progress reports
Work package progress reports
What is a work breakdown structure? A work breakdown structure (WBS) decomposes a project’s work into manageable chunks or work packages.
What is a work package? A work package is the lowest descriptive level in a WBS.
The idea behind effectively defining the WBS is to create the roadmap that defines all the activities that will be executed to accomplish the project goal.
The WBS is an element that changes with the passage of time and resource utilization. Why? As you perform the tasks outlined in your baseline, the recorded changes accommodate any differences between the planned theory and the actual execution.
An effective WBS assists the stakeholders in understanding the activities and events that help in delivering the project promise, as well as outlining internal and external resource use. The entire project execution team looks at the WBS to inquire about present, past, and future deliverables and their effectiveness.
Due to the nature and importance of the WBS, its creation should not be taken lightly. It must be considered as the one element that all project participants might want to have considered when formulating an opinion.
1. The change control system is a subsystem of what?
![]() A. Configuration management
A. Configuration management
![]() B. Project management
B. Project management
![]() C. Risk management
C. Risk management
![]() D. Scope management
D. Scope management
2. Approved change requests can cause a change to which of the following project elements?
![]() A. Scope
A. Scope
![]() B. Quality
B. Quality
![]() C. Schedule
C. Schedule
![]() D. All of the above
D. All of the above
3. Which of the following best describes the monitor and control project work process?
![]() A. Tracking, reviewing, and regulating the progress made toward fulfilling project objectives
A. Tracking, reviewing, and regulating the progress made toward fulfilling project objectives
![]() B. Performing the work defined in the project management plan
B. Performing the work defined in the project management plan
![]() C. Reviewing change requests, approving change requests, and managing changes to the project
C. Reviewing change requests, approving change requests, and managing changes to the project
![]() D. Monitoring the status of the project and product scope, as well as changes to the scope baseline
D. Monitoring the status of the project and product scope, as well as changes to the scope baseline
4. Which of the following is NOT a valid output of the validate scope process?
![]() A. Accepted deliverables
A. Accepted deliverables
![]() B. Project management plan updates
B. Project management plan updates
![]() C. Change requests
C. Change requests
![]() D. Project document updates
D. Project document updates
1. Answer A is the correct response. The change control system is a subsystem of the configuration management system and, according to the PMBOK, is defined as “a collection of formal documented procedures that define how project deliverables and documentation will be controlled, changed, and approved.”
2. Answer D is the best response. Approved change requests can cause a change to project scope, project quality, and project schedule.
3. Answer A is the best response. The monitor and control project work process tracks, reviews, and regulates the progress made toward fulfilling the project objectives. Answer B is incorrect because it describes the direct and manage project work process. Answer C is incorrect because it describes the perform integrated change control process. Answer D is incorrect because it describes the control scope process.
4. Answer B is correct. Project management plan updates is an output of the control scope process. All other answers are valid outputs of the validate scope process.
![]() Control Costs—7.4
Control Costs—7.4
![]() Control Quality—8.3
Control Quality—8.3
1. What can you tell about a project with a CPI of 1.6?
![]() A. A critical path index of 1.6 means the project is falling behind.
A. A critical path index of 1.6 means the project is falling behind.
![]() B. A central performance index of 1.6 means the project is running ahead of schedule.
B. A central performance index of 1.6 means the project is running ahead of schedule.
![]() C. A control performance index of 1.6 means the project is using fewer resources than anticipated.
C. A control performance index of 1.6 means the project is using fewer resources than anticipated.
![]() D. A cost performance index of 1.6 means the project is consuming fewer resources than anticipated.
D. A cost performance index of 1.6 means the project is consuming fewer resources than anticipated.
2. What does an SPI of 1.6 mean?
![]() A. Each resource assigned to the project costs 1.6 units.
A. Each resource assigned to the project costs 1.6 units.
![]() B. A scope performance index of 1.6 suggests that the project is running ahead of the schedule.
B. A scope performance index of 1.6 suggests that the project is running ahead of the schedule.
![]() C. A schedule performance index of 1.6 suggests that the project is running ahead of the schedule.
C. A schedule performance index of 1.6 suggests that the project is running ahead of the schedule.
![]() D. None of the above
D. None of the above
3. Which of the following is NOT an output of the control quality process?
![]() A. Quality metrics
A. Quality metrics
![]() B. Validated changes
B. Validated changes
![]() C. Validated deliverables
C. Validated deliverables
![]() D. Change requests
D. Change requests
1. Answer D is correct. A cost performance index of 1 or greater suggests that the project is delivering more with less money.
2. Answer C is correct. A schedule performance index of 1 or greater suggests that the project is ahead of schedule.
3. Answer A is correct. Quality metrics is an output of the plan quality process. All other answers are valid outputs of the control quality process.
After a project enters the executing phase, work is performed to produce the project’s deliverables. All work should be performed according to the project schedule, budget, and quality standards. But is it? Is the project schedule accurate, and is the work being performed at the planned time? Is the project costing more than planned? Is the quality of the deliverables sufficient? These questions must be answered to keep the project on track. The processes in the time, cost, and quality management knowledge areas ensure that the project stays on schedule and on budget and that the project produces deliverables of the necessary quality.
Manage the Project Schedule and Budget
Two processes monitor and control how project work is progressing with respect to the project schedule and budget. The first process, control schedule, ensures that project work is being carried out according to the planned schedule. Table 7.5 shows the inputs, tools and techniques, and outputs for the control schedule process.
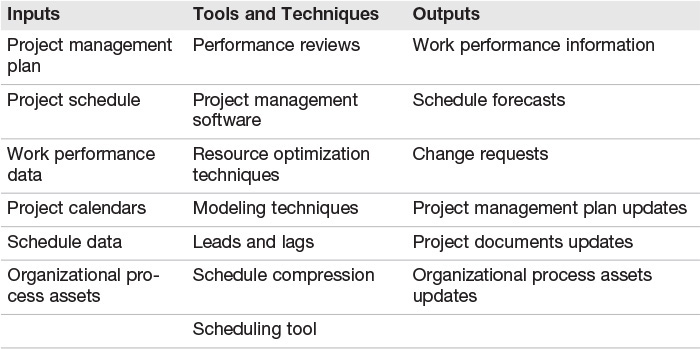
The control schedule process identifies any departures from the project schedule. What happens if work is falling behind? Your recourse is to implement corrective or preventive actions or a change request to align the project execution with its expected results and timelines.
A corrective or preventive action is an action that is implemented to bring future project events and tasks into alignment with the project plan and its baseline.
Some options available at this time could be to
![]() Update the project baseline to reflect the current situation, using the documented change process.
Update the project baseline to reflect the current situation, using the documented change process.
![]() Level resources. When possible, reassign over-allocated resources to avoid schedule conflicts.
Level resources. When possible, reassign over-allocated resources to avoid schedule conflicts.
![]() Crash the schedule. Add people (internal/external) or resources to the tasks that have fallen behind and have a direct effect on the critical path; the downside is that this might cause unscheduled expenses.
Crash the schedule. Add people (internal/external) or resources to the tasks that have fallen behind and have a direct effect on the critical path; the downside is that this might cause unscheduled expenses.
![]() Fast track. Rearrange your activities to perform activities in parallel.
Fast track. Rearrange your activities to perform activities in parallel.
![]() Outsource the project or the affected part.
Outsource the project or the affected part.
![]() Reduce the scope of the project.
Reduce the scope of the project.
The second process, control costs, ensures that the work is occurring within the project budget and identifies any variances early in the process. Table 7.6 shows the inputs, tools and techniques, and outputs for the control costs process.
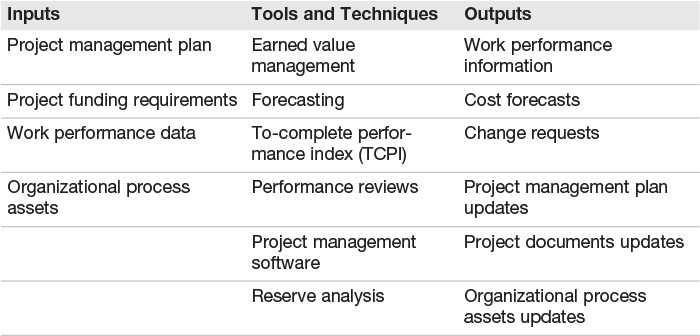
The control costs process identifies any areas that are costing more than planned. As a project moves toward completion, the value of the project’s deliverables changes. The “value” of a project at any point in time is known as its earned value. One method of comparing the earned value of a project to the budget is earned value analysis.
Note
What is earned value analysis? Earned value analysis in its simplest form is the value of the work performed to date against the project baseline expectations. The steps to calculating earned value (and other project-related values) are covered in the “Identifying Variance with Earned Value Management” section, later in this chapter.
Remember that the whole idea behind a corrective or preventive action is to help preserve the healthy execution of your project and maximize its resource utilization.
The following are some of the items used to measure and keep control of the schedule and cost variances:
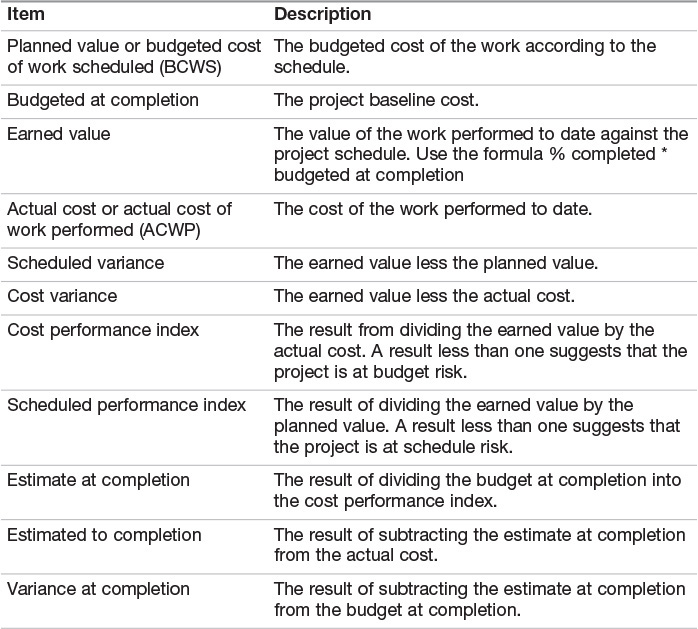
Identifying Variance with Earned Value Management
Earned value analysis is a tool used to help in identifying how well a team is performing and where the project might end up in comparison to the project plan. It was initially conceived by the U.S. Department of Defense (DoD) as a tool to standardize the way contractors report on the progress of their assigned projects.
The three key variables involved in the project earned value analysis are
![]() Budgeted cost for work scheduled (BCWS)
Budgeted cost for work scheduled (BCWS)
![]() Budgeted cost for work performed (BCWP)
Budgeted cost for work performed (BCWP)
![]() Actual cost for work performed (ACWP)
Actual cost for work performed (ACWP)
ExamAlert
BCWS is also referred to as planned value. The total BCWS or planned value for a project can be called the budget at completion (BAC).
ACWP is also referred to as actual cost (AC).
BCWP is also referred to as earned value (EV).
To successfully report on earned value management, your project must have a well-defined WBS and an effective task planned versus actual performance reporting system.
A basic utilization example is as follows:
The budgeted cost for work scheduled (BCWS) is the planned value of the work according to the project budget. The BCWS of a project with 12 milestones and 144 work packages is $200,000, and the cost for every 3 milestones has been estimated to be $50,000.
The actual cost for work performed (ACWP) is how much you really have incurred in the project. In this example, you are at milestone 6, and the project has used $80,000; therefore, your ACWP is $80,000.
The budgeted cost for work performed (BCWP) is the value of how much work has been completed. So while your ACWP is $80,000, your BCWP is $100,000.
Armed with this information, you can determine derivative calculations such as the schedule performance index (SPI) and the cost performance index (CPI). In this example, it would be
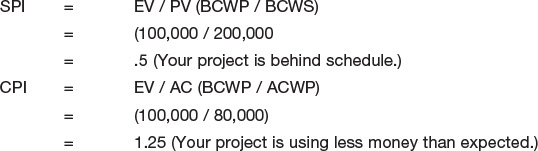
Control Quality
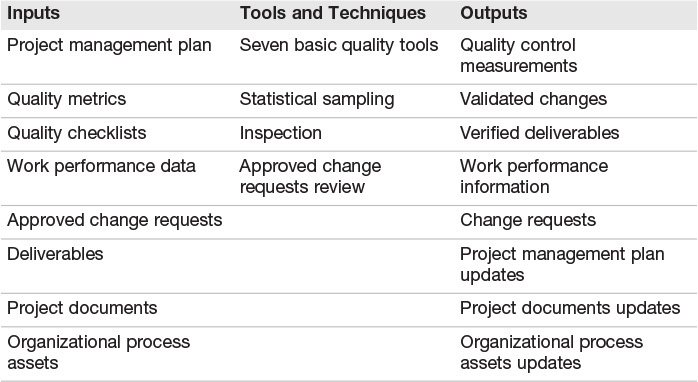
In the project context, quality is not only defined as delivering the right thing at the right time and at the right cost but also delivering to customer expectations. Therefore, you, the project manager, have to ensure that the required metrics, tolerances, reports, and checklists are in place to ensure that a quality-prone execution and delivery sandbox is in place. The control quality process enables a project manager to assess the level of quality of a project’s deliverables and take any required action. Table 7.7 shows the inputs, tools and techniques, and outputs for the control quality process.
Some of the tools available to a project manager in controlling quality are
![]() The Ishikawa (also called the fishbone or cause-and-effect) diagram
The Ishikawa (also called the fishbone or cause-and-effect) diagram
![]() Control charts, such as the ones available using Three Sigma or Six Sigma:
Control charts, such as the ones available using Three Sigma or Six Sigma:
![]() Six Sigma—99.99% defect free, or about 0.002 defective parts per million
Six Sigma—99.99% defect free, or about 0.002 defective parts per million
![]() Three Sigma—99.73% defect free, or about 2,700 defective parts per million
Three Sigma—99.73% defect free, or about 2,700 defective parts per million
![]() Pareto charts (the 80/20 rule)
Pareto charts (the 80/20 rule)
![]() Statistical sampling, such as that used in the standard audit processes
Statistical sampling, such as that used in the standard audit processes
Diagrams and Charts Used to Measure Quality Control
The three diagrams that follow are typically used to help monitor quality control:
![]() Ishikawa diagram—This diagram type can be easily identified because it resembles fishbones. It is used to determine the root cause of a defect (see Figure 7.2).
Ishikawa diagram—This diagram type can be easily identified because it resembles fishbones. It is used to determine the root cause of a defect (see Figure 7.2).
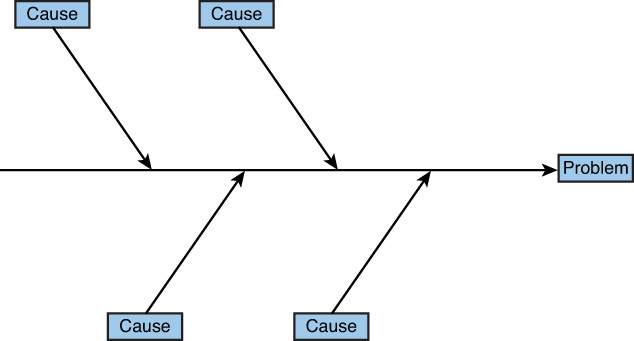
Remember that a product or task defect is a symptom, but not the cause, of the problem. A fishbone diagram is effective in graphically displaying what might be causing a problem at the end of the production line.
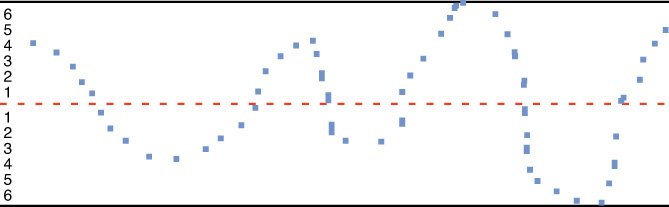
![]() Control chart—A control chart is a statistical tool used to identify process points that are outside the normal flow of a process. They help to graphically display process execution boundaries, trending, and overall performance over time (see Figure 7.3).
Control chart—A control chart is a statistical tool used to identify process points that are outside the normal flow of a process. They help to graphically display process execution boundaries, trending, and overall performance over time (see Figure 7.3).
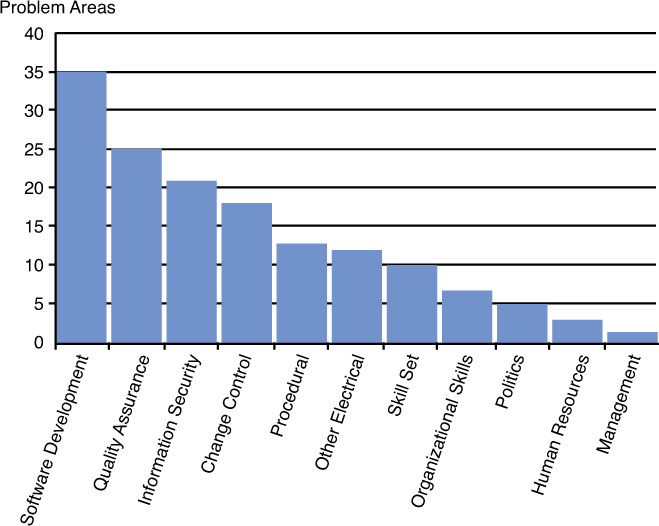
![]() Pareto chart—Vilfredo Pareto postulated that the distribution of income and wealth follows a regular logarithmic pattern where 20% of the population controls 80% of the wealth. Subsequently in 1937, Dr. Joseph M. Juran adapted Pareto’s economic observations to business applications, which he called the “vital few and trivial many.” Translated to project terms, 80% of the problems are caused by 20% of the activities. This is called the 80/20 rule, and a Pareto chart reflects this rule (see Figure 7.4).
Pareto chart—Vilfredo Pareto postulated that the distribution of income and wealth follows a regular logarithmic pattern where 20% of the population controls 80% of the wealth. Subsequently in 1937, Dr. Joseph M. Juran adapted Pareto’s economic observations to business applications, which he called the “vital few and trivial many.” Translated to project terms, 80% of the problems are caused by 20% of the activities. This is called the 80/20 rule, and a Pareto chart reflects this rule (see Figure 7.4).
1. The activity that is most concerned with the current status of the project schedule is
![]() A. Project time management
A. Project time management
![]() B. Project risk management
B. Project risk management
![]() C. Monitoring and controlling
C. Monitoring and controlling
![]() D. Control schedule
D. Control schedule
![]() E. Both C and D
E. Both C and D
2. The Ishikawa diagram, control chart, Pareto chart, and statistical sampling are examples of tools used in
![]() A. The assure quality process
A. The assure quality process
![]() B. The control quality process
B. The control quality process
![]() C. Six Sigma
C. Six Sigma
![]() D. None of the above
D. None of the above
3. The most commonly used performance measure for evaluating whether work is being completed as planned at any given point in a project is which of the following?
![]() A. Cost variance (CV)
A. Cost variance (CV)
![]() B. Schedule variance (SV)
B. Schedule variance (SV)
![]() C. Both A and B
C. Both A and B
![]() D. Neither A nor B
D. Neither A nor B
4. You’re managing a project using the earned value technique (EVT) for cost management. The project planned value (PV) is $200,000. The project earned value (EV) is $100,000. The actual value (AV) is $150,000. What is the cost variance (CV) for the project?
![]() A. 100,000
A. 100,000
![]() B. –100,000
B. –100,000
![]() C. 50,000
C. 50,000
![]() D. –50,000
D. –50,000
1. Answer D is correct. One of the control schedule deliverables is to determine the current status of the project schedule.
2. Answer B is correct. The Ishikawa diagram, control chart, Pareto chart, and statistical sampling are examples of basic tools of the control quality process.
3. Answer C is the best response. The most commonly used performance measures for evaluating whether work is being completed as planned at any given time in a project are cost variance (CV) and schedule variance (SV). Answers A and B are both individually correct, but Answer C is the best answer. Answer D is incorrect.
4. Answer D is the correct response. Cost variance (CV) is calculated by subtracting the actual cost (AC) from the earned value (EV): CV = EV – AV. In the example given, the AC is $150,000, and the EV is $100,000. Therefore, $100,000 – $150,000 = –$50,000. Answer A is incorrect. Answer B is the schedule variance (SV), not the CV, so it is incorrect. Answer C is incorrect.
![]() Control Risks—11.6
Control Risks—11.6
![]() Control Procurements—12.3
Control Procurements—12.3
![]() Control Stakeholder Engagement—13.4
Control Stakeholder Engagement—13.4
1. What is the communication channel delta if the stakeholders are increased from 4 to 11?
![]() A. 6
A. 6
![]() B. 49
B. 49
![]() C. 55
C. 55
![]() D. 109
D. 109
2. In general, performance reporting takes into account information from the following areas EXCEPT
![]() A. Scope
A. Scope
![]() B. Schedule
B. Schedule
![]() C. Execution
C. Execution
![]() D. Cost
D. Cost
![]() E. Quality
E. Quality
3. Which of the following is NOT a tool and technique of the control risks process?
![]() A. Risk audits
A. Risk audits
![]() B. Variance and trend analysis
B. Variance and trend analysis
![]() C. Contingent response strategies
C. Contingent response strategies
![]() D. Reserve analysis
D. Reserve analysis
4. Which of the following best describes the control procurements process?
![]() A. Obtaining seller responses, selecting a seller, and awarding a contract
A. Obtaining seller responses, selecting a seller, and awarding a contract
![]() B. Managing procurement relationships, monitoring contract performance, and making necessary changes
B. Managing procurement relationships, monitoring contract performance, and making necessary changes
![]() C. Reviewing change requests, approving change requests, and managing changes to the project
C. Reviewing change requests, approving change requests, and managing changes to the project
![]() D. Documenting purchasing decisions, specifying the approach, and selecting potential sellers
D. Documenting purchasing decisions, specifying the approach, and selecting potential sellers
1. Answer B is correct. The communication channels calculation is (n * (n – 1)) / 2. In this case, the initial number of communication channels is 6, and the second is 55. Therefore, 55 – 6 = 49.
2. Answer C is correct. Project performance reporting takes into account trending and exceptions in the project scope, schedule, cost, and quality.
3. Answer C is correct. Contingent response strategies is a tool and technique of the plan risk responses process. All other answers are valid tools and techniques of the control risks process.
4. Answer B is the best response. The control procurements process manages procurement relationships, monitors contract performance, and makes necessary changes. Answer A is incorrect because it describes the conduct procurements process. Answer C is incorrect because it describes the perform integrated change control process. Answer D is incorrect because it describes the plan procurement management process.
The remaining processes in the monitoring and controlling process group provide a project manager with tools and direction for assessing project communication, risk, procurement, and stakeholders. These processes complete the description of how the project manager ensures that the project is operating as intended.
Communicating How a Project Is Performing
Communicating with the project team and the outside world is one of the project manager’s primary jobs. As a communicator, a project manager must understand the mechanics involved in sending a message. This process involves an initiator, encoding of the message, sending of the message, and a receiver who decodes the message, acknowledges the message, and confirms receipt of the message. It is important to maintain open communication with the stakeholders to provide timely and informative updates on the project’s progress. The control communications process addresses issues with communicating with the stakeholders. Table 7.8 shows the inputs, tools and techniques, and outputs for the control communications process.
In the normal exchange of information with the stakeholders, the project manager will use methods and techniques that help with formal and informal communication. Formal methods include items such as contracts, status reports, public speeches, and performance appraisals. Informal methods are those such as “the scuttlebutt,” email, and telephone conversations.
ExamAlert
One way to determine how complex communication will be in a project is to determine its communication channels by using the formula (n * (n – 1)) / 2, where n represents the number of participants in a project. For example, a project with 10 participants will require 45 communication channels: (10 * 9) / 2 = 90 / 2 = 45.
With this in mind, it is important to adjust a message and its delivery method based on the audience and the level of impact the project might have on the individuals with whom the project manager is communicating. For example, consider a board member versus the person doing the work. For the worker, getting information about revenue projections and return on investment might be of little or no consequence in her daily duties. However, providing figures on how many additional widgets can be made in an hour would definitely have an impact on her duties and equipment maintenance cycles.
In addition, the project manager must be aware that when delivering a message, nonverbal communication and physical appearance have a direct effect on the message delivered. For example, the project manager delivers a message to a construction team. It’s important to ensure that language and colloquialisms used are appropriate to the group. Bear in mind, though, that the same approach might not work when giving a project update to the company senior team. It is important to ensure that the message and intentions are clearly understood by the audience who is the target of the message.
Examples of common tools used to communicate are a budget, a contract, a teleconference, and a chart.
Control Risks
The control risks process enables a project manager to keep track of how risk responses are performing against the plan, as well as the place where new risks to the project are managed.
Note
There could be cases in which risk might be identified as having a material impact on the enterprise but not on the project. For these risk types, the project must allow for an alternative communication path that forwards alerts to the people in enterprise risk management functions. In addition, the project manager must remember that risks can have negative and positive effects. For example, consider a project for a bridge that interconnects two roads with a max traffic flow of 10,000 cars and 300 tons. A weather event forces a traffic change from other roads, which doubles the capacity requirements for the bridge for at least 18 months after project completion. Although this wrinkle does not directly affect the project’s deliverable, it is important to consider the new information. In this case, the added traffic could affect the life span and performance of the deliverable after delivery.
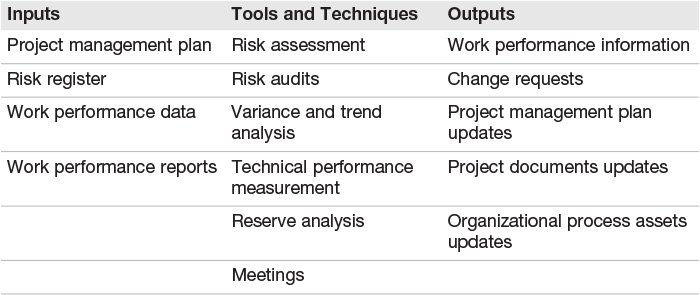
Table 7.9 shows the inputs, tools and techniques, and outputs for the control risks process.
Remember that to determine how much of an effect a risk will have, you multiply its probability by its material impact. As the probability of risk materialization increases, the risk register should make resource (money, equipment, people, and time) allocations ahead of time, thus increasing reserves. It is also important that the risk management plan include the processes that would replenish these reserves before they become depleted.
The purpose of project risk control is to
![]() Identify the events that can have a direct effect on the project deliverables
Identify the events that can have a direct effect on the project deliverables
![]() Assign qualitative and quantitative weight—the probability and consequences of events that might impact the project deliverables
Assign qualitative and quantitative weight—the probability and consequences of events that might impact the project deliverables
![]() Produce alternate paths of execution for events that are out of your control or cannot be mitigated
Produce alternate paths of execution for events that are out of your control or cannot be mitigated
![]() Implement a continuous process for identifying, qualifying, quantifying, and responding to new risks
Implement a continuous process for identifying, qualifying, quantifying, and responding to new risks
ExamAlert
The utility theory, or utility function, assigns subjective value to a management decision in risk mitigation strategies in uncertain conditions.
The risk register accounts for positive and negative risks. A positive risk is a risk that a project takes because its potential benefits are greater than those of the traditional approach. A negative risk is one that could negatively influence the cost of the project or its schedule.
One of the techniques to evaluate risk control and monitoring effectiveness is to compare actual risk resolution practices to those that were planned at the time the risk was identified. Any deviations (negative or positive) would be cause to implement a corrective action in the risk management plan.
Risk triggers are events that cause the threat of a risk to become a reality. For example, say that you have identified the fact that you have only one water pump station available and the replacement takes six weeks to arrive. In the middle of your irrigation and recycling process tests, you discover that water pressure tends to fluctuate beyond pump tolerance levels. If you do not find a way to solve this problem, your risk will become a reality.
Remember that for each identified risk, it is important to provide a response plan. It is not much help if a risk becomes a reality and there is no alternate execution path or emergency procurement plan.
Note
Business risks and pure risks are different because a pure risk takes into account impacts on loss of financial profits, and a business risk concentrates on events that might cause a company to lose position with its investors or to have financial difficulty.
In addition, the risk reserves must be evaluated to determine the best way to replenish them. Some examples of events that could have negative impacts in your risk mitigation and control strategies are
![]() Resource shortage
Resource shortage
![]() Scope creep
Scope creep
![]() Contractual issues
Contractual issues
![]() Lack of key resources availability
Lack of key resources availability
Control Procurements
The control procurements process is the blueprint for managing the procurements process and making any changes necessary. It is the process of comparing vendor or service performance to the contractual service-level agreements (SLAs). Due to its implications and its potential effect across several sections of a project or enterprise, all team members must be aware of the legal ramifications of any change in the contractual relationship. In addition, project-vendor disbursements tend to tie the SLAs, or performance agreements, and deliverables to direct cash expenditures.
At all costs, you must avoid any undocumented or unapproved cash disbursements or changes that might go against your project deliverables.
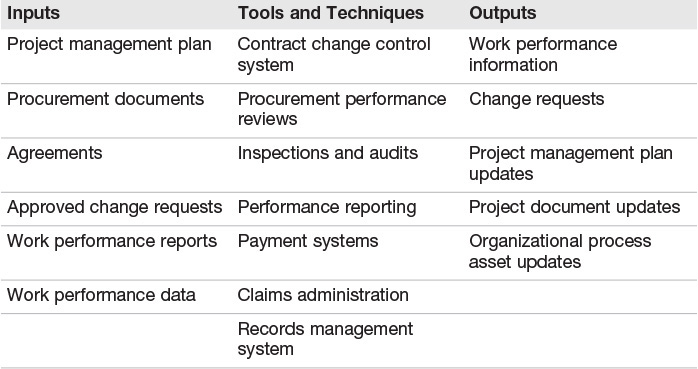
Table 7.10 shows the inputs, tools and techniques, and outputs for the control procurements process.
In general, the project procurements administrator is from the procurement management office and/or legal department and has the authority to issue change requests or early terminations.
Remember that all communications pertaining to procurement administration must follow formal channels and be logged in your project log.
Your procurement administration process should include mechanisms that allow for contract renegotiation, management response, and payment terms definitions.
Control Stakeholder Engagement
The control stakeholder engagement process is one of the new processes introduced in the PMBOK Guide, Fifth Edition. This process focuses on monitoring the relationships between stakeholders and the project. In addition to simply monitoring stakeholder relationships, the process also provides for adjusting plans and strategies necessary to keep stakeholders effectively engaged throughout a project’s life cycle.
Table 7.11 shows the inputs, tools and techniques, and outputs for the control stakeholder engagement process.
Although you may see references to stakeholders in the project communications management knowledge area, pay particular attention to the processes in the project stakeholder management knowledge area. Any activities specifically related to interacting with stakeholders are addressed by processes in this knowledge area.
1. Before risk mitigation can occur, what two processes must be accomplished?
![]() A. Acceptance and delivery requirements
A. Acceptance and delivery requirements
![]() B. Identification and trigger recognition
B. Identification and trigger recognition
![]() C. Phasing and interactions
C. Phasing and interactions
![]() D. Quantitative analysis and qualitative
D. Quantitative analysis and qualitative
![]() E. None of the above
E. None of the above
2. Which of the following is NOT an output of the control risks process?
![]() A. Change requests
A. Change requests
![]() B. Work performance information
B. Work performance information
![]() C. Risk-related contract decisions
C. Risk-related contract decisions
![]() D. Project document updates
D. Project document updates
3. Which of the following processes utilizes inspections as a tool or technique?
![]() A. Perform integrated change control
A. Perform integrated change control
![]() B. Control schedule
B. Control schedule
![]() C. Control risks
C. Control risks
![]() D. Control procurements
D. Control procurements
4. Which of the following is NOT a tool and technique of the manage communications process?
![]() A. Variance analysis
A. Variance analysis
![]() B. Interpersonal skills
B. Interpersonal skills
![]() C. Forecasting methods
C. Forecasting methods
![]() D. Communication methods
D. Communication methods
1. Answer B is correct. Before risks can be mitigated, you need to know how probable is it that they will occur and what their triggering events are.
2. Answer C is correct. Risk-related contract decisions is not an output of the control risks process. Change requests, work performance information, and project document updates are all outputs of the control risks process.
3. Answer D is correct. Of the processes listed, only control procurements utilizes inspections and audits as a tool or technique. None of the other processes utilize inspections. Of all the 47 processes, validate scope and control quality also utilize inspection.
4. Answer B is correct. Interpersonal skills is a tool and technique of the manage stakeholder engagement process. All the other answers are valid tools and techniques of the manage communications process.
What Next?
If you want more practice on this chapter’s exam topics before you move on, remember that you can access all of the Cram Quiz questions on the CD. You can also create a custom exam by topic with the practice exam software. Note any topic you struggle with and go to that topic’s material in this chapter.