
Chapter 4. Examine Project Planning
This chapter covers the following PMP exam topics:
![]() Planning Process Group—3.4
Planning Process Group—3.4
![]() Develop the Project Management Plan—4.2
Develop the Project Management Plan—4.2
![]() Plan Scope Management—5.1
Plan Scope Management—5.1
![]() Collect Requirements—5.2
Collect Requirements—5.2
![]() Define Scope—5.3
Define Scope—5.3
![]() Create WBS—5.4
Create WBS—5.4
![]() Plan Schedule Management—6.1
Plan Schedule Management—6.1
![]() Define Activities—6.2
Define Activities—6.2
![]() Sequence Activities—6.3
Sequence Activities—6.3
![]() Estimate Activity Resources—6.4
Estimate Activity Resources—6.4
![]() Estimate Activity Durations—6.5
Estimate Activity Durations—6.5
![]() Develop Schedule—6.6
Develop Schedule—6.6
![]() Plan Cost Management—7.1
Plan Cost Management—7.1
![]() Estimate Costs—7.2
Estimate Costs—7.2
![]() Determine Budget—7.3
Determine Budget—7.3
(For more information on the PMP exam topics, see “About the PMP Exam” in the Introduction.)
In Chapter 1, “Project Management Framework Fundamentals,” we introduced the PMI concepts of processes, process groups, and knowledge areas. Recall that PMI defines a total of 47 project processes that describe activities throughout a project’s life cycle. These processes are organized into 10 knowledge areas and represent 5 process groups. One of the most prominent of the process groups is project planning. Over half of the processes occur in this group; 24 of the 47 processes are in this group. You might think that planning processes are localized to a particular area of your project, but note that processes in the planning group span all 10 knowledge areas. Let’s look at project planning in more detail.
After you have completed the initiating processes, you are ready to start planning your project. Remember what that means? It means that you possess formal authorization to conduct the work of the project. But you don’t know what to do without a plan. Planning answers a few very important questions, such as What work will you do? and What exactly are you trying to accomplish?
To answer these questions, start from what you know. There are two outputs from the initiating process group processes. Always start with the information necessary to proceed. Recall that PMI refers to this initial information for each process as the process’s inputs. There are two outputs from the initiating processes:
![]() The project charter
The project charter
![]() The stakeholder register
The stakeholder register
Armed with these initiating documents, you can start the planning processes. In a nutshell, you follow each of the planning processes to refine the project documents from these outputs. As you develop the planning documents, always remember how the various processes are related.
Think of the initiating process group as the processes that answer the “what” and “why” questions. The planning processes answer the “how” questions. The planning processes result in outputs that explain how the project will progress toward reaching its goals.
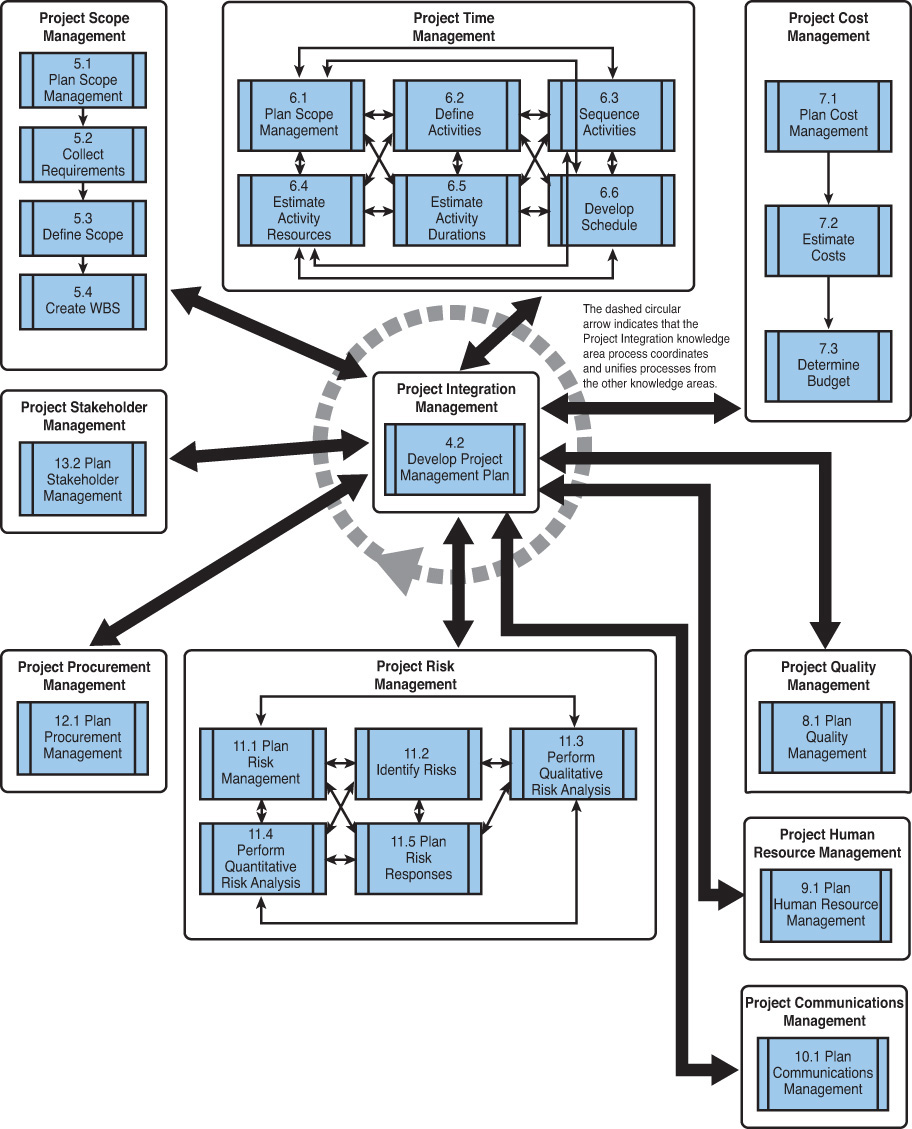
Figure 4.1 shows how the processes in the planning group are related in the PMBOK Guide, Fifth Edition.
ExamAlert
Planning includes many processes, so be prepared to answer many questions in this area on the exam. Planning process group questions make up 24% of the PMP exam. As with all other process groups, make sure you know the inputs, tools and techniques, and outputs of each process. It helps to draw your own process flow. Just the act of physically drawing the process flow in each process group helps you remember how the processes relate to one another.
PMI is explicit in stressing the importance of planning. Far too many projects suffer from the poor practice of starting work before anyone really knows what needs to be done. This almost always results in wasted effort and lost time. Proper planning requires good communication among the team and sound leadership from the project manager. The result of solid planning is a project team that is more informed and prepared to carry out the work required to meet the project’s goals. You should expect to see several questions on the exam that require you to understand the importance of fully planning before starting work.
Because planning is such a large process group, the material is divided into two separate chapters. This chapter covers the general concepts of planning and the processes that relate to the development of project baselines, including the following topics:
![]() Integration
Integration
![]() Scope
Scope
![]() Time
Time
![]() Cost
Cost
Chapter 5, “Explore More Elements of Project Planning,” covers the remaining project planning processes that support project planning by applying more details to the baselines. Topics covered in Chapter 5 include these:
![]() Communications
Communications
![]() Risk
Risk
![]() Procurement
Procurement
![]() Human resources
Human resources
![]() Stakeholders
Stakeholders
The main purpose of planning is to provide a framework to gather information to produce a project management plan. In fact, the plan itself is really a collection of other plans. The majority of activities in the planning group center around developing the supporting documents that comprise the final project management plan. As more detailed information is learned about the project, the overall plan becomes more complete, and the stakeholders’ confidence in the project increases.
Planning is an iterative group of processes. As a project progresses, it often becomes necessary to modify the plan for a number of reasons. Unexpected results, delays, outside factors, and internal factors can all require additional planning. Any scope changes are likely to require one or more planning processes to be revisited. Don’t assume that planning is accomplished only once. The exam requires that you understand how planning is iterative throughout a project.
The following are some fundamental planning process items you need to understand for the exam:
![]() Project management plan—One process in the planning group addresses the project management plan. The develop project management plan process is the high-level process that provides direction for developing subsidiary plans and compiling their information into the final project plan.
Project management plan—One process in the planning group addresses the project management plan. The develop project management plan process is the high-level process that provides direction for developing subsidiary plans and compiling their information into the final project plan.
![]() Scope—Four processes address scope planning. These direct the refinement of the preliminary scope statement and break down the high-level goals of the project into smaller, more manageable chunks.
Scope—Four processes address scope planning. These direct the refinement of the preliminary scope statement and break down the high-level goals of the project into smaller, more manageable chunks.
![]() Activity—Six processes deal with activity planning. After the work of the project is expressed in small, manageable chunks, the activity-related processes focus on defining the activity details, integrating with project resources, and sequencing the project activities.
Activity—Six processes deal with activity planning. After the work of the project is expressed in small, manageable chunks, the activity-related processes focus on defining the activity details, integrating with project resources, and sequencing the project activities.
![]() Cost—Three processes address cost planning. These processes collect estimates and organize them into a project budget.
Cost—Three processes address cost planning. These processes collect estimates and organize them into a project budget.
We examine each of these processes in the next section.
1. What is a common result of poor project planning?
![]() A. Wasted effort
A. Wasted effort
![]() B. Lost time
B. Lost time
![]() C. Increased cost
C. Increased cost
![]() D. All of the above
D. All of the above
2. Which of the following aspects of planning has the most processes and is concerned with decomposing the work of a project into manageable chunks?
![]() A. Scope
A. Scope
![]() B. Time
B. Time
![]() C. Cost
C. Cost
![]() D. Quality
D. Quality
1. Answer D is correct. Poor project planning almost always results in wasted effort, lost time, and increased cost.
2. Answer B is correct. There are six time-related planning processes. Time management processes provide the mechanism to decompose work into small, manageable chunks.
1. According to the PMBOK, what is the basic purpose of the project management plan?
2. Name three of the subsidiary plans to the project management plan.
1. The project management plan is the result (output) of the develop project management plan process that documents the actions necessary to define, prepare, integrate, and coordinate all subsidiary plans.
2. The subsidiary project management plans could include
![]() Project scope management plan
Project scope management plan
![]() Requirements management plan
Requirements management plan
![]() Schedule management plan
Schedule management plan
![]() Cost management plan
Cost management plan
![]() Quality management plan
Quality management plan
![]() Process improvement plan
Process improvement plan
![]() Human resource plan
Human resource plan
![]() Communication management plan
Communication management plan
![]() Risk management plan
Risk management plan
![]() Procurement management plan
Procurement management plan
The project management plan process covers all activities that identify and direct the actions of many other processes in the planning process group. Developing the project management plan includes coordinating the development of the subsidiary plans and incorporating them into the complete project plan. The main purpose of the project management plan is to define how the project is to progress from its beginning to completion.
In short, the project management plan provides the high-level game plan for how the project moves through its life cycle. PMI defines many potential subsidiary plans that make up the overall project management plan. These subsidiary plans provide the specific details for managing each aspect of the project from initiation through closure. The subsidiary project management plans could include
![]() Project scope management plan
Project scope management plan
![]() Requirements management plan
Requirements management plan
![]() Schedule management plan
Schedule management plan
![]() Cost management plan
Cost management plan
![]() Quality management plan
Quality management plan
![]() Process improvement plan
Process improvement plan
![]() Human resource plan
Human resource plan
![]() Communication management plan
Communication management plan
![]() Risk management plan
Risk management plan
![]() Procurement management plan
Procurement management plan
Note
This list of subsidiary plans is a great outline of a project. Use the list as a table of contents when you consider what should be in a project management plan.
One of the most common mistakes inexperienced project managers make is to confuse a project plan with a project schedule. The output from many common project management software packages does not qualify as a project plan. This output is a good start, but a true project plan is made up of much more information than just scheduling information. This process requires a focused effort to create a plan that incorporates all known information about a project. Table 4.1 shows the inputs, tools and techniques, and outputs for the develop project management plan process.
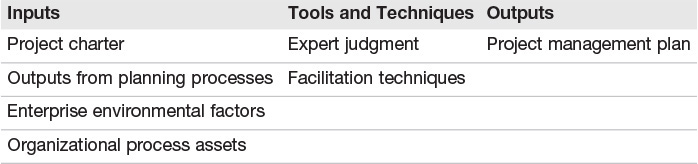
You will see expert judgment listed as a tool and technique for several processes. The meaning of expert judgment is specific to each process. In the context of the develop the project management plan process, expert judgment includes
![]() Tailoring the process to meet the project needs
Tailoring the process to meet the project needs
![]() Developing technical and management details to be included in the project management plan
Developing technical and management details to be included in the project management plan
![]() Determining resources and skill levels needed to perform project work
Determining resources and skill levels needed to perform project work
![]() Defining the level of configuration management to apply to the project
Defining the level of configuration management to apply to the project
![]() Determining which project documents are subject to the formal change control process
Determining which project documents are subject to the formal change control process
1. You are a project manager newly assigned to a large project for your organization. The project charter has been signed, and the stakeholders have been identified. What should you do next?
![]() A. Ask appropriate team members to submit WBS input
A. Ask appropriate team members to submit WBS input
![]() B. Initiate the scope planning process
B. Initiate the scope planning process
![]() C. Start the develop project management plan process
C. Start the develop project management plan process
![]() D. Begin the activity definition process
D. Begin the activity definition process
2. Which of the following is NOT part of the expert judgment tool and technique for the develop project management plan process?
![]() A. Tailor the process to meet the project needs
A. Tailor the process to meet the project needs
![]() B. Hold planning meetings to develop the risk management plan
B. Hold planning meetings to develop the risk management plan
![]() C. Determine resources and skill levels needed to perform project work
C. Determine resources and skill levels needed to perform project work
![]() D. Define the level of configuration management to apply to the project
D. Define the level of configuration management to apply to the project
1. Answer C is correct. The first process in the planning group is develop project management plan. Answers A, B, and D skip the first process and start subsequent processes prematurely.
2. Answer B is correct. Holding planning meetings to develop the risk management plan is a tool and technique for the plan risk management process. Answers A, B, and D all refer to valid components of the expert judgment tool and technique for the develop project management plan process.
![]() Collect Requirements—5.2
Collect Requirements—5.2
![]() Define Scope—5.3
Define Scope—5.3
![]() Create WBS—5.4
Create WBS—5.4
1. The project scope management plan, as a component of the project management plan, includes which of the following?
![]() A. Preparation of a detailed project scope statement
A. Preparation of a detailed project scope statement
![]() B. Creation of the work breakdown structure (WBS)
B. Creation of the work breakdown structure (WBS)
![]() C. Specifications for formal verification and acceptance of completed project deliverables
C. Specifications for formal verification and acceptance of completed project deliverables
![]() D. All of the above
D. All of the above
2. You are creating your WBS and find that you keep decomposing tasks into smaller and smaller units. How can you tell when you are done?
![]() A. Keep decomposing tasks until you reach an amount of work that is small enough to reliably estimate required resources and duration.
A. Keep decomposing tasks until you reach an amount of work that is small enough to reliably estimate required resources and duration.
![]() B. Keep decomposing tasks until you reach an amount of work that can be accomplished in one hour.
B. Keep decomposing tasks until you reach an amount of work that can be accomplished in one hour.
![]() C. Keep decomposing work until you reach an amount of work that can be accomplished in your organization’s basic work unit.
C. Keep decomposing work until you reach an amount of work that can be accomplished in your organization’s basic work unit.
![]() D. Keep decomposing work until you reach a predetermined number of hierarchy levels to keep the WBS balanced.
D. Keep decomposing work until you reach a predetermined number of hierarchy levels to keep the WBS balanced.
3. Which of the following is a valid input to the collect requirements process?
![]() A. Project charter
A. Project charter
![]() B. Requirements traceability matrix
B. Requirements traceability matrix
![]() C. Validated deliverables
C. Validated deliverables
![]() D. Work performance information
D. Work performance information
1. Answer D is the best response. The project scope management plan includes preparation of a detailed project scope statement, creation of the WBS, and a process specifying how formal verification and acceptance of the completed project deliverables will be obtained.
2. Answer A is correct. A properly sized work package is one that is small enough to allow for reliable estimates for required resources and duration. Answers B, C, and D are incorrect because they assume that you are working toward some artificial target that does not contribute to appropriately sized work packages.
3. Answer A is correct. The project charter is one of two defined inputs for the collect requirements process. (The other input is the stakeholder register.) Answer B is incorrect because the requirements traceability matrix is an output for the collect requirements process. Answers C and D are incorrect because they refer to inputs from other processes.
Scope management is the set of processes which ensures that the requirements of the customer are captured in a specification of work that ensures the delivery of the project’s deliverables, that all the project work is done, and that only the work required to complete the project is done. In other words, scope management makes sure that the project is completed without expending any unnecessary effort.
Plan Scope Management
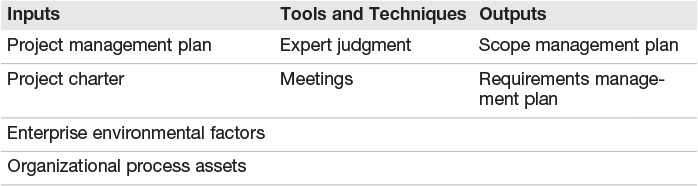
The first process in scope management is a new process, plan scope management. The PMBOK Guide, Fifth Edition, adds several processes to separate the initial planning activities from other activities. While all the processes you will learn about in this chapter relate to planning, the new initial processes in scope management and three other process groups bring attention to the importance PMI places on proper planning. The plan scope management process creates the scope management plan. The scope management plan describes the project scope and documents how it will be further defined, validated, and controlled. This process results in a plan that gives the project team guidance on how to manage the scope throughout the project life cycle. Table 4.2 shows the inputs, tools and techniques, and outputs for the plan scope management process.
Collect Requirements
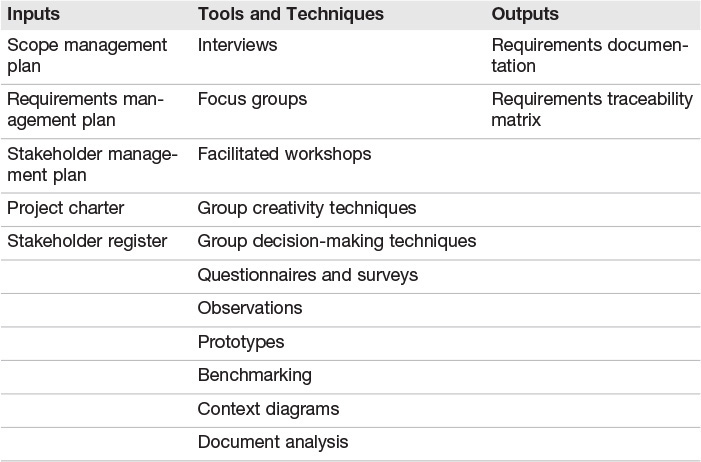
The second process in the scope management process group is the collect requirements process. This process seeks to use multiple tools and techniques to collect all the project requirements from all the stakeholders. This process attempts to leave no stone unturned and results in a complete list of project requirements. When properly performed, the collect requirements process dramatically reduces surprises as the project moves toward completion. Table 4.3 shows the inputs, tools and techniques, and outputs for the collect requirements process. Pay particular attention to the various creative methods you can employ to develop a list of project requirements.
Define Scope
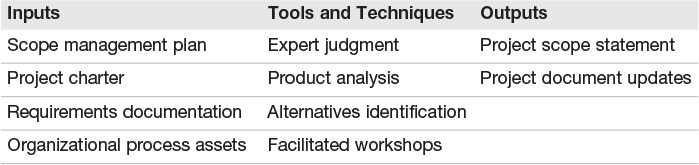
The next process, define scope, is a process that clearly states what the project will and will not accomplish. The supporting documents are reviewed to ensure that the project will satisfy the stated goals, and the resulting scope should state the stakeholders’ needs and clearly communicate the expectations for the performance of the project. Table 4.4 shows the inputs, tools and techniques, and outputs for the define scope process.
Work Breakdown Structure: A Common and Dangerous Omission
Many inexperienced project managers move too quickly from the scope statement to the activity sequencing processes. This practice is a mistake and often leads to activity omissions and inaccurate plans. PMI stresses the importance of creating a work breakdown structure (WBS) before moving to activity management processes.
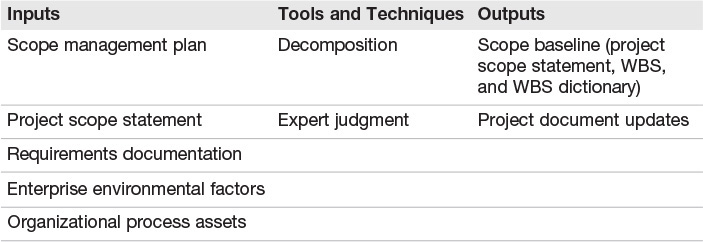
A WBS provides the project manager and project team with the opportunity to decompose the high-level scope statement into much smaller, more manageable units of work, called work packages. The resulting WBS should provide a complete list of all work packages required to complete the project (and nothing more). Table 4.5 shows the inputs, tools and techniques, and outputs for the create WBS process.
The PMI Practice Standard for Work Breakdown Structures is the guide you need to use for the PMP exam. This is an example of information on the exam that goes beyond the PMBOK. You can find this document in the publications section of the PMI website (http://www.pmi.org/en/PMBOK-Guide-and-Standards/Standards-Library-of-PMI-Global-Standards.aspx).
In creating the WBS, the project team repeatedly decomposes the work of the project into smaller and smaller units of work, and the result is a collection of small work packages. The process continues until the resulting work packages are simple enough to reliably estimate duration and required resources. Don’t go overboard, though. When you have work packages that are manageable and each represent a single work effort, stop the process. Each project is different, so this process results in different levels of detail for each project.
ExamAlert
The term work package refers to an individual project activity. The work package is the lowest-level WBS component. According to the PMBOK, “A work package can be scheduled, cost estimated, monitored, and controlled.”
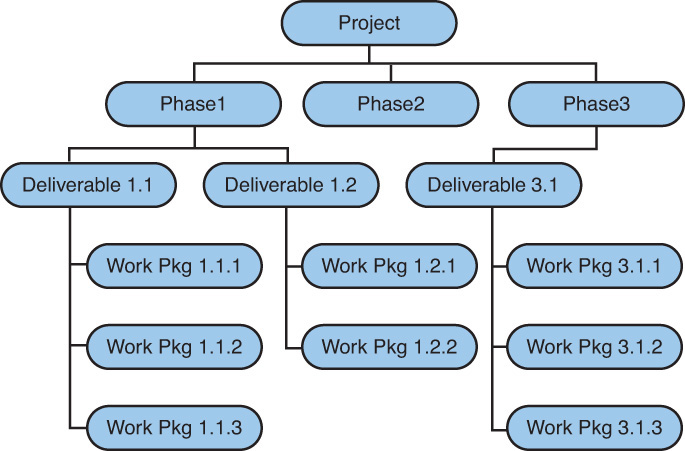
The last main feature of the WBS is that it is organized in a hierarchical fashion. The highest level is the project. The children that represent project phases, divisions, or main deliverables are listed under the project. Each child process or task is divided into further levels of detail until the lowest level, the work package, is reached. Figure 4.2 depicts a sample WBS with multiple levels.
In addition to the WBS itself, another output of the create WBS process is the WBS dictionary. The WBS dictionary is a document that supports the WBS by providing detailed information for each work package. The WBS dictionary can contain many types of information, including
![]() Work package name or identifier
Work package name or identifier
![]() Accounting code identifier
Accounting code identifier
![]() Description of work
Description of work
![]() Technical specifications
Technical specifications
![]() Quality requirements
Quality requirements
![]() Owner or responsible party assignment
Owner or responsible party assignment
![]() Required resources
Required resources
![]() List of schedule milestones
List of schedule milestones
![]() Associated schedule activities
Associated schedule activities
![]() Cost estimates
Cost estimates
![]() Acceptance criteria
Acceptance criteria
![]() Contract information
Contract information
1. As project manager, you are about to start the define scope process. You have the project charter and the organizational process assets list. Because there are no change requests in your project at this point, what must you have before you begin?
![]() A. Product analysis
A. Product analysis
![]() B. Requirements documentation
B. Requirements documentation
![]() C. Updates to project documents
C. Updates to project documents
![]() D. WBS
D. WBS
2. What does a project scope statement document?
![]() A. What work is to be completed during the project
A. What work is to be completed during the project
![]() B. What deliverables need to be produced by the project
B. What deliverables need to be produced by the project
![]() C. Both A and B
C. Both A and B
![]() D. Neither A nor B
D. Neither A nor B
3. The work breakdown structure (WBS) does all of the following except
![]() A. Organizes and defines the entire scope of the project
A. Organizes and defines the entire scope of the project
![]() B. Divides the project into smaller, more manageable tasks
B. Divides the project into smaller, more manageable tasks
![]() C. Serves as a high-level planning tool for work planned but not yet approved
C. Serves as a high-level planning tool for work planned but not yet approved
![]() D. Both A and B
D. Both A and B
4. Which of the following is an output of the collect requirements process?
![]() A. Scope management plan
A. Scope management plan
![]() B. Requirements management plan
B. Requirements management plan
![]() C. Requirements risk breakdown
C. Requirements risk breakdown
![]() D. Requirements traceability matrix
D. Requirements traceability matrix
1. Answer B is correct. The requirements documentation is an input you need before starting the define scope process. Answer A is incorrect because product analysis is a tool and technique of define scope, not an input. Answer C is incorrect because project document updates are an output, not an input. Answer D is incorrect because the WBS is created in a subsequent process and is not available at this point. Know your inputs, tools and techniques, and outputs of all processes.
2. Answer C is the best response. A project scope statement documents what work is to be accomplished and which deliverables need to be produced. Answers A and B are both individually correct, but Answer C is the better response. Answer D is incorrect.
3. Answer C is the correct response. The WBS provides a detailed definition of work specified in the current, approved project scope statement. Both Answers A and B describe the WBS and are therefore incorrect responses to the question.
4. Answer D is the correct response. Answers A and B are incorrect because these are outputs of the plan scope management process. Answer C is incorrect because there is no such defined output as a requirements risk breakdown.
![]() Define Activities—6.2
Define Activities—6.2
![]() Sequence Activities—6.3
Sequence Activities—6.3
![]() Estimate Activity Resources—6.4
Estimate Activity Resources—6.4
![]() Estimate Activity Durations—6.5
Estimate Activity Durations—6.5
![]() Develop Schedule—6.6
Develop Schedule—6.6
1. Which type of network diagram method allows you to depict four types of dependencies?
![]() A. Precedence diagramming method (PDM)
A. Precedence diagramming method (PDM)
![]() B. Arrow diagramming method (ADM)
B. Arrow diagramming method (ADM)
![]() C. Dependency diagramming method (DDM)
C. Dependency diagramming method (DDM)
![]() D. Gantt chart diagram (GCD)
D. Gantt chart diagram (GCD)
2. What term is defined as the practice of planning activities based on how soon the tasks are scheduled to start, such that activities that are close to their start date are planned at a more detailed level than those farther in the future? This term also implies that more detailed plans are required as activities approach their start date.
![]() A. Progressive elaboration
A. Progressive elaboration
![]() B. Rolling wave planning
B. Rolling wave planning
![]() C. Planning component elaboration
C. Planning component elaboration
![]() D. Milestone detail planning
D. Milestone detail planning
3. Which of the following statements best describes the estimate activity resources process?
![]() A. Identifying and documenting relationships among the project activities
A. Identifying and documenting relationships among the project activities
![]() B. Identifying the specific actions to be performed to produce the project deliverables
B. Identifying the specific actions to be performed to produce the project deliverables
![]() C. Estimating the number of work periods needed to complete individual activities
C. Estimating the number of work periods needed to complete individual activities
![]() D. Estimating the type and quantities of material, people, equipment, or supplies to perform each activity
D. Estimating the type and quantities of material, people, equipment, or supplies to perform each activity
4. Which estimating technique is best to use if you know the standard usage rate for a resource (such as an installer can pull 40 feet of cable per hour) to estimate the duration of an activity?
![]() A. Analogous estimating
A. Analogous estimating
![]() B. Parametric estimating
B. Parametric estimating
![]() C. Three-point estimates
C. Three-point estimates
![]() D. Reserve analysis
D. Reserve analysis
5. Which of the following is NOT a tool and technique for the develop schedule process?
![]() A. Critical path method
A. Critical path method
![]() B. Alternatives analysis
B. Alternatives analysis
![]() C. Schedule network analysis
C. Schedule network analysis
![]() D. Leads and lags
D. Leads and lags
1. Answer A is correct. The precedence diagramming method (PDM), also called activity-on-node (AON) diagramming, supports finish-to-start, finish-to-finish, start-to-start, and start-to-finish dependencies. PDM is often used in critical path methodology (CPM). Answer B is incorrect because the arrow diagramming method (ADM) only allows for finish-to-start dependencies. Answers C and D are incorrect because they are not real diagramming methods.
2. Answer B is the best answer. Rolling wave planning is providing detailed plans for tasks that are starting in the near future by using the most current information and revisiting future activities as their starting dates approach. Although rolling wave planning is a type of progressive elaboration, it is mainly concerned with near-term activities. Answer A is not the best answer because progressive elaboration is the process of continuously improving a project plan as more is learned about the project. Answers C and D are incorrect because they are not valid project planning terms.
3. Answer D is correct. Estimate activity resources is the process of estimating the type and quantities of material, people, equipment, or supplies to perform each activity. Answer A is incorrect because it describes the sequence activities process. Answer B is incorrect because it describes the define activities process. Answer C is incorrect because it describes the estimate activity durations process.
4. Answer B is correct. Parametric estimating uses known historical data, such as production rates, to estimate duration. Answer A is incorrect because analogous estimating uses comparison with other, similar project work. Answer C is incorrect because three-point estimates use best, worst, and most likely estimates to calculate duration. Answer D is incorrect because it refers to the process of including contingency reserves into estimates, not actually calculating estimate durations.
5. Answer B is correct. Alternative analysis is a tool and technique for the estimate activity resources process. Estimate activity resources is the process of estimating the type and quantities of material, people, equipment, or supplies to perform each activity. Answers A, C, and D are all tools and techniques for the develop schedule process.
The next section of the planning processes address the steps required to develop the project schedule. This is the part of the project plan that might be most familiar to new project managers. Many automated project management tools help create schedules by keeping track of activities, resources, durations, sequencing, and constraints. Although the schedule is an integral part of the project plan, it is only one part. Don’t start working on the schedule until you have a proper WBS. Starting to work before completing the WBS nearly always results in doing more work than is necessary. A good WBS reduces task redundancy and helps ensure that all work performed is in the scope of the project.
Plan Schedule Management
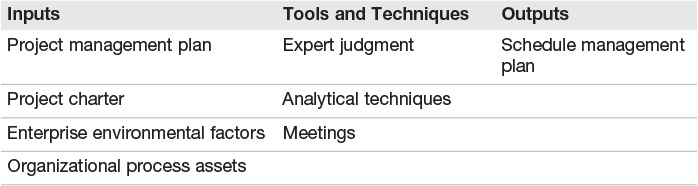
The first process in the time management knowledge area is plan schedule management. This process defines the policies and procedures for planning, managing, and controlling the project schedule. This process provides guidance on how the schedule will be managed throughout the project. All the subsequent processes in the time management knowledge area depend on the plan developed in this process. Table 4.6 shows the inputs, tools and techniques, and outputs for the plan schedule management process.
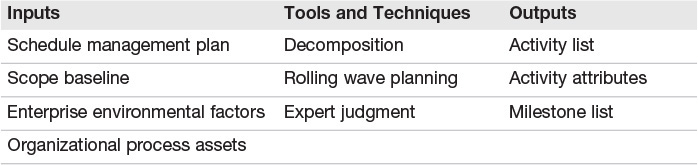
Define Activities
The first process in the activity planning section is define activities. This process starts with the WBS and identifies the activities required to produce the various project deliverables. Activities are viewed from the perspective of the work packages. You ask the question, “What activities are required to satisfy this work package requirement?” Next, the resulting information from this process is used to organize the activities into a specific sequence. Table 4.7 shows the inputs, tools and techniques, and outputs for the define activities process.
Sometimes it is difficult to know everything about a project during the planning stage. It is common to learn more about the project as you work through the project life cycle. This is called progressive elaboration and affects the planning process. If you don’t know everything about a project, you can’t plan the whole project to the necessary level of detail.
For a large project, it is common to plan the entire project at a high level. The project starts with detailed plans in place for the work packages that are near the beginning of the project. As the time draws near to begin additional work, the more detailed, low-level plans for those work packages are added to the project plan. The planning process is revisited multiple times to ensure that the detailed plans contain the latest information known about the project. This practice is called rolling wave planning because the planning wave always moves to stay ahead of the work execution wave.
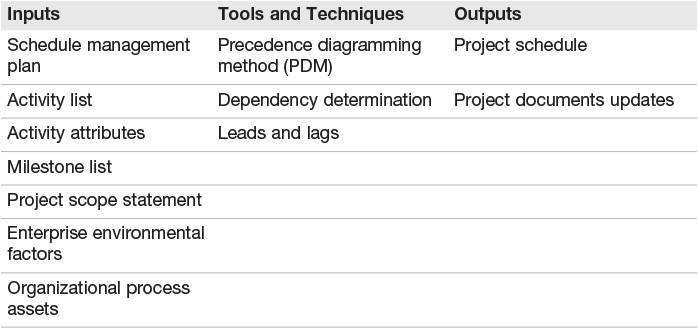
Sequence Activities
The next process is arranging the activities list from activity definition into a discrete sequence. Some activities can be accomplished at any time throughout the project. Other activities depend on input from another activity or are constrained by time or resources. Any requirement that restricts the start or end time of an activity is a dependency. This process identifies all relationships between activities and notes restrictions imposed by these relationships.
For example, when building a car, you cannot install the engine until the engine has been built and delivered to the main assembly line. This is just one example of how activities can be dependent on one another. The sequence activities process is one that can benefit from the use of computer software to assist in noting and keeping track of inter-activity dependencies. Table 4.8 shows the inputs, tools and techniques, and outputs for the sequence activities process.
Network Diagrams
One of the most important topics to understand when planning project activities is how to create network diagrams. A network diagram provides a graphical view of activities and how they are related to one another. The PMP exam tests your ability to recognize and understand the most common type of network diagramming method: the precedence diagramming method (PDM). Make sure you can read a PDM diagram and use the information it presents.
Figure 4.3 shows an example of a PDM diagram.
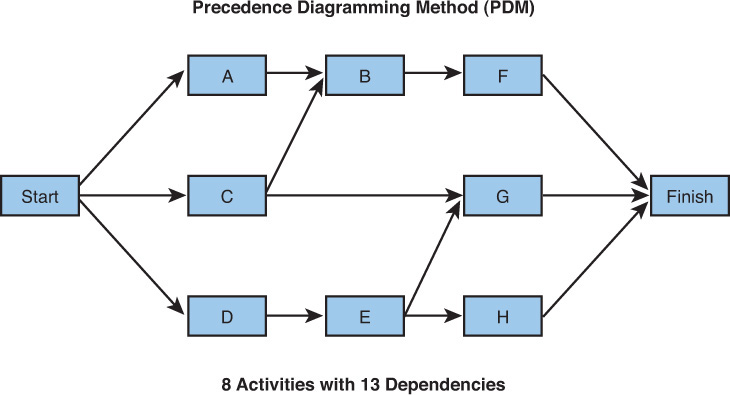
Precedence Diagramming Method
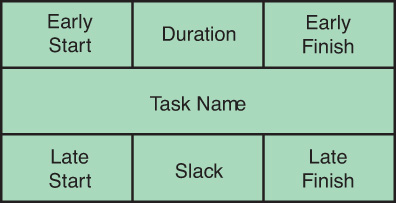
A PDM diagram shows nodes—representing activities—connected by arrows that represent dependencies. To represent that activity B is dependent on activity A (in other words, activity A must be complete before activity B starts), simply draw an arrow from A to B. PDM diagrams are also referred to as activity-on-node (AON) diagrams because the nodes contain the activity duration information. (We don’t have enough information to complete all the information presented here yet. We’ll fill in the duration information during activity duration estimating.) In fact, nodes generally contain several pieces of information, including
![]() Early start—The earliest date the activity can start
Early start—The earliest date the activity can start
![]() Duration—The duration of the activity
Duration—The duration of the activity
![]() Early finish—The earliest date the activity can finish
Early finish—The earliest date the activity can finish
![]() Late start—The latest date the activity can start
Late start—The latest date the activity can start
![]() Late finish—The latest date the activity can finish
Late finish—The latest date the activity can finish
![]() Slack—Difference between the early start and the late start dates
Slack—Difference between the early start and the late start dates
Figure 4.4 shows an example of a PDM node template.
The PDM diagram in Figure 4.3 shows eight activities, labeled A through H, with 13 dependencies. The arrows show how some activities are dependent on other activities. For example, activity B cannot start until activities A and C are complete. To show this dual dependency, we draw an arrow from A to B and another arrow from C to B.
You can represent four types of dependencies with a PDM diagram:
![]() Finish-to-start (the most common dependency type)—The successor activity’s start depends on the completion of the predecessor activity.
Finish-to-start (the most common dependency type)—The successor activity’s start depends on the completion of the predecessor activity.
![]() Finish-to-finish—The completion of the successor activity depends on the completion of the predecessor activity.
Finish-to-finish—The completion of the successor activity depends on the completion of the predecessor activity.
![]() Start-to-start—The start of the successor activity depends on the start of the predecessor activity.
Start-to-start—The start of the successor activity depends on the start of the predecessor activity.
![]() Start-to-finish—The completion of the successor activity depends on the start of the predecessor activity.
Start-to-finish—The completion of the successor activity depends on the start of the predecessor activity.
ExamAlert
Carefully consider the different types of dependencies. Some—especially start-to-finish—can be confusing. On the exam, you are asked to evaluate the scheduling effect of changes in start or end dates. The overall effect on the project depends on the type of relationship between activities. Don’t skip over the dependencies too quickly. Take the time to really read the question before you construct diagrams.
Project Task Information
When you are comfortable with the main types of network diagrams, you need to understand how to use them. Let’s talk about a few basic scheduling concepts and look at how network diagrams help you understand project schedules, starting with a few project tasks. Table 4.9 lists the tasks for a project, along with the predecessors, duration, and earliest start date.
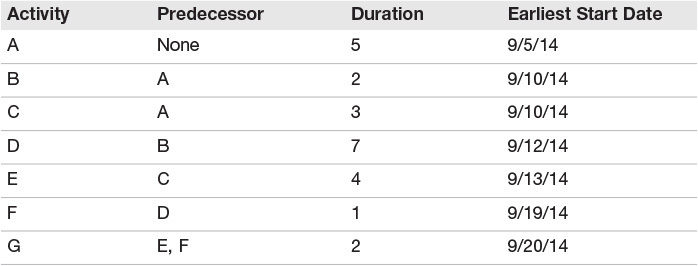
Now use the sample PDM node template shown in Figure 4.4 to create a PDM diagram for the project.
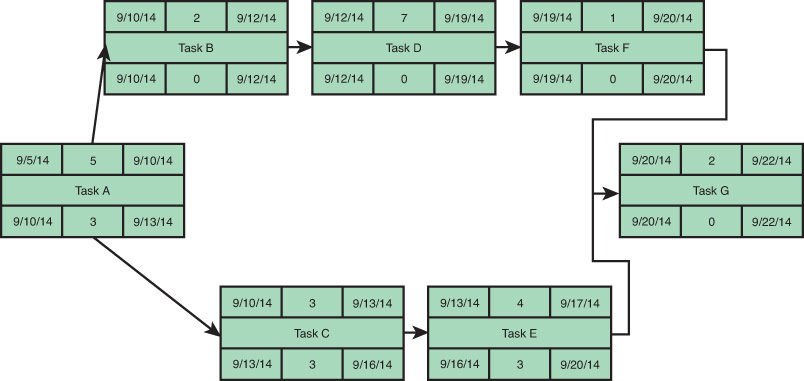
Your completed network diagram should look like the one shown in Figure 4.5.
Estimate Activity Resources
Now you have a list of activities and their relative dependencies. The next process is to associate activities with the resources required to accomplish the work. This process involves listing each type and amount, or quantity, of each required resource. Every activity requires resources of some sort. Activity resources can include
![]() People
People
![]() Equipment
Equipment
![]() Materials and supplies
Materials and supplies
![]() Money
Money
Table 4.10 shows the inputs, tools and techniques, and outputs for the estimate activity resources process.
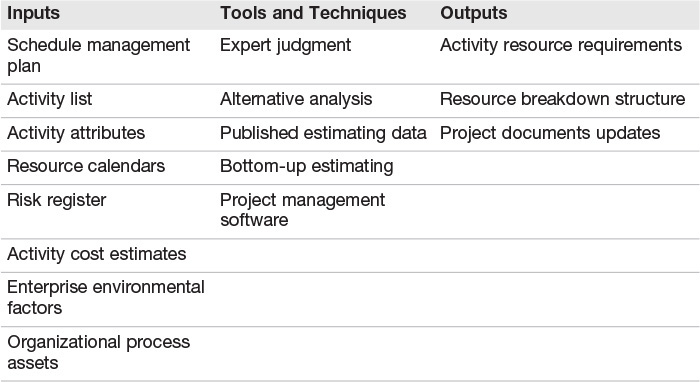
Two of the tools and techniques warrant further discussion. One of the techniques you use when estimating activity resources is alternative analysis. Analyzing the various alternatives provides an opportunity to consider other sources or ways to achieve the desired result for an activity. Alternatives might be more desirable than the initial expected approach due to cost savings, higher quality, or earlier completion. Another important outcome of alternative analysis is that in case the primary source becomes unavailable, you might have already identified a replacement method to complete the work. Suppose your main supplier of industrial fittings suffers a catastrophic fire. If your alternative analysis identified another source, you might be able to continue the project with minimal disruption.
The second item is bottom-up estimating. Recall that one of the purposes of creating the WBS is to decompose project work into work packages that are small enough to reliably estimate for duration and resource requirements. Using the WBS, you can provide estimates for mid- and high-level work by aggregating the estimates for the work packages that make up the desired work. Because this process starts at the lowest level of work (the work package) to create the estimate, it is called bottom-up estimating. This type of estimating tends to be fairly accurate because the estimates come from the people doing the actual work. The alternative is top-down estimating. Top-down estimates generally come from management or a source that is higher up than the people actually doing the work. The estimates are really educated guesses on the amount of resources required for a collection of work packages and tend to be less reliable than bottom-up estimates.
Estimate Activity Durations
After the resource estimates are established for each of the activities, it’s time to assign duration estimates. The estimate activity durations process approximates the number of work periods that are needed to complete scheduled activities. Each estimate assumes that the necessary resources are available to be applied to the work package when needed. Table 4.11 shows the inputs, tools and techniques, and outputs for the activity duration estimating process.
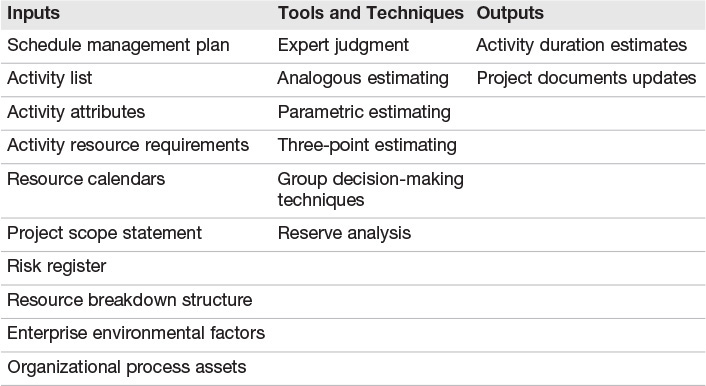
In addition to expert judgment and reserve analysis, four main techniques are used for project activity duration estimation. In many cases, using multiple techniques provides more accurate estimates. The four estimation techniques are
![]() Analogous estimating—This uses actual duration figures from similar activities. These activities can be from the same project or another project but share similarities in budget, size, weight, complexity, or other parameters.
Analogous estimating—This uses actual duration figures from similar activities. These activities can be from the same project or another project but share similarities in budget, size, weight, complexity, or other parameters.
![]() Parametric estimating—This calculates duration estimates by multiplying the quantity of work by the productivity rate. This type of estimate works best for standardized, and often repetitive, activities.
Parametric estimating—This calculates duration estimates by multiplying the quantity of work by the productivity rate. This type of estimate works best for standardized, and often repetitive, activities.
![]() Three-point estimates—This uses three estimate values for each activity:
Three-point estimates—This uses three estimate values for each activity:
![]() Most likely (t M)—The duration most likely to occur.
Most likely (t M)—The duration most likely to occur.
![]() Optimistic (t O)—The duration of the activity based on the best-case scenario.
Optimistic (t O)—The duration of the activity based on the best-case scenario.
![]() Pessimistic (t P)—The duration of the activity based on the worst-case scenario.
Pessimistic (t P)—The duration of the activity based on the worst-case scenario.
This approach originated with the Program Evaluation and Review Technique (PERT). PERT analysis calculates the expected (tE) activity from the three-point estimates by using the following formula:
tE = (tO + 4 * tM + tP) / 6
![]() Triangular distribution—This simple estimating method takes an average of the most likely, optimistic, and pessimistic values. Unlike a three-point estimate, each value receives the same weight. This estimating method assumes that risks are just as likely to be realized as the most likely estimate. You can calculate a triangular distribution by using the following formula:
Triangular distribution—This simple estimating method takes an average of the most likely, optimistic, and pessimistic values. Unlike a three-point estimate, each value receives the same weight. This estimating method assumes that risks are just as likely to be realized as the most likely estimate. You can calculate a triangular distribution by using the following formula:
Average = (tO + tM + tP) / 3
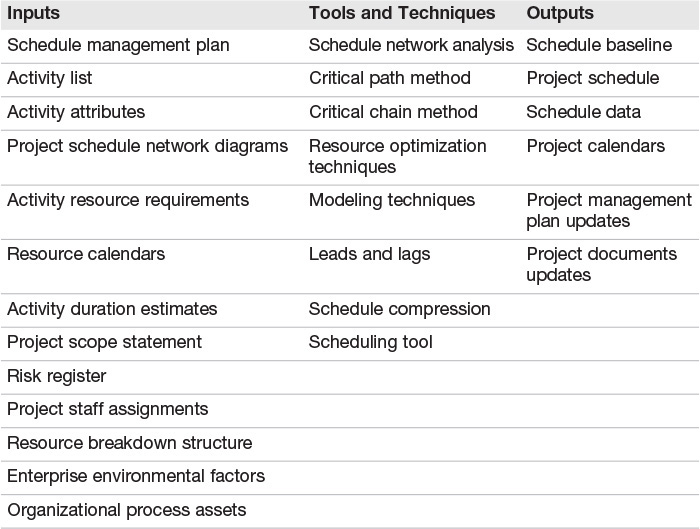
Develop Schedule
The next step is to develop the actual project schedule. The develop schedule process pulls all the activity information together and results in the project’s initial (baseline) schedule. As work is iteratively planned and accomplished and the project moves through its life cycle, changes to the schedule are likely to occur. The schedule is a dynamic document and requires constant attention on the part of the project manager to ensure that the project stays on track. Table 4.12 shows the inputs, tools and techniques, and outputs for the develop schedule process.
An important topic to understand with respect to project schedules is the critical path. In the AON diagram in Figure 4.3, the critical path is the longest path from start to finish. It is calculated by adding all the durations along each path from start to finish. The reason it is called the critical path is that any delay (or increase in duration) of any activity on the critical path causes a delay in the project. It is critical that all activities on this path be completed on schedule.
Critical Path
Using the network diagram in Figure 4.5, you can calculate the project critical path. The critical path is the route with the longest total duration. The critical path method performs a forward and backward pass through the schedule network, calculating the early start and finish dates and the late start and finish dates for all activities, based on durations and relationships. The critical path method does not take into account resource limitations. The critical chain method does consider resource limitations. In short, the critical chain method uses the critical path method output and modifies the schedule network to account for limited resources. In this example, there are two routes from Task A to Task G:
![]() Path A–B–D–F–G will take 17 days to complete. (Just add up all the durations: 5 + 2 + 7 + 1 + 2 = 17)
Path A–B–D–F–G will take 17 days to complete. (Just add up all the durations: 5 + 2 + 7 + 1 + 2 = 17)
![]() Path A–C–E–G will take 14 days to complete.
Path A–C–E–G will take 14 days to complete.
From this diagram, you can see that the longest path is A–B–D–F–G, and that is the critical path. Any delays in any of these tasks delay the project.
Float
The PDM diagram in Figure 4.5 has several pieces of information filled in for each node that we have not discussed. The task name and duration are self-explanatory. What about the rest of the information? The main task of developing the project schedule is to relate each of the tasks and combine duration, resource requirements, and dependencies. You need to make several passes through the network diagram to calculate the values necessary to create a project schedule.
In general, you make two main passes through each path in your network diagram. The first pass starts with the initial project task (the project start task). A task’s early start date is the earliest you can start working on that task. The late start date is the latest you can start working on the task. The difference between the early and late start dates is called float. The float is the schedule flexibility of a task. In Figure 4.5, the early start date for Task A is 9/5/14. To get the early finish date, just add the duration to the early start date. The duration for Task A is 5 days, so the earliest Task A can finish is 9/10/14. Now, the early finish date for Task A becomes the early start date for any tasks that are dependent on Task A (namely, Task B and Task C). Then, continue to follow each path until you reach the final task, calculating the new early end dates by adding the duration to the early start dates.
Note
Make sure you follow every path from the starting task to the ending task, calculating duration of each path. There are likely several paths that will get you there. Sometimes the shortest-duration path might not be immediately evident.
Now it is time for the second pass through your project to calculate the late start and late ending dates. This pass starts at the end and moves backward through the same paths you just followed in the forward pass. The first step in the backward pass is to record the late ending date. It is the same as the early ending date for the last task in the project. Then, subtract the duration to get the late start date. In Figure 4.5, the late ending date for Task G is 9/22/14, and the late start date is 9/20/14. Next, move backward to each task on which your current task depends (that is each task that has an arrow pointing to your current task). The late ending date for this predecessor task is the same as the late start date of the dependent task. In other words, the late ending date for Task F and Task E would be 9/20/14 (the late start date for Task G). Continue backward through the project, subtracting the duration to calculate a new late start date.
After completing both the forward and backward passes, you should have all of the early start times (EST), early finish times (EFT), late start times (LST), and late finish times (LFT) filled in. To complete the network diagram entries, calculate the float for each task by subtracting the early start date from the late start date. The float is the amount of time each task can be delayed without delaying the project.
Finally, add the durations for each path from the start task to the finish task. The largest total represents the critical path of your project. There could be more than one critical path. Remember that tasks on the critical path all have a float of 0, and any delay of a task on the critical path results in an overall project delay.
Allocating Resources
In addition to calculating the critical path and critical chain, it might be necessary to address resource limitations. The process of reallocating resources that have been overallocated is called resource leveling. This technique seeks to avoid work stoppage due to limited resources being required by multiple activities. Remember that resource leveling can often change the critical path. Because resource allocation can change the critical path it is often useful to implement another technique: what-if scenarios. A what-if scenario allows the project planners to explore the effect to the critical path of resource availability changes. For example, if you depend on a particular person to complete work on the critical path, what happens if that person becomes ill? Such a question would be part of a what-if scenario.

1. What is the critical path for this project, and what is the duration of the critical path?
![]() A. A–B–D–F–G, 13 days
A. A–B–D–F–G, 13 days
![]() B. A–C–E–G, 14 days
B. A–C–E–G, 14 days
![]() C. A–B–D–F–G, 14 days
C. A–B–D–F–G, 14 days
![]() D. A–C–E–G, 13 days
D. A–C–E–G, 13 days
2. How many days late can Task D start without affecting the project completion date?
![]() A. One day
A. One day
![]() B. Two days
B. Two days
![]() C. Zero days
C. Zero days
![]() D. Three days
D. Three days
3. If Task C starts two days late, what is the effect on the project end date?
![]() A. The project ends one day late because there is slack of one day.
A. The project ends one day late because there is slack of one day.
![]() B. The project is still two days early because Tasks B, D, and F each have one day of slack.
B. The project is still two days early because Tasks B, D, and F each have one day of slack.
![]() C. The project is one day late because Task C is on the critical path.
C. The project is one day late because Task C is on the critical path.
![]() D. There is no effect on the project end date.
D. There is no effect on the project end date.
4. When developing the estimates for project phases, you choose to add the individual estimates for the activities comprising each phase. What type of estimation method are you using?
![]() A. Parametric estimating
A. Parametric estimating
![]() B. Bottom-up estimating
B. Bottom-up estimating
![]() C. Top-down estimating
C. Top-down estimating
![]() D. Analogous estimating
D. Analogous estimating
5. What is the primary purpose of the define activities process?
![]() A. Identify the specific actions to be performed that result in the stated project deliverables
A. Identify the specific actions to be performed that result in the stated project deliverables
![]() B. Identify and document relationships among project activities
B. Identify and document relationships among project activities
![]() C. Analyze activity sequences, durations, resource requirements, and schedule constraints
C. Analyze activity sequences, durations, resource requirements, and schedule constraints
![]() D. Monitor the status of the project schedule and manage schedule changes
D. Monitor the status of the project schedule and manage schedule changes
6. Which estimating technique is the best choice if you know the durations of similar activities from other projects?
![]() A. Analogous estimating
A. Analogous estimating
![]() B. Parametric estimating
B. Parametric estimating
![]() C. Three-point estimating
C. Three-point estimating
![]() D. Historical analysis estimating
D. Historical analysis estimating
7. Which of the following is NOT an output of the develop schedule process?
![]() A. Project schedule
A. Project schedule
![]() B. Schedule baseline
B. Schedule baseline
![]() C. Schedule data
C. Schedule data
![]() D. Resource breakdown structure
D. Resource breakdown structure
1. Answer B is correct. The path A–C–E–G is the longest direct path from start to finish. All other answers are incorrect because they state either the incorrect path or project duration.
2. Answer A is correct. Because Task D is not on the critical path and has a slack of one day, it can start one day late (at most) without affecting the project end date.
3. Answer C is correct. Because Task C is on the critical path, any delay of the task delays the project.
4. Answer B is correct. Bottom-up estimating is the process of calculating estimates by aggregating the individual estimates of activities that make up the desired activity group. Answer A is incorrect because parametric estimating uses a process of multiplying quantity of work by the productivity rate. Answer C is incorrect because top-down estimating starts with an estimate and decomposes the estimate into smaller units to apply to the individual work packages. Answer D is incorrect because analogous estimating uses similar work packages, not estimate aggregation.
5. Answer A is correct. The stated answer is the main purpose of the define activities process. Answer B is incorrect because it states the purpose of the sequence activities process. Answer C is incorrect because it states the purpose of the develop schedule process. Answer D is incorrect because it states the purpose of the control schedule process.
6. Answer A is correct. Analogous estimating uses parameters from other similar activities to estimate durations. Answers B and C are incorrect because they refer to estimating techniques that do not consider similar activities. Answer D is incorrect because it refers to an estimating technique that doesn’t exist.
7. Answer D is correct. The resource breakdown structure is an output of the estimate activity resources process. Answers A, B, and C are incorrect because they are all valid outputs of the develop schedule process.
![]() Estimate Costs—7.2
Estimate Costs—7.2
![]() Determine Budget—7.3
Determine Budget—7.3
1. Which type of cost estimation would you use to estimate the cost to finish a floor if you knew the standard cost per square foot?
![]() A. Analogous estimating
A. Analogous estimating
![]() B. Parametric estimating
B. Parametric estimating
![]() C. Three-point estimating
C. Three-point estimating
![]() D. Bottom-up estimating
D. Bottom-up estimating
2. Which of the following is NOT an input for the determine budget process?
![]() A. Basis of estimates
A. Basis of estimates
![]() B. Project schedule
B. Project schedule
![]() C. Risk register
C. Risk register
![]() D. Agreements
D. Agreements
1. Answer B is the best response. Parametric estimating calculates cost estimates by multiplying the quantity of work or result of work by a known rate. Answers A, C, and D are all valid estimating techniques, but they do not arrive at values based on known rates.
2. Answer C is correct. The risk register is an input to the estimate costs process, not the determine budget process. Answers A, B, and D are all valid inputs for the determine budget process.
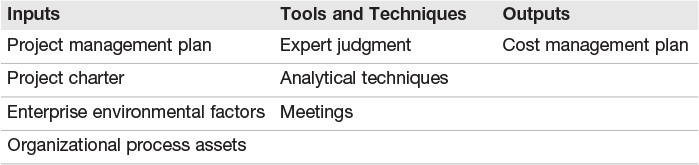
Plan Cost Management
The first process in the cost management knowledge area is plan cost management. This process defines the policies and procedures for planning, managing, and controlling project costs. This process provides guidance on how costs will be managed throughout the project, taking into account stakeholder requirements for managing costs. All of the subsequent processes in the cost management knowledge area depend on the plan developed in this process. Table 4.13 shows the inputs, tools and techniques, and outputs for the plan cost management process.
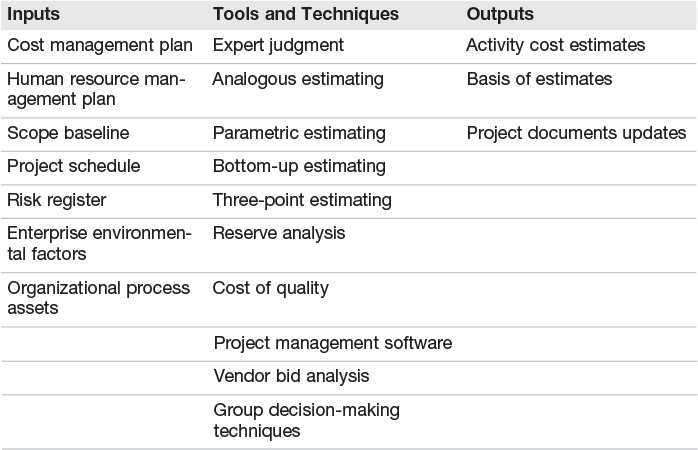
Estimate Costs
The estimate cost process associates an expected cost of performing work to each activity. Cost estimates can include labor, materials, equipment, and any other direct costs for project activities. Based on the activity resource and duration estimates, the cost estimates express the cost, normally in monetary amounts, of completing the work of the project. As with all other project documents, the cost estimates can change through the project as conditions change. Different events can cause the cost for any activity to go up or down and may require the cost estimates for the project to change. Table 4.14 shows the inputs, tools and techniques, and outputs for the estimate cost process.
Cost estimates are compiled into the project budget. You probably recognize several estimating techniques from other processes. Three of the techniques used in the estimate costs process are the same basic techniques used in the estimate activity durations process. The other technique, bottom-up estimating, is also used in the estimate activity resources process. Although they are the same techniques, they are applied to different criteria and bear revisiting.
![]() Analogous estimating—This uses actual cost values from similar activities. These activities can be from the same project or another project.
Analogous estimating—This uses actual cost values from similar activities. These activities can be from the same project or another project.
![]() Parametric estimating—This calculates cost estimates by multiplying the quantity of work or result of work, such as square feet or hours, by a known rate, such as $30 per square foot or $45 per hour. This type of estimate works best for standardized, and often repeated, activities.
Parametric estimating—This calculates cost estimates by multiplying the quantity of work or result of work, such as square feet or hours, by a known rate, such as $30 per square foot or $45 per hour. This type of estimate works best for standardized, and often repeated, activities.
![]() Three-point estimating—This uses three estimate values for each activity:
Three-point estimating—This uses three estimate values for each activity:
![]() Most likely—The cost most likely to occur
Most likely—The cost most likely to occur
![]() Optimistic—The cost of the activity if everything goes as planned, or better
Optimistic—The cost of the activity if everything goes as planned, or better
![]() Pessimistic—The cost of the activity in a worst-case scenario
Pessimistic—The cost of the activity in a worst-case scenario
![]() Bottom-up estimating—This technique calculates cost estimates by adding the costs of each individual work package. The technique starts at the most detailed level and rolls up the costs until a total cost for the project is obtained.
Bottom-up estimating—This technique calculates cost estimates by adding the costs of each individual work package. The technique starts at the most detailed level and rolls up the costs until a total cost for the project is obtained.
Determine Budget
After you know the costs to accomplish the work of the project, you can create the project budget. The determine budget process aggregates the activity cost estimates into a single document for the project. The resulting project budget expands on the preliminary budget from the project charter and provides far more detail. Table 4.15 shows the inputs, tools and techniques, and outputs for the determine budget process.
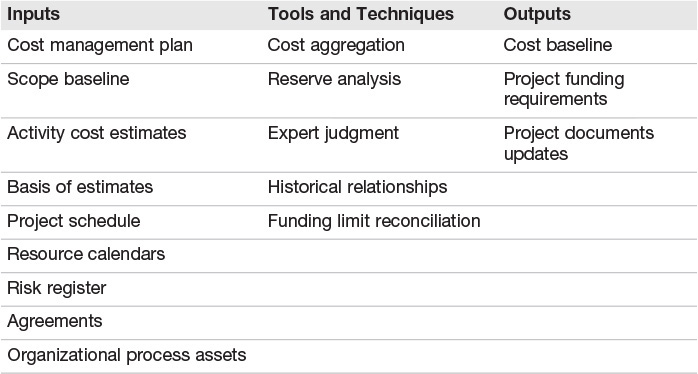
Don’t confuse the estimate costs process with the determine budget process. The determine budget process aggregates all of the activity cost estimates to result in a budget baseline against which your project costs will be measured.
1. The project cost and schedule for deliverables can be reasonably estimated at what level of the WBS?
![]() A. The highest level
A. The highest level
![]() B. The middle level
B. The middle level
![]() C. The work package level
C. The work package level
![]() D. Both A and C
D. Both A and C
2. When the cost of an activity cannot be estimated with an adequate degree of certainty, the work within the activity can be decomposed. The resource requirements for each lower, more detailed work package can be estimated and aggregated to form a basis for estimating the cost for overarching scheduled activity. What is this type of estimating called?
![]() A. Bottom-up estimating
A. Bottom-up estimating
![]() B. Decomposed estimating
B. Decomposed estimating
![]() C. Should-cost estimating
C. Should-cost estimating
![]() D. Three-point estimating
D. Three-point estimating
3. Which process results in the project funding requirements document as one of its outputs?
![]() A. Estimate activity resources
A. Estimate activity resources
![]() B. Estimate activity durations
B. Estimate activity durations
![]() C. Estimate costs
C. Estimate costs
![]() D. Determine budget
D. Determine budget
1. Answer D is the correct response. The project cost and project schedule for work can be reliably estimated at the work package, or lowest, level of the WBS using bottom-up estimating, or at the highest level using top-down estimating.
2. Answer A is the correct response. Bottom-up estimating is a technique for estimating cost through decomposition. A bottom-up estimate is based on the cost requirements for each lower work package and then is combined to estimate cost of the entire component of work. Answer B is incorrect because there is no technique called decomposed estimating. Answer C is incorrect because should-cost estimating is an activity duration estimating technique. Answer D is incorrect because three-point estimating does not incorporate decomposition.
3. Answer D is the correct response. The determine budget process produces the project funding requirements as one of its outputs, along with the cost performance baseline and project document updates. Answers A, B, and C are incorrect because these processes do not produce the project funding requirements document as an output. Make sure you know the inputs, tools and techniques, and outputs of all the project processes.
What Next?
If you want more practice on this chapter’s exam topics before you move on, remember that you can access all of the Cram Quiz questions on the CD. You can also create a custom exam by topic with the practice exam software. Note any topic you struggle with and go to that topic’s material in this chapter.