13.3.2 Semibatch Operation
Example 13-4 Heat Effects in a Semibatch Reactor
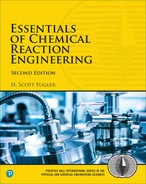
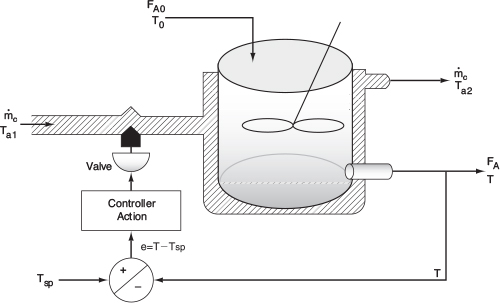
The second-order saponification of ethyl acetate is to be carried out in a semibatch reactor shown schematically below in Figure E13-4.1.
Aqueous sodium hydroxide is to be fed at a concentration of 1 kmol/m3, a temperature of 300 K, and a volumetric rate of 0.004 m3/s to an initial volume of 0.2 m3 of water and ethyl acetate. The concentration of water in the feed, CW0, is 55 kmol/m3. The initial concentrations of ethyl acetate and water in the reactor are 5 kmol/m3 and 30.7 kmol/m3, respectively. The reaction is exothermic and it is necessary to add a heat exchanger to keep its temperature below 315 K. A super-shiny heat exchanger with UA = 3000 J/s · K obtained from the downtown Sunday markets in Riça, Jofos-tan, is available and ready for use. The coolant enters at a mass flow rate of 100 kg/s and a temperature of 285 K.
Are the heat exchanger and coolant flow rate adequate to keep the reactor temperature below 315 K? Plot the reactor temperature, T, and the concentrations, CA, CB, and CC as a function of time.
Additional information: 3 k = 0.39175 exp
Feed:
Initially:
3 Value for k from J. M. Smith, Chemical Engineering Kinetics, 3rd ed. (New York: McGraw-Hill, 1981), p. 205. Note that AHRx and KC were calculated from values given in Perry’s Chemical Engineers’ Handbook, 6th ed. (New York: McGraw-Hill, 1984), pp. 3-147.
Solution
1. Mole Balances: (See Chapter 6.)
Initially, the number of moles of water in the reactor is, NWi,
2. Rate Law:
3. Stoichiometry:

4. Energy Balance:
The user-friendly energy balance is
Only species B (NaOH) and water flow into the reactor, so Equation (13-22) becomes
Qrs1 is the heat removed by mass flow, and Qrs2 is the heat removed through heat exchange.
In Jofostan we have the added bonus that we can ask Prof. Dr. Sven Köttlov to calculate the temperature of the heat exchange fluid at its exit using Equation (12-17)
5. Evaluation of Parameters:
We note the heat capacities for B, C, and water are essentially the same at CP
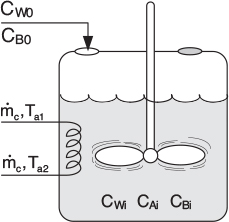
The Polymath program is given in Table E13-4.1. The solution results are shown in Figures E13-4.2 and E13-4.3.
The graphical output of the Polymath Program in terms of temperatures T and Ta and concentrations are shown in Figures 13-4.2 and 13-4.3

Living Example Problem
Analysis: From Figure E13-4.3 we see that the concentration of species B is virtually zero, owing to the fact that it is consumed virtually as fast as it enters the reactor up to a time of 252s. By the time we reach 252s, all species A has been consumed, and the reaction rate is virtually zero and no more of species C or D is produced and no more B is consumed. Because species B continues to enter the reactor at a volumetric flow rate υ0, after 252 seconds, the fluid volume continues to increase and the concentrations of C and D are diluted. The figure shows that before 252 s, (Qg > Qr), and the reactor temperature and the coolant temperature increase. However, after 252 s, the reaction rate, and hence Qg, are virtually zero so that (Qr > Qg) and the temperature decreases. Because of the impractical short reaction time (252 seconds), a semibatch reactor would never be used for this reaction at this temperature; instead, we would most likely use a CSTR or PFR. See Problem P13-1B (d) to reflect on this example.
Wrong Reactor Choice!
13.4 Nonisothermal Multiple Reactions
For multiple reactions with species occurring in either a semibatch or batch reactor, Equaben (13-9) can ine generalized in the same manner as the steady-state energy balance to give
For large coolauation rates, Equation (13-24) becomes
Rearranging Equation (13-25) and letting
and
we can write Equation (13-25) in a more compact form
Example 13-5 Multiple Reactions in a Semibatch Reactor
The series reactions
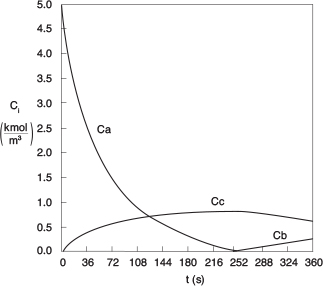
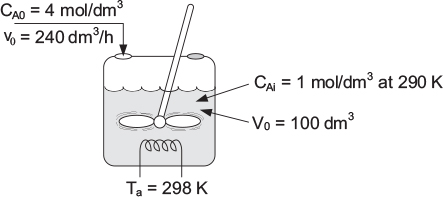
are catalyzed by . All reactions are first order in the reactant concentration. However, Reaction (l) is exothermic and Reaction (2) is endothermic. The reaction is to be carried out in a semibatch reactor texchanger heat exchanger inside with and a constant exchanger temperature, , of 298 K. Pure enters at a concentration of 4 mol/dm3, a volumetric flow rate of 240 , and a temperature of 305 K. Initially, there is a total of 100 of liquid in the reactor, which contains 1.0 mol/dm3 of A and 1.0 mol/dm3 of the catalyst . The reac- tion rate is independent of the catalyst concentration. The initial temperature inside the reactor is 290 K.
Plot and analyze the species concentrations and reactor temperature as a function of time.
Additional information:
solution
Reaction (1)
Reaction (2)
1. Mole Balances:
2. Rates:
(a) Rate Laws:
(b) Relative Rates:
3. Stoichiometry (liquid phase): Use
4. Energy Balance:
A slight rearrangement of (13-25) for this semibatch reactor gives
Expanding
Substituting the parameter values into Equation (E13-5.14)
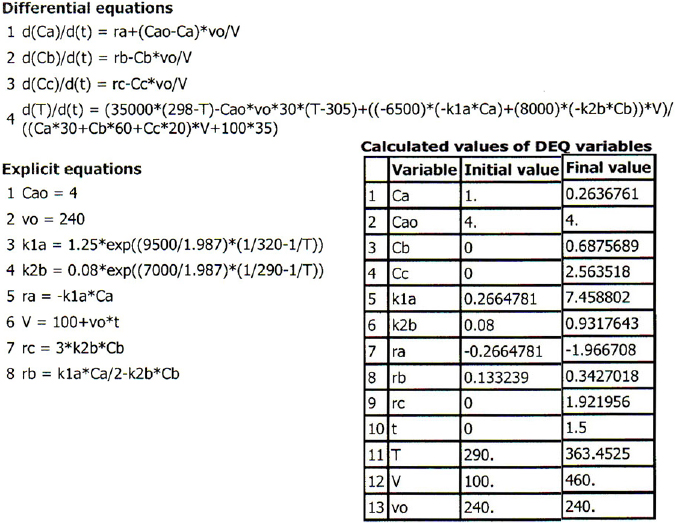
Equations (E13-5.1) through (E13-5.3) and (E13-5.8) through (E13-5.12) can be solved simultaneously with Equation (E13-5.14) using an ODE solver. The Polymath program is shown in Table E13-5.1. The concentration-time and temperature-time trajectories are shown in Figures E13-5.1 and E13-5.2.

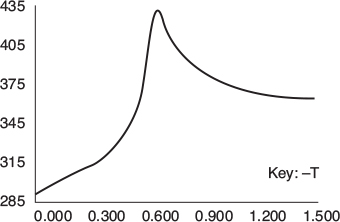
Analysis: At the start of the reaction, both CA and T in the reactor increase because the feed concentrations of CA0 and T0 are greater than CAi and Ti. This increase continues until the rate of consumption of the reacting species, , is greater than the feed rate to the reactor, FA0. We note that at about t = 0.2 h, the reactor temperature exceeds the feed temperature (i.e.,305 K) as a result of the heat generated by the exo- thermic reaction (Reaction 1). The temperature continues to rise until about t = 0.6 h, at which point reactant A is virtuallyter consumed. After this point the temperature begins to drop for two reasons: (1) the reactor is cooled by the heat exchanger and (2) heat is absorbed by the endothermic reaction rate (Reaction 2). The question is, does the maximum temperature (435 K) exceed a temperature that is too high, result- ing in a high aapor pressure that then results in evaporation losses or causes a highly exothermic secondary reaction to set in?
694
Example 136 T2 Laboratories Explosion4

T2 Laboratories manufactured a fuel additive, methylcydopentadienyl manganese tricarinonyl (MCMT), in a 2,450-gallon, high-pressure batch reactor utilizing a three-step batch process.
Step 1a. The liquid-phase metalation reaction between methylcydopentadiene and sodium in a solvent of diethylene glycol dimethyt otPro (diglyme) to produce sodium methylcydopentadiene and hydrogen gas is
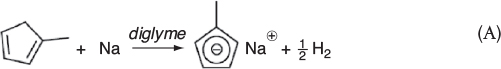
Hydrogen immediately comes out of the solution and is vented et the top into the gas head space and then out of the system.
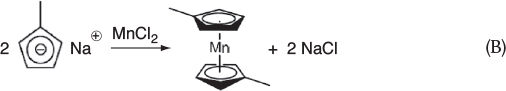
Step . At the end of Step la, is added. The substitution reaction between sodium methylcydopentadiene and manganese chloride produced manganese dimethylcydopentadiene and sodium chloride is
4 This example was coauthored by Professors Ronald J. Willey, Northeastern University, Michael B. Cutlip, University of Connecticut, and H. Scott Fogler, University of Michigan, and published in Process Safety Progress, 30, 1 (2011).
Step 1c. At the end of Step lb, CO is added. The carbonylation reaction between manganese dimethylcydopentadiene and carbon monoxide produces the final product, methylcydopentadienyl manganese tricarbonyl (MCMT):

We will only consider Step la as this step is the one in which the explosion occurred.
Procedure
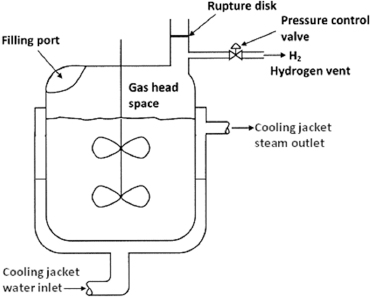
First, solid sodium is mixed in the batch reactor with methylcydopentadiene dimer and a solvent diethylene glycol dimethyT ether (diglyme). The batch reactor is then heated to about 422 K (300° F) with only cUrrin reaction occurring during this heating process. On reaching 422 K, the heating is turned off, as the exothermic reaction is now proceeding, and the temperature continues to increase without further heating. When the temperature reaches 455.4 K (360° F), the operator initiates cooling using the evapora- tion of boiling water in the reactor jacket as the heat sink (Ta = 373.15 K)(212° F).
What Happened
On December 19, 2007, when the reactor reached a temperature of 455.4 K(360° F), the process operator could not initiate the flow of cooling water to the cooling jacket shown in Figure E13-6.2. Thus, the expected cooling of the reactor was not available and the temperature in the reactor continued to rise. The pressure also increased as hydrogen continued to be produced at an increased rate, to the point that the reactor’s pressure control valve system on the 1-inch diameter hydrogen venting stream could no longer vent the gas and maintain the operating pressure at 50 psig (4.4 atm). As the temperature continued to increase further, a previously unknown exothermic secondary reaction of the diglyme solvent that was catalyzed by sodium accelerated rapidly.
(D)
This reaction produced even more hydrogen, causing the pressure to rise even faster, eventually causing the rupture disk which was set at 28.2 atm absolute (400 psig), to break, in the 4-inch diameter relief With for H2. Even with the reliefline open, the rate of production of was now far greater tventing, rate of venting, causing the pressure to continue to increase to the point that it ruptured the reactor vessel initi- ating a horrific explosion. The T2 plant was completely leveled and four personnel lives were lost. Surrounding businesses were heavily damaged and additional ries were sustained.
Before continuing with this example, it might be helpful to view the 9-minute Boardical Safety Board (CSB) vcano, which you can access directly from the CRE Web site (under YouTube videos), or you can read the supporting reports (http://www.csb.gov/videos/runaway-explosion-at-t2-1aboratories/). You can also search the Web for T2 explosion video
Simplified Model
Summarizing the important reactions for Step 1
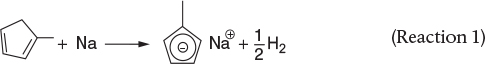
Let A = methycylcopentadiene, B = sodium, S = solvent (diglyme), and D = H2. This runaway reaction can be approximately modeled with two reactions. These reactions are
In Reaction (1), A and B react to form products. Reaction (2) represents the decom- position of the liquid-phase solvent diglyme, S, catalyzed by the presence of B, but this reaction only begins to proceed once a temperature of approximately 470 K is reached.
The rate laws, along with the specific reaction-rate constants at the initial temperature of 422 K, are
The heats of reaction are constant.
The sum of products of the moles of each species and their corresponding heat capacities in the denominator of Equation (13-12) is essentially constant at
Assumptions
Assume that the liquid volume, V0, in the reactor remains constant at 4,000 dm3 and that the vapor space, VH, above the reactor occupies 5,000 dm3. Any gas, H2 (i.e., D), that is formed by Reactions (1) and (2) immediately appears as an input stream FD to the head-space volume. anhe dissolved H2 and the vapor pressures for the liquid com- ponents in the reactor can be neglected. The initial absolute pressure within the reactor is 4.4 atm (50 psig). During normaH operation, the H2 generated obeys the Press gas law. The pressure control system on the H2 vent stream maintains the pressure, P, at 4.40 atm up to aflow of 11,400 mol/hr. The reactor vessel will fail when the pressure exceeds 45 atm or the temperature exceeds 600 K.
Additional information:
. The concentrations in the reactor at the end of the reactor heating at 422 K are CA0 = 4.3 mol/dm3, CB0 = 5.1 mol/dm3, C10 = 0.088 mol/dm3, and CS0 = 3 mol/dm3. The sensible heat of the two gas venting streams may be neglected.
Problem Statement
Plot and analyze the reactor temperature and the head-space pressure as a function of time along with the reactant concentrations for treactor when the reactor cooling fails to work (UA = 0). In Problem P13-1(f) you will be asked to redo the problem when the cooling water comes as expected whenever the reactor temperature exceeds 455 K.
Solution Procedure Overview
We will carry out a two-step perturbation of our Cadd in gorithm by adding a mole balance on the reactor head space in order to determine the pressure in the reactor as afunction of time. (1) In step 1 we will use the usual mole balance step, coupled with rate laws, stoichiometry, and energy balances to determine the rate of H2 generation. Because there is no accumulation of H2 in the reactor, H2 flows out of the reactor into the head space. (2) In step 2 we perform a mole balance on the head space to determine the pressure in the head space and reactor. The remaining steps are part of our CRE algorithm ttOat will allow us to determine temperature, concen- tration, and pressure as a function of time.
(1) Reactor Mole Balances:
Reactor (Assume Constant Volume Batch) Liquid
Liquid
(2) Head-Space Mole Balance:
Let ND = moles of gas D (i.e., H2) in the reactor vapor space VV. The flows in and out of the head space are shown in the figure below.

A balance on species D (H2) in the head-space volume VH yields
Accum = In − Out
where Fvent is the molar flow rate of gas out of the head space through one or both outlet lines, and FD (i.e., ) is the molar rate of gas leaving the liquid and entering the head space and is equal to the hydrogen generated in the liquid (see relative rates and net rates wh ere algorithm where V0 is the liquid reactor volume).
The assumptions of a perfect gas in the head-space volume and modest changes in T allow Equation (E13-6.4) to be written in terms of total gas pres- sure in the reactor head space
Substituting for ND in Equation (E13-6.3) and rearranging
(3) How the Venting Works:
Gas exits the reactor through the pressure control valve line. At low gas pro- duction rates, the pressure control valve maintains set-point pressure at the initial pressure by venting all produced gas until the rate of gas production reaches 11,400 mol/hr.
We now need to know a little more about the venting system for H2 and the condition for flow out the vent. As the pressure increases, but is still below the rupture disk setting, the pressure control atmosphereo the atmosphere (1 atm) according to the equation
where P essure absolute pressure in the reactor (atm), 1 atm is the downstream pressure (atmospheric), and the pressure control correlation constant is 3,360 mol/hr.atm. If the pressure P within the reactor exceeds 28.2 atm (400 psig), the relief thee activated by the rupture disk breain and vents gas in the reactor at the rate given .
After the rupture disk blowout at P = 28.2 atm, both the pressure control line and the rupture drea ctors vent the reactor according to the equation
Equations (E13-6.7) through (E13-6.10) can then be used to describe the Fvent flow rate with time for the appropriate logic for the values of FD and P.
(4) Rates:
Laws:
(1)
Relative Rates:
(1)
(2)
Net Rates:
(5) Stoichiometry:
Neglect reactor-liquid volume change form loss of product gases.
(6) Energy Balance:
Applying Equation (E13-23) to a batch system
Substituting for the rate laws and
(7) Numerical Solutions : “Tricks of the Trade”
A rapid change of temperature and pressure is expected as Reaction (2) starts to runaway. This typically results in a “stiff” system of ordinary differential equations, which can become numerically unstable and generate incorrect results. This instability can be prevented by using a software switch (SW) that will set all derivates to zero when the reactor reaches the explosion temperature or pressure. This switch can havetiOn form of Equation (E13-6.26) in Polymath and can be multiplied by the right-hand side of all the differential equations in this problem. This operation will halt (or freeze) the dynamics when the temperature T becomes higher than 600 K or the pressure exceeds 45 atm.
See tutorial at http://www.umich.edu/~elements/5e/tutorials/Polymath_Tutorial_to_solve_numerically_unstable_systems.pdf.
We now will solve the essential equations from (E13-6.1) through (E13-6.26) for the scenario where there is no cooling and thus UA = 0. Also the switch SW1 must be implemented in all the differential equations as discussed above.
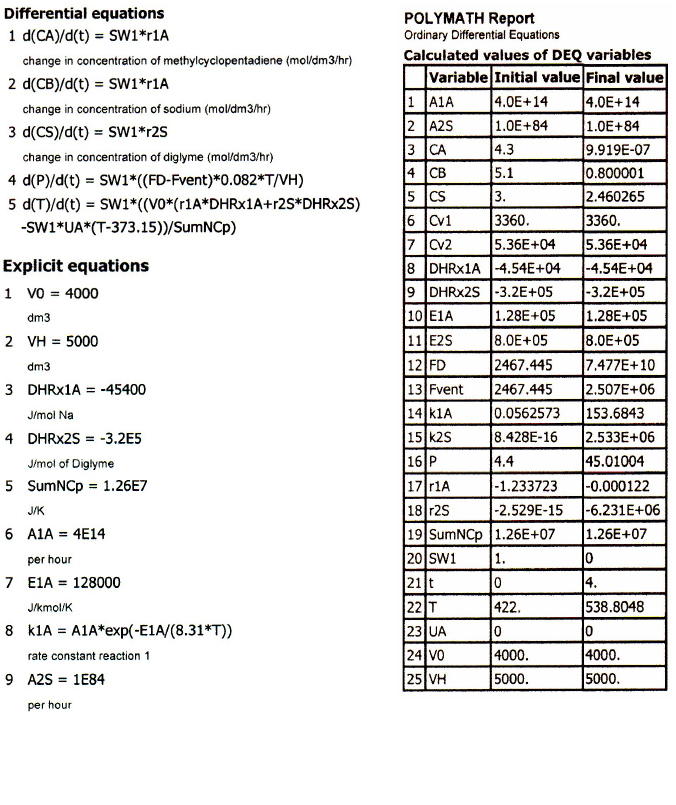
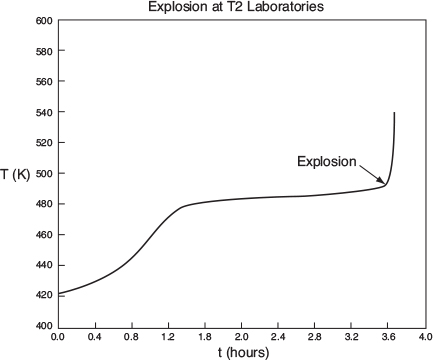


Note: The second reaction took off about 3.6 hours after starting the reactor.
We note from Figures E13-6.3(a)-(b) that the explosion occurred at approximately 3.6 h after startup and the concentration of diglyme begins to drop sharply before that point, as seen in Figure E13-6(c). We also note that numerical instabilities occur at about the point of the arrows in these figures because of the rapid increase in temperature.
Analysis: Runaway would not have occurred if (1) the cooling system had not failed, causing the reactor temperature to rise and initiate a second a reaction, and (2) the solvent dygline had not decomposed at the higher temperature to produce hydrogen gas (D). The rate of production of H2 gas was greater than the removal of H2 from the head space, causing the pressure to build up to the point that it ruptured the reactor vessel.
Summary
1. The energy balance on unsteady operation of a CSTR and semibatch reactors
Using the heat exchange Equation (13-12) and neglecting shaft work
For large coolant flow rates, , Equation (13-22) reduces to
2. Batch reactors
a. Non-adiabatic
where
b. Adiabatic
3. Semibatch reactors and startup of CSTR
Where is the same as Equation (S13-7) and from semibatch) is
4. Multiple reactions ( reactions and species)
where i = reaction number and j = species.
1. The Professional Reference Shelf contains topics that could just as well go under “Expanded Material” (found at: http://umich.edu/~elements/5e/13chap/prof.html)
2. Web Problem WP13-1B Multiple Reactions in a Batch Reactor (http://umich.edu/~elements/5e/13chap/expanded_ch13_homeproblem.pdf)
• Learning Resources (http://umich.edu/~elements/5e/13chap/learn.html)
1. Summary Notes (http://umich.edu/~elements/5e/13chap/summary.html)
2. Self-Tests (http://umich.edu/~elements/5e/13chap/summary-selftest.html)
A. Exercises (http://umich.edu/~elements/5e/13chap/add.html)
B. i>clicker Questions (http://umich.edu/~elements/5e/13chap/iclicker_ch13_q1.html)
3. Web links: SAChE Safety Web site (www.sache.org). You will need to get the user name and password from your department chair. The kinetics (i.e., CRE) text, examples, and problems are marked K in the product sections: Safety, Health, and the Environment (S,H, & E).
4. Solved Problems
A. Example CD13-1 Use of the ARSST (http://umich.edu/~elements/5e/13chap/learn-cdp13-1.html)
B. Example CD13-2 Startup of a CSTR (http://umich.edu/~elements/5e/13chap/learn-cdp13-2.html)
C. Example CD13-3 Falling Off the Steady State (http://umich.edu/~elements/5e/13chap/learn-cdp13-3.html)
D. Example CD13-4 Proportional-Integral (PI) Control (http://umich.edu/~elements/5e/13chap/learn-cdp13-4.html)
• Living Example Problems (http://umich.edu/~elements/5e/13chap/live.htmi)
1. Example 13-1 Adiabatic Batch Reactor
2. Example 13-2 Safety in Chemical Plants with Exothermic Runaway Reactions
3. Example 13-3 Startup of a CSTR
4. Example 13-4 Heat Effects in a Semibatch Reactor
5. Example 13-5 Multiple Reactions in a Semibatch Reactor
6. Example 13-6 Explosion at T2 Laboratories
7. PRS Example CD13-1 Falling Off the Upper Steady State
8. PRS Example CD13-2 Integral Control of a CSTR
9. PRS Example CD13-3 Proportion-Integral Control of a CSTR
10. Example R13-4 Linear Stability
11. Example R13-1 Use of ARSST
• FAQs (Frequently Asked Questions)
(http://umich.edu/~elements/5e/13chap/faq.html)
• Professional Reference Shelf
(http://umich.edu/~elements/5e/13chap/prof.html)
R13.1 The Complete ARSST (http://umich.edu/~elements/5e/13chap/pdf/CD_ARSST_ProfRef.pdf) In this section, further details are given to size safety valves to prevent runaway reactions.
R13.2 Falling Off the Upper Steady State (http://umich.edu/~elements/5e/13chap/prof-uppersteadystate.html)
R13.3 Control of a CSTR (http://umich.edu/~elements/5e/13chap/pdf/controlCSTR.pdf) In this section, we discuss the use of proportional (P) and integral (I) control of a CSTR. Examples include I and PI control of an exothermic reaction.
Proportional integral action
R13.4 Linearized Stability Theory (http://umich.edu/~elements/5e/13chap/pdf/CDjCH09Linearized_ProfRef3.pdf)
R13.5 Approach to Steady-State Phase-Plane Plots and Trajectories of Concentration versus Temperature (http://umich.edu/~elements/5e/13chap/prof-steadystate.html) Startup of a CSTR (Figure R13.5) and the approach to the steady state (CRE Web site). By mapping out regions of the concentration-temperature phase plane, one can view the approach to steady state and learn if the practical stability limit is exceeded. The steady-state trajectories are shown for the mole balance (MB = 0) and energy balance (EB = 0).

R13.6 Adiabatic Operation of a Batch Reactor (http://umich.edu/~elements/5e/13chap/prof-adiabaticbatch.html)
R13.7 Unsteady Operation of Plug-Flow Reactor (http://umich.edu/~elements/5e/13chap/prof-unsteadyplug.html)
Questions and Problems
Questions
Q13-1A i>clicker. Go to the Web site (http://www.umich.edu/~elements/5e/13chap/iclicker_ch13_q1.html) and view five i>clicker questions. Choose one that could be used as is, or a variation thereof, to be included on the next exam. You also could consider the opposite case and explain why the question should not be on the next exam. In either case, explain your reasoning.
Q13-2 Discuss with a classmate what are the most important safety considerations to address for exothermic reactions. To help answer this question, prepare a list of safety considerations for designing and operating chemical reactors. See the August 1985 issue of Chemical Engineering Progress.
Computer Simulations and Experiments
P13-1B Review the example problems in this chapter and use a software package such as Polymath, Wolfram, or MATLAB to carry out a parameter sensitivity analysis to answer the following “What iff...” questions.
What if...
(a) Example 13-1: LEP Batch Reactor
Wolfram
(i) Adiabatic Case: Use Wolfram to see if you can find a trajectory that is ready “to ignite” and whose trajectory looks like a “cobra” ready to strike, ![]() Vary T0 to learn the point at which the reaction runs away at 2500 s.
Vary T0 to learn the point at which the reaction runs away at 2500 s.
(ii) Heat Exchange Case: (1) Vary sliders to try to find a “cobra-like” trajectory, ![]() Vary Tal to learn the point at which the reaction runs away at 1500 s, the exit conversion as a function of T0. (2) Use the plot of Qy and Qg as a function of time to describe and explain what you see as you vary Tal, NA0, and mc from their maximum to minimum values. (3) Vary some of the other parameters and identify three things you find interesting and write a conclusion.
Vary Tal to learn the point at which the reaction runs away at 1500 s, the exit conversion as a function of T0. (2) Use the plot of Qy and Qg as a function of time to describe and explain what you see as you vary Tal, NA0, and mc from their maximum to minimum values. (3) Vary some of the other parameters and identify three things you find interesting and write a conclusion.
(iii) Write a conclusion on what you found in experiments (i) and (ii).
Polymath
(iv) Modify the Polymath code so that the ambient temperature, Ta, is not constant and the coolant flow rate is 100 kg/s and with a heat capacity of 4.18 J/g. Vary the coolant flow rate and describe how the temperature and conversion trajectories change.
(v) Modify the Polymath code to learn how your answers would change for the adiabatic case if the heat of the mixing had been neglected.
(vi) How much time would it take to achieve 90% conversion for adiabatic operation if the reaction were started on a very cold day where the initial temperature was 20°F? (Methanol won’t freeze at this temperature.)
(vii) Now, consider that a heat exchanger is added to the reactor for the propylene oxide reaction; the parameters are: CA0 = 1 lb-mol/ft3, V = 1.2 ft3, (ΣNiCP = 403 Btu°R), neglect ΔCP, UA = 0.22 Btu/°R/s, and Ta = 498 K. Plot and analyze the trajectories X, T, Qg, and Qr as a function of time.
(b) Example 13-2: Safety in Chemical Plants with a Runaway Reaction
Wolfram
(i) Use Wolfram to find a value of NA0 below which no explosion would occur when all other variables remain as in the base case. Repeat for NB0.
(ii) Use Wolfram to find the value of NCp and also of UA, above which no explosion would occur.
(iii) Write three conclusions related to safety from your experiments in (i) and (ii).
Polymath
(iv) Modify the Polymath code to show that no explosion would have occurred if the cooling was not shut off for the 9.04-kmol charge of ONCB, or if the cooling was shut off for 10 min after 45 min of operation for the 3.17-kmol ONCB charge.
(v) Modify the Polymath code to show that if the cooling had been shut off for 10 min after 12 h of operation, no explosion would have occurred for the 9.04-kmol charge.
(vi) Develop a set of guidelines as to when the reaction should be quenched should the cooling fail. Perhaps safe operation could be discussed using a plot of the time after the reaction began at which the cooling failed, t0, versus the length of the cooling failure period, tf, for the different charges of ONCB.
(vii) Find a set of parameter values that would cause the explosion to occur at exactly 12:18 A.M. For example, include the mass and heat capacities of the metal reactor and/or make a new estimate of UA.
(viii) Finally, what if a 1/2-in. rupture disk rated at 800 psi had been installed and did indeed rupture at 800 psi (270°C)? Would the explosion still have occurred? Note: The mass flow rate m varies with the cross-sectional area of the disk. Consequently, for the conditions of the reaction, the maximum mass flow rate out of the 1/2-in. disk can be found by comparing it with the mass flow rate of 830 kg/min of the 2-in. disk. Go to the Living Example Problems on the Web site and explore on your own the ONCB explosion described in Example 13-2. Explain what you would do to prevent an explosion of this type from ever occurring again while still operating at the triple production specified by management.


(c) Example 13-3: LEP CSTR Startup, Part 1
Wolfram
(i) What is the minimum coolant flow such that there is no upturn in temperature-concentration profile for Case 2 (Ti = 339 K, CAi = 0)?
(ii) Is it possible to prevent crossing of practical stability limit for Case 3 (Ti = 344 K, CAi = 2.26) by varying coolant temperature, coolant flow, or overall heat transfer coefficient within reasonable limit? If so, which is the parameter and which should be varied to achieve that?
(iii) Use Wolfram to find initial temperatures and concentrations that will cause the temperature trajectory to exceed the practical stability limit, and then write a conclusion.
Polymath
(iv) Consider the case when CAi = 0.1 lb mol/ft3 and Ti = 150°F. What is the minimum coolant temperature such that the practical stability limit is not exceeded?
(v) Describe what happens to the trajectories for an entering temperature of 70°F, an initial reactor temperature of 160°F, and an initial concentration of propylene oxide of 0.1 M.
(vi) Try various combinations of T0, Ti, and CAi, and report your results in terms of temperature-time trajectories and temperature-concentration phase planes.
(vii) Find a set of conditions above which the practical stability limit will be reached or exceeded, and those conditions below which it will not.
(viii) Vary the coolant flow rate and compare with the base case given in Figures E13-3.1 to E13-3.4. Describe what you find and then write a conclusion.
COMSOL CSTR Startup Part 2
(ix) Vary the tank volume between 1 m3 and 5 m3 and describe the differences in the trajectories and the time to reach steady state and exceeding a practical stability limit of 360 K.
(x) Use the base case parameters for the trajectory Ti = 340 K and Ci = 1400 mol/m3 to find the maximum feed temperature you can have that will not exceed the practical stability limit of 360 K?
(xi) Pick two operating parameters from υ0, Vtank, T0, Ta, mc, and UA to vary from minimum to maximum values, and describe what you find. You will know when the maximum or minimum value has been exceeded because an error message will be displayed.
(xii) Vary the activation energy, EA, between 50,000 J/mol and 120,000 J/mol and discuss the effect of EA on the number of oscillations to reach steady state.
(xiii) Write two conclusions from your COMSOL experiments (ix) through (xii).
(d) Example 13-4: LEP Semibatch
Wolfram
(i) Use Wolfram to vary CB0 and describe how the maximum in CC varies.
(ii) List the slider variables that have virtually no effect on the temperature trajectory. Repeat for the concentration trajectory.
(iii) Which parameter, when varied, causes the graphs of T and Ta2 to overlap each other?
(iv) What is the minimum inlet temperature such that 100% conversion of A is still achieved?
Polymath
(v) At what times will the number of moles of C (NC = CCV) and the concentration of species C reach a maximum?
(vi) Are the times in part (i) that these maximums occur different, and if so, why? What would the X versus t and T versus t trajectories look like if the coolant rate were increased by a factor of 10? Why is the reaction time (252s) so short?
(vii) Problem. Assume the surface area contacting the reacting fluid changes with time. The initial fluid volume in the reactor is 0.2 m3 and the inlet volumetric flow rate is 0.004 m3/s. Calculate the heat exchanger area as a function of time if the half-pipe jacket on page 664 is 0.5 m in diameter. Repeat for diameters of 1.0 m and 0.25 m.
(e) Example 13-5: LEP Multiple Reactions in a Semibatch Reactor
Wolfram
(i) Assume a secondary reaction ignites when the reactor temperature reaches 450K. Find the value (or combination thereof) of CA0 and υ0 above which the secondary reaction will ignite.
(ii) Vary CA0 and υ0 between their maximum and minimum values and describe how the concentration trajectories change and why they change the way they do.
(iii) Which parameter, when varied, results in equal concentration of A, B, and C at some point in time? What is the parameter value? Write two conclusions.
Polymath
(iv) Vary the volumetric flow rate (between 24 < υ0 < 1,000) and compare with the base case. Describe any trends you find.
(v) Plot and analyze the trajectories of NA = CAV and NB = CBV for long times (e.g., t = 15h). What do you observe?
(vi) Can you show for long times that NA = CACυ0/k1A and NB = CACυ0/2k2B?
(vii) What do you think is happening to this semibatch reactor if it has no lid and a maximum volume of 1,000 dm3 at long times?
(viii) If species B is the desired product, how would you maximize NB?
(f) Example 13-6: LEP T2 Laboratories Explosion Wolfram
(i) Vary the liquid volume, V0, and learn its effect on pressure profile. What is the critical value of υ0 at which pressure shoots up?
(ii) Which parameter will you vary such that concentration of B is always higher than concentration of C?
(iii) Vary different parameters and check if it is possible that the temperature limitation is reached before the pressure limitation.
(iv) Find a value of the heat of reaction for the secondary reaction of diglyme, below which no explosion would have occurred, and then write a conclusion.
Polymath
(v) View the Chemical Safety Board (CSB) video online and read the supporting reports (http://www .csb.gov/t2-laboratories-inc-reactive-chemical-explosiori). Also search the Web for “T2 explosion video."
(vi) (a) What did you learn from watching the video? (b) Suggest how this reactor system should be modified and/or operated in order to eliminate any possibility of an explosion. (c) Would you use backup cooling and, if so, how? (d) How could you learn if a second reaction could be set in at a higher temperature? Hint: See PRS R13.1 The Complete ARSST.
(vii) Download the Living Example Polymath E13-6. Plot CA, CB, CC, P, and T as a function of time. Vary UA between 0.0 and 2.77X10⁶ J/h/K to find the lowest value of UA that you observe a runaway to find the value of UA below which you would observe runaway. Describe the trends as you approach runaway. Did it occur over a very narrow range of UA values? Hint: The problem becomes very stiff near the explosion condition when T > 600 K or P > 45 atm. If the temperature or pressure reaches these values, set all derivatives (concentration changes, temperature change, and pressure change) and reaction rates equal to zero so that the numerical solution will complete the analysis and hold all variables at the explosion point of the reactor.
(viii) Now let’s consider the actual operation in more detail. The reactor contents are heated from 300 K to 422 K at a rate of Q = 4 K/minute. At 422 K, the reaction rate is sufficient such that heating is turned off. The reactor temperature continues to rise because the reaction is exothermic, and, when the temperature reaches 455 K, the cooling water turns on and cooling is initiated. Model this situation for the case when UA = 2.77X10⁶ J/h/K and when UA = 0.
(ix) What is the maximum time in minutes that the cooling can be lost (UA = 0) starting at the time when the reactor temperature reaches 455 K so that the reactor will not reach the explosion point? The conditions are those of part (1) of this problem.
(x) Vary the parameters and operating conditions and describe what you find.
(g) LEP PRS R13.2 Example CD13-5. Download the Living Example Problem for Falling Off the Upper Steady State. Try varying the entering temperature, T0, between 80°F and 68°F, and plot the steady-state conversion as a function of T0. Vary the coolant rate between 10,000 and 400 mol/h. Plot conversion and reactor temperature as a function of coolant rate.
(h) LEP PRS R13.3 Example CD13-2. Download the Living Example Problem. Vary the gain, kC, between 0.1 and 500 for the integral controller of the CSTR. Is there a lower value of kC that will cause the reactor to fall to the lower steady state or an upper value to cause it to become unstable? What would happen if T0 were to fall to 65°F or 60°F?
Integral Controller
(i) LEP PRS R13.3 Example CD13-3. Download the Living Example Problem. Learn the effects of the parameters kc and τI. Which combination of parameter values generates the least and greatest oscillations in temperature? Which values of kC and τI return the reaction to steady state the quickest?
(j) SAChE. Go to the SAChE Web site (www.sache.org). On the left-hand menu, select “SaChe Products.” Select the “All” tab and go to the module entitled: “Safety, Health and the Environment (S, H & E).” The problems are for KINETICS (i.e., CRE). There are some example problems marked K and explanations in each of the above S, H & E selections. Solutions to the problems are in a different section of the site. Specifically look at: Loss of Cooling Water (K-1), Runaway Reactions (HT-1), Design of Relief Values (D-2), Temperature Control and Runaway (K-4) and (K-5), and Runaway and the Critical Temperature Region (K-7). Go through the K problems and write a paragraph on what you have learned. Your instructor or department chair should have the username and password to enter the SAChE Web site in order to obtain the module with the problems.
Problems
P13-2B The following is an excerpt from The Morning News, Wilmington, Delaware (August 3, 1977): “Investigators sift through the debris from blast in quest for the cause [that destroyed the new nitrous oxide plant]. A company spokesman said it appears more likely that the [fatal] blast was caused by another gas—ammonium nitrate— used to produce nitrous oxide.” An 83% (wt) ammonium nitrate and 17% water solution is fed at 200°F to the CSTR operated at a temperature of about 510°F. Molten ammonium nitrate decomposes directly to produce gaseous nitrous oxide and steam. It is believed that pressure fluctuations were observed in the system and, as a result, the molten ammonium nitrate feed to the reactor may have been shut off approximately 4 min prior to the explosion.
(a) Can you explain the cause of the blast?
(b) If the feed rate to the reactor just before shutoff was 310 lbm of solution per hour, what was the exact temperature in the reactor just prior to shutdown? Use the data to calculate the exact time it took for the reactor to explode after the feed was shut off to the reactor.
Assume that at the time the feed to the CSTR stopped, there was 500 lbm of ammonium nitrate in the reactor at a temperature of 520°F. The conversion in the reactor is virtually complete at about 99.99%. Additional data for this problem are given in Problem 12-5C. How would your answer change if 100 lbm of solution were in the reactor? 310 lbm? 800 lbm? What if T0 = 100°F? 500°F? How would you start up or shut down and control such a reaction?
Safety: Shut Down an Open-Ended Problem. Rather than shut off the total feed to the reactor, it should be diluted with pure water at a volumetric rate υ,^ while reducing the ammonium nitrate reactant feed rate. Keep the same total volumetric feed υ0 rate and entering temperature. Choose a υw and plot the reactor temperature and composition as a function of time. At what time could you shut off the water feed safely?
P13-3B The liquid-phase reaction in Problems P11-4A and P12-7A is to be carried out in a semibatch reactor. There are 500 mol of A initially in the reactor at 25°C. Species B is fed to the reactor at 50°C and a rate of 10 mol/min. The feed to the reactor is stopped after 500 mol of B has been fed.
(a) Plot and analyze the temperature and conversion as a function of time when the reaction is carried out adiabatically. Calculate to t = 2 h.
(b) Plot and analyze the conversion as a function of time when a heat exchanger (UA = 100 cal / min · K) is placed in the reactor and the ambient temperature is constant at 50°C. Calculate to t = 3 h.
(c) Repeat part (b) for the case where the reverse reaction cannot be neglected.
New parameter values:
k = 0.01 (dm3/mol · min) at 300 K with E = 10 kcal/mol
V0 = 50 dm3, υ0 = 1 dm3/min, CA0 = CB0 = 10 mol/dm3
For the reverse reaction: kr = 0.1 min-1 at 300 K with Er = 16 kcal/mol
P13-4B Sophia and Nic are operating a batch reactor at their grandfather’s plant in Kärläs, Jofostan. The reaction is first-order, irreversible, liquid-phase, and exothermic. An inert coolant is added to the reaction mixture to control the temperature. The temperature is kept constant by varying the flow rate of the coolant (see Figure P13-4B).
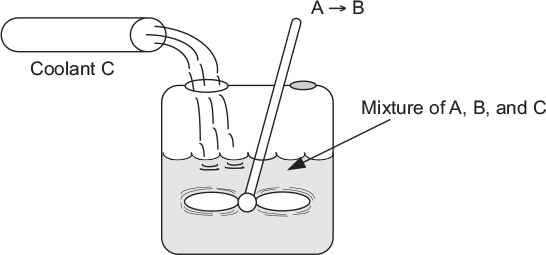
(a) Help them calculate the flow rate of the coolant 2 h after the start of the reaction. (Ans.: FC = 3.157 lb/s.)
(b) It is proposed that rather than feeding a coolant to the reactor, a solvent be added that can be easily boiled off, even at moderate temperatures. The solvent has a heat of vaporization of 1000 Btu/lb and initially there are 25 lb-mol of A placed in the tank. The initial volume of solvent and reactant is 300 ft3. Determine the solvent evaporation rate as a function of time. What is the rate at the end of 2 h?
Additional information:
Temperature of reaction: 100°F
Value of k at 100°F: 1.2 X 10⁻⁴ s-1
Temperature of coolant: 80°F
Heat capacity of all components: 0.5 Btu/lb -°F
Density of all components: 50 lb/ft3
Initially:
Vessel contains only A (no B or C present)
CA0: 0.5 lb-mol/ft3
Initial volume: 50 ft3
W2014 CRE U of M MidTermII
P13-5B The reaction
is carried out adiabatically in a constant-volume batch reactor. The rate law is
Plot and analyze the conversion, temperature, and concentrations of the reacting species as a function of time.
Additional information:
P13-6B The elementary irreversible liquid-phase reaction
is to be carried out in a semibatch reactor in which B is fed to A. The volume of A in the reactor is 10 dm3, the initial concentration of A in the reactor is 5 mol/dm3, and the initial temperature in the reactor is 27°C. Species B is fed at a temperature of 52°C and a concentration of 4 M. It is desired to obtain at least 80% conversion of A in as short a time as possible, but at the same time the temperature of the reactor must not rise above 130°C. You should try to make approximately 120 mol of C in a 24-hour day, allowing for 30 minutes to empty and fill the reactor between each batch. The coolant flow rate through the reactor is 2000 mol/min. There is a heat exchanger in the reactor.
(a) What volumetric feed rate (dm3/min) do you recommend?
(b) How would your answer or strategy change if the maximum coolant rate dropped to 200 mol/min? To 20 mol/min?
Additional information:
P13-7B The irreversible reaction liquid phase in Problems P11-4A and P12-7A
is to be carried out in a 10-dm3 batch reactor. Plot and analyze the temperature and the concentrations of A, B, and C as a function of time for the following cases:
(a) Adiabatic operation.
(b) Values of UA of 10,000, 40,000 and 100,000 J/min · K.
(c) Use UA = 40,000 J/min · K and different initial reactor temperatures.
An equal molar feed in A and B enters at 27°C, and the volumetric flow rate is 2 dm3/s and CA0 = 0.1 kmol/m3.
Additional information:
P13-8B Use the reaction and corresponding parameter values in Problem P12-16B to describe the startup of a CSTR with Ti = 25°C and CAi = 0.0. nnt: Plot the concentration and temperature trajectories as well as the phase plan plots of CA versus T for various values of Ti and CAi.
P13-9B The following reactions are taking place in a 2000-dm3 liquid-phase batch reactor under a pressure of 400 psig
The initial temperature is 450 K and the initial concentrations of A, B, and C are 1.0, 0.5, and 0.2 mol/dm3, respectively. The coolant flow rate was at its maximum value so that Ta1 = Ta2 = Ta = 400 K, so that the product, the exchange area, and the overall heat transfer coefficient, UA, is UA = 100 cal/s · K.
(a) If Qr > Qg at time t = 0, and there is no failure of the heat exchange system, is there any possibility that the reactor will run away? Explain.
(b) What is Qr at t = 0?
(c) What is Qg at t = 0?
(d) What is the initial rate of increase in temperature, (i.e., dT/dt) at t = 0?
(e) Suppose that the ambient temperature Ta is lowered from 400 K to 350 K; what is the initial rate of reactor temperature change?
Plot the temperatures and all the concentrations as a function of time up to t = 1000 s.
(f) A suggestion was made to add 50 moles of inerts at a temperature of 450 K. Will the addition of the inerts make runaway more likely or less likely? How? Show quantitatively.
Additional information:
As a first approximation, assume all heats of reaction are constant (i.e., Δθ>.. = 0). Specific reaction rates at 450 K are
P13-10B The reactions on the CRE Web site in Problem CD12GA2 are to be carried out in a semibatch reactor. How would you carry out this reaction (i.e., T0, υ0 , T¡)? The molar concentrations of pure A and pure B are 5 and 4 mol/dm3, respectively. Plot and analyze the concentrations, temperatures, and the overall selectivity as a function of time for the conditions you chose.
• Additional Homework Problems
A number of homework problems that can be used for exams or supplementary problems or examples are found on the CRE Web site, www.umich.edu/~elements/5e/index.html.
Supplementary Reading
1. A number of solved problems for batch and semibatch reactors can be found in
WALAS, S. M., Chemical Reaction Engineering Handbook. Amsterdam: Gordon and Breach, 1995, pp. 386-392, 402, 460-462, and 469.
Safety
CROWL, DANIEL A., and JOSEPH F. LOUVAR, Chemical Process Safety: Fundamentals with Applications, 3rd ed. Upper Saddle River, NJ: Prentice Hall, 2001.
EDGAR, T. F., “From the Classical to the Postmodern Era,” Chem. Eng. Educ., 31, 12 (1997). KLETZ, TREVOR A., “Bhopal Leaves a Lasting Legacy: The Disaster Taught Some Hard Lessons That the Chemical Industry Still Sometimes Forget h mical Processing, p. 15 (Dec. 2009).
Links
1. The SAChE Web site has a great discussion on reactor safety with examples (www.sache.org). You will need a username and password; both can be obtained from your department chair. Hit the 2003 Tab. Go to K Problems. Links

Links
2. The reactor lab developed by Professor Herz and discussed in Chapters 4 and 5 could also be used here: www.reactorlab.net.
3. See the Center for Chemical Process Safety (CCPS) Web site, www.aiche.org/ccps/.