Chapter 2. Introduction to Azure Sentinel
Given the threat landscape presented in Chapter 1, there is a clear need for a system that can collect data from different sources, perform data correlation, and present this data in a single dashboard.
Azure Sentinel delivers intelligent security analytics and threat intelligence across the enterprise, providing a single solution for alert detection, threat visibility, proactive hunting, and threat response. Azure Sentinel natively incorporates proven foundation services from Azure, such as Log Analytics and Logic Apps. Also, Azure Sentinel enriches your investigation and detection with Artificial Intelligence (AI) in conjunction with Microsoft's threat intelligence stream.
In this chapter, you will learn more about the architecture, design considerations, and initial configuration of Azure Sentinel.
Architecture
Because Azure Sentinel is part of Azure, the first prerequisite to deployment is to have an active Azure subscription. As with any other security information and event management (SIEM), Azure Sentinel needs to store the data that it will collect from the different data sources that you configure. Azure Sentinel will store this data in your preferred Log Analytics workspace. You can create a new workspace or use an existing one. However, it is recommended that you have a dedicated workspace for Azure Sentinel because alert rules and investigations do not work across workspaces. Keep in mind that you need at least contributor permission for the subscription in which the workspace resides.
Tip
All the data you stream to Azure Sentinel is stored in the geographic location of the workspace you selected.
To help you to better understand Azure Sentinel’s architecture, you need to first understand the different components of the solution. Figure 2-1 shows a diagram of the major Azure Sentinel components.
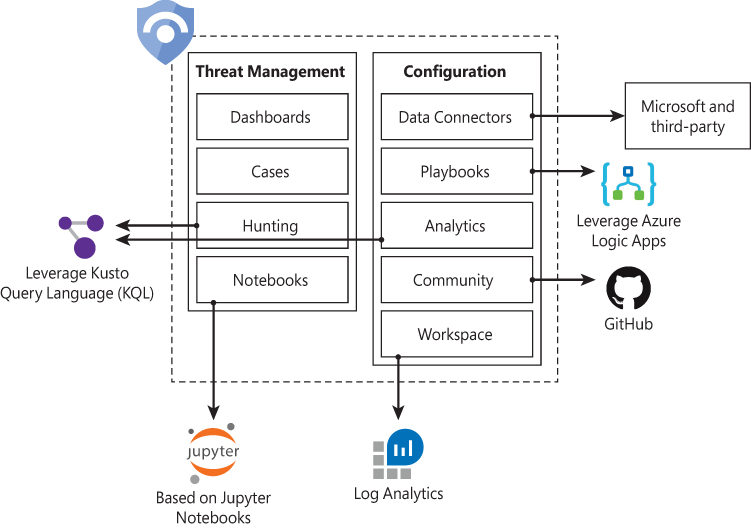
The components shown in Figure 2-1 are presented in more detail below:
Dashboards: Built-in dashboards provide data visualization for your connected data sources, which enables you to deep dive into the events generated by those services. You will learn more about dashboards in Chapter 8, “Data visualization.”
Cases: A case is an aggregation of all the relevant evidence for a specific investigation. It can contain one or multiple alerts, which are based on the analytics that you define. You will learn more about cases in Chapter 4, “Case management.”
Hunting: This is a powerful tool for investigators and security analysts who need to proactively look for security threats. The searching capability is powered by Kusto Query Language (KQL). You will learn more about hunting in Chapter 5, “Hunting.”
Notebooks: By integrating with Jupyter notebooks, Azure Sentinel extends the scope of what you can do with the data that was collected. The notebooks feature combines full programmability with a collection of libraries for machine learning, visualization, and data analysis. You will learn more about notebooks in Chapter 6, “Notebooks.”
Data Connectors: Built-in connectors are available to facilitate data ingestion from Microsoft and partner solutions. You will learn more data connectors later in this chapter.
Playbooks: A Playbook is a collection of procedures that can be automatically executed upon an alert triggered by Azure Sentinel. Playbooks leverage Azure Logic Apps, which help you automate and orchestrate tasks/workflows. You will learn more about playbooks in Chapter 7, Automation with Playbooks.”
Analytics: Analytics enable you to create custom alerts using Kusto Query Language (KQL). You will learn more about analytics in Chapter 3, “Analytics.”
Community: The Azure Sentinel Community page is located on GitHub, and it contains Detections based on different types of data sources that you can leverage in order to create alerts and respond to threats in your environment. The Azure Sentinel Community page also contains hunting query samples, playbooks, and other artifacts. You will learn more about community in Chapter 3, “Analytics.”
Workspace: Essentially, a Log Analytics workspace is a container that includes data and configuration information. Azure Sentinel uses this container to store the data that you collect from the different data sources. You will learn more about workspace configuration later in this chapter.
Adoption considerations
Although Azure Sentinel is a cloud-based SIEM, there are some initial design considerations that you must be aware of. When planning Azure Sentinel adoption, use the following list of questions as the foundation for your initial assessment. This will help you to identify the areas from which you need to obtain more details before deploying Azure Sentinel:
Who has permission to deploy Azure Sentinel in my tenant?
Azure Sentinel uses a Role-Based Access Control model and enables you to set granular levels of permissions for different needs. There are three built-in roles available for Azure Sentinel, they are:
Azure Sentinel reader: enable the user to view incidents and data but cannot make changes.
Azure Sentinel responder: enable the user to read and perform some actions on incidents, such as assign to another user or change the incident’s severity.
Azure Sentinel contributor: enable the user to read, perform some actions on incidents and create or delete analytic rules.
To deploy Azure Sentinel on your tenant you need contributor permissions to the subscription in which the Azure Sentinel workspace resides.
Note: All Azure Sentinel built-in roles grant read access to the data in your Azure Sentinel workspace.
What permissions do the team members require to do their jobs using Azure Sentinel?
It is important to plan who will have access to the Azure Sentinel Dashboard. Depending on how the organization is structured, you may have different teams handling different areas of Azure Sentinel. For example, the SecOps team might be actively looking at new alerts, while the Threat Hunting Team might be performing proactive hunting. Again, leverage the RBAC model to assign granular permissions to different groups.
Consider the different scenarios, such as creating cases, closing cases, creating new analytics, using hunting queries, and writing playbooks.
Am I going to deploy Azure Sentinel in a single or multitenant scenario?
Azure Sentinel can be deployed in both scenarios. In a multitenant scenario, you can deploy Azure Sentinel on each tenant and use Azure Lighthouse to have a multitenant visualization of all tenants.
What are the data sources from which I want to ingest data?
That’s probably one of the most critical questions to ask in the beginning of the project. By having a list of data sources that you want to connect to Azure Sentinel, you can evaluate whether there are built-in connectors for the target system or whether you will need to use another method to connect. Here, you should also define whether you are going to ingest data only from cloud resources or if you also plan to collect data from on-premises resources.
Make sure to prioritize the data sources that are more important for your business. If you are just performing a proof-of-concept, ensure that you connect to the primary Microsoft services that are used by your organization and at least a couple of on-premises resources that will be utilized in production.
Do I already have Azure Security Center deployed and monitoring my servers?
If you already have Azure Security Center deployed and you are using the default workspace created by Security Center, you need to be aware that you can’t enable Azure Sentinel on this default workspace. However, if you are using a custom workspace in Azure Security Center, you can enable Azure Sentinel on this workspace. You will find more details about workspace design in “Enabling Azure Sentinel,” later in this chapter.
These are key questions that you must answer before you start configuring Azure Sentinel. Once you answer these questions—and others that may be very specific to your type of organization—you are ready to enable Azure Sentinel in your Azure subscription.
Enabling Azure Sentinel
Azure Sentinel is available in Azure Portal, and to enable it, you need a Log Analytics workspace. A Log Analytics workspace provides:
A geographic location for data storage.
Data isolation by granting different users access rights following the Log Analytics’ recommended design strategies for workspaces; these recommendations can be found at http://aka.ms/asbook/workspacedesign.
A scope for configuration of settings, such as pricing tier, retention, and data capping.
Although Azure Sentinel supports multiple workspaces for some scenarios, it is recommended that you use a centralized workspace because alert rules and investigations do not function across workspaces.
Note
To learn more about workspace design consideration and Role-Base Access Control (RBAC) for workspaces, visit http://aka.ms/asbook/workspaces and http://aka.ms/asbook/workspacesbp.
The following steps assume that you don’t have a workspace and that you will create one as part of the Azure Sentinel deployment:
Open Azure Portal and sign in with a user who has contributor privileges in the subscription in which the Azure Sentinel workspace resides.
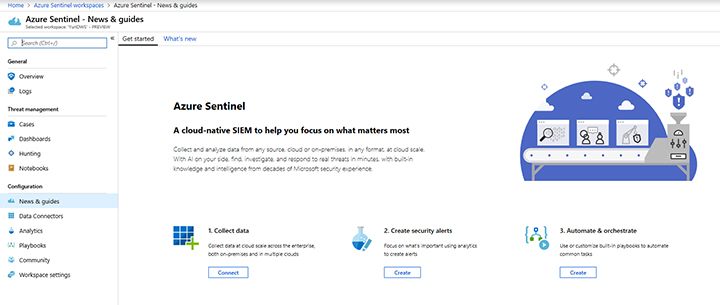
Under All services, type Sentinel and click Azure Sentinel, as shown in Figure 2-2.

FIGURE 2-2 Accessing Azure Sentinel in Azure Portal When Azure Sentinel launches for the first time, there is no workspace associated to it; the initial blade will look similar to Figure 2-3.
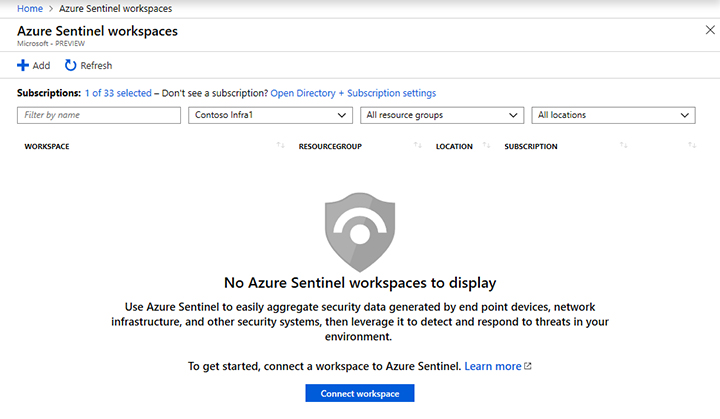
FIGURE 2-3 Azure Sentinel workspace selection page At this point, you can either click the Add button or click the Connect Workspace button. Both options will lead you to the Choose a workspace to add to azure sentinel page, as shown in Figure 2-4.
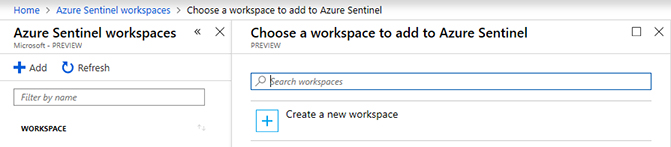
FIGURE 2-4 Adding a new workspace to Azure Sentinel Click the Create a new workspace option; the Log analytics workspace page appears, as shown in Figure 2-5.
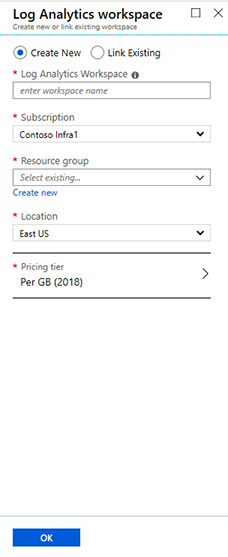
FIGURE 2-5 Creating a new workspace to be used by Azure Sentinel In the Log Analytics Workspace field, type a name for the workspace.
In the Subscription field, select the subscription that you want to use.
From the Resource group drop-down menu, select the resource group you want to use.
From the Location drop-down menu, select the location where the workspace will reside.
For the Pricing tier, select Per GB.
After completing those fields, click the OK button.
On the Choose a workspace to add to Azure Sentinel page, select the workspace that you just created and click the Add Azure Sentinel button; the initial Azure Sentinel dashboard appears, as shown in Figure 2-6.
Now that you have your workspace configured, you are ready to start ingesting data from different sources. We’ll cover that in the next section.
Data ingestion
Azure Sentinel enables you to use data connectors to configure connections with different Microsoft services, partner solutions, and other resources. There are several out-of-the-box data connectors available in Azure Sentinel, and there are different ways to ingest data when a connector is not available. Figure 2-7 shows a diagram of the available options.
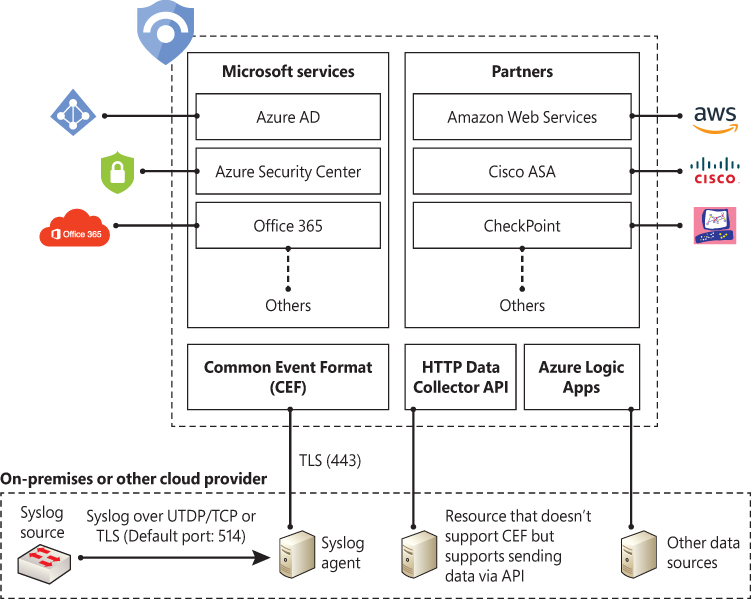
Figure 2-7 only shows a small subset of Microsoft services. At the time this chapter was written, Azure Sentinel provided support for the following Microsoft services:
Azure AD
Office 365
Cloud App Security
Azure Activity Log
Azure AD Identity Protection
Azure Information Protection
Azure ATP
Azure Security Center
Domain Name Server
Microsoft Defender ATP
Microsoft Web Application Firewall
Windows Firewall
Windows Security Events
The diagram also shows a subset of partners’ connectors. The number of connectors may change over time as Microsoft continues to encourage other vendors to partner and create new connectors. At the time this chapter was written, the following external connectors were available:
Amazon Web Services (AWS)
Barracuda
Check Point
Palo Alto Networks
Fortinet
F5
Symantec ICDX
If an external solution is not on the data connector list, but your appliance supports saving logs as Syslog Common Event Format (CEF), the integration with Azure Sentinel is available via CEF Connector. If CEF support is not available on your appliance, but it supports calls to a REST API, you can use the HTTP Data Collector API to send log data to the workspace on which Azure Sentinel is enabled. Data ingestion from some of these connectors requires a license, while some others are free. To see an updated pricing list for the connectors, visit http://aka.ms/asbook/dataconnectors.
Tip
To learn how to use the HTTP Data Collector API to send log data to a workspace from a REST API client, visit http://aka.ms/asbook/datacollectorapi.
Ingesting data from Microsoft solutions
One way to quickly start validating Azure Sentinel’s data ingestion is to start the configuration by using Microsoft built-in connectors. To visualize data from the subscription-level events that have occurred in Azure—which includes data ranging from Azure Resource Manager (ARM) operational data to updates on service health events—you can start with Azure Activity Log. Follow the steps below to connect with Azure Activity Log:
Open Azure Portal and sign in with a user who has contributor privileges for the workspace on which Azure Sentinel will be enabled and the resource group.
Under the All services option, type Sentinel and click Azure Sentinel when it appears at the lower right, as shown in Figure 2-8.

FIGURE 2-8 Accessing Azure Sentinel in Azure Portal Click in the workspace that was created in the “Enabling Azure Sentinel” section, earlier in this chapter.
When the Azure Sentinel dashboard opens, click Data Connectors under Configuration in the left navigation pane.
From the list of connectors, click AzureActivity; the AzureActivity page will appear, as shown in Figure 2-9.
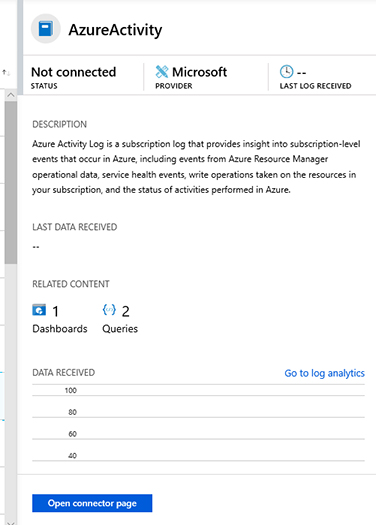
FIGURE 2-9 Azure Activity Log connector blade Click the Open Connector Page button, and you will see the Instructions tab, as shown in Figure 2-10.
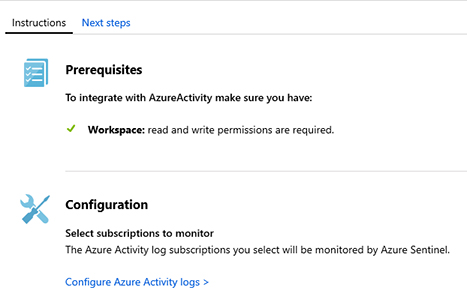
FIGURE 2-10 Instructions tab with more details about prerequisites and configuration Click the Configure Azure Activity logs option, and the Azure Activity Log page appears. Click the subscription to which you want to connect and click the Connect button.
Wait until you see a notification indicating the subscription was successfully connected and click the Refresh button. Ensure that the status has changed to Connected and close each blade until you see the main Data Connectors page.
Click Overview under General in the left navigation pane.
On the Overview page, you will see that there is no activity yet; this is expected because you just initiated the ingestion of Azure Activity Logs. Now you will generate some activity, and at the end of this chapter, you will check how the data flowed to Azure Sentinel. Create a new Virtual Machine with the following specifications:
Operating System: Windows Server 2016.
Resource Group: Use the same resource group that you created for the workspace in the “Enabling Azure Sentinel” section, earlier in this chapter.
Remote Desktop Connection: Enabled.
Connecting to Azure Security Center
If you have Azure Security Center enabled in your subscription, you can start ingesting the Security Alerts generated by Security Center, which provides a rich set of threat detections. Security Center will generate alerts according to the different resource types:
Infrastructure as a Service (IaaS), Virtual Machines (VMs), and non-Azure servers
Native compute
Data services
You need the Azure Security Center standard tier in order to connect with Azure Sentinel. Follow the steps below to connect to Security Center and start streaming security alerts to Azure Sentinel:
Open Azure Portal and sign in with a user who has contributor privileges for the workspace on which Azure Sentinel will be enabled as well as the resource group.
Under the All services option, type Sentinel, and click Azure Sentinel, as shown in Figure 2-11.
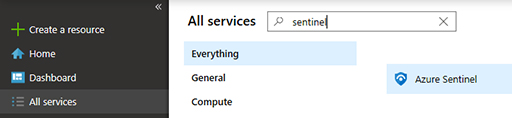
FIGURE 2-11 Accessing Azure Sentinel in Azure Portal Click in the workspace that was created in the “Enabling Azure Sentinel” section, earlier in this chapter.
When the Azure Sentinel dashboard opens, click Data Connectors under Configuration in the left navigation pane.
Click Azure Security Center, and a new pane appears on the right side, as shown in Figure 2-12.
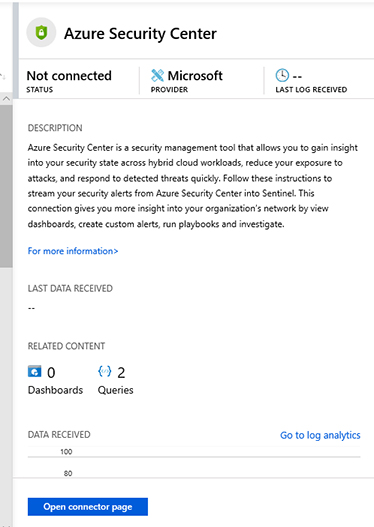
FIGURE 2-12 Azure Security Center connector Click Open Connector Page button and the full Azure Security Center connector page appears, as shown in Figure 2-13.
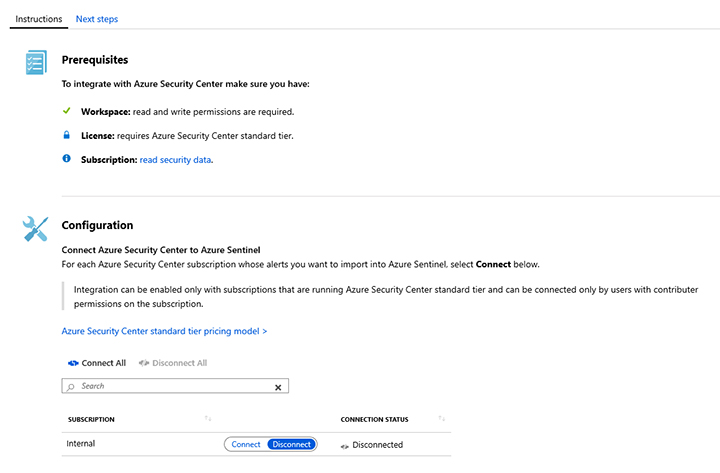
FIGURE 2-13 Azure Security Center connector page Under the Configuration section, next to the subscription that has the Azure Security Center standard tier enabled, click Connect.
The Connection Status will temporarily appear as Connecting, and once it is finished, it will appear as Connected.
After confirming that it is connected, close the Azure Security Center page, and on the Data Connectors page, click Refresh; you will see that the Azure Security Center connector status appears as Connected, as shown in Figure 2-14.
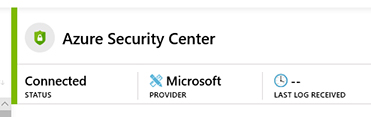
FIGURE 2-14 Azure Security Center connector fully connected Click the Overview option in the left pane to return to the main dashboard.
Tip
If you want to generate some alerts in Azure Security Center, you can use the set of instructions available in the Security Center playbooks at http://aka.ms/ascplaybooks.
Connecting to Azure Active Directory
Azure Active Directory (Azure AD) is the identity and access-management service in the cloud. Each Azure tenant has a dedicated and trusted Azure AD directory. The Azure AD directory includes the tenant's users, groups, and apps, and it is used to perform identity and access-management functions for tenant resources. If you want to export sign-in data from Active Directory to Azure Sentinel, you must have an Azure AD P1 or P2 license.
To connect Azure Sentinel with Azure AD, follow these steps:
Open Azure Portal and sign in with a user who has global administrator or security administrator permissions. You also need to have read permission to access Azure AD diagnostic logs if you want to see connection status.
Choose the All services option, type Sentinel in the search box, and click Azure Sentinel, as shown in Figure 2-15.

FIGURE 2-15 Accessing Azure Sentinel in Azure Portal Click the workspace that was created in the “Enabling Azure Sentinel” section, earlier in this chapter.
When the Azure Sentinel dashboard opens, click Data Connectors under Configuration in the left navigation pane.
Click Azure Active Directory, and a new pane appears on the right side, as shown in Figure 2-16.
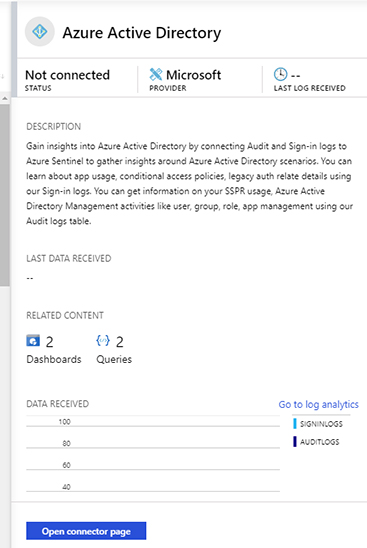
FIGURE 2-16 Azure Active Directory connector Click Open Connector Page button, and the full Azure Active Directory connector page appears, as shown in Figure 2-17.
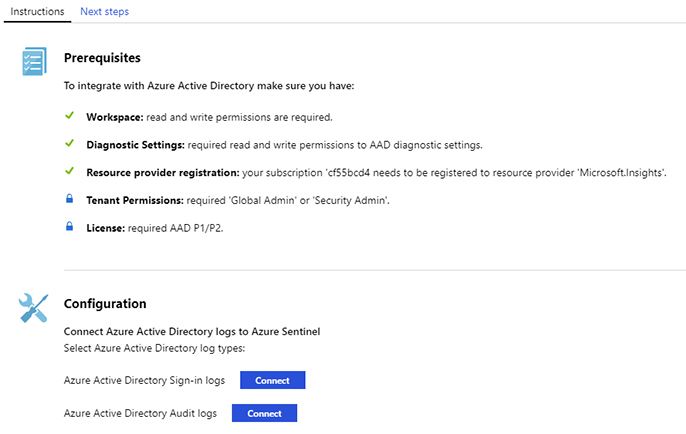
FIGURE 2-17 Azure Active Directory connector page In the Configuration section, you have the option to connect to Azure AD sign-in logs and audit logs. Ideally, you should connect with both because it provides a broader visibility of your identity related activities. For this example, click both Connect buttons.
Once you finish connecting, both buttons will change to Disconnect.
Close this page and click the Overview option in the left pane to return to the main dashboard.
Connecting to Azure Active Directory Identity Protection
Azure Active Directory Identity Protection helps to protect your organization's identities by enabling you to configure risk-based policies that automatically respond to detected issues when a specified risk level has been reached. To perform the integration of Azure Active Directory Identity Protection with Azure Sentinel, you must have an Azure Active Directory Premium P1 or P2 license.
To connect Azure Sentinel with Azure Active Directory Identity Protection, follow these steps:
Open Azure Portal and sign in with a user who has global administrator or security administrator permissions.
In the All services text box, type Sentinel, and click Azure Sentinel when it appears as the lower right, as shown in Figure 2-18.

FIGURE 2-18 Accessing Azure Sentinel in Azure Portal Click the workspace that was created in the “Enabling Azure Sentinel” section, earlier in this chapter.
When the Azure Sentinel dashboard opens, click Data Connectors under Configuration in the left navigation pane.
Click Azure Active Directory Identity Protection, and a new pane appears on the right side, as shown in Figure 2-19.
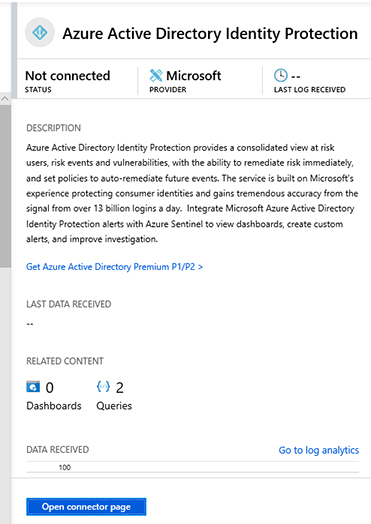
FIGURE 2-19 Azure Active Directory Identity Protection connector Click the Open Connector Page button and the full Azure Active Directory Identity Protection connector page appears, as shown in Figure 2-20.
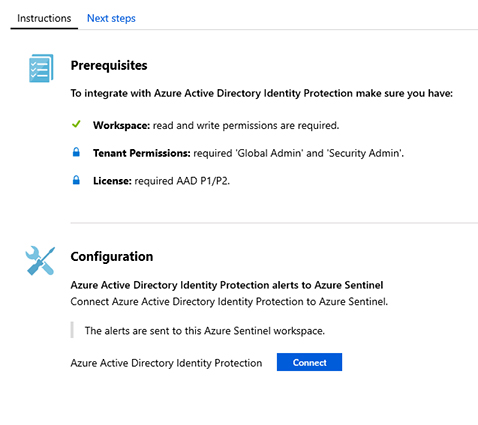
FIGURE 2-20 Azure Active Directory Identity Protection connector Under Configuration, click the Connect button.
Once you finish connecting, the button will change to Disconnect.
Close this page and click the Overview option in the left pane to return to the main dashboard.
There are many more connectors for other Microsoft Solutions, and most of them follow the same flow as the solutions explained so far. The only thing you need to be aware of are the prerequisites for each solution. Make sure to visit the product’s webpage to better understand what permissions are necessary to connect to the target data set. In Chapter 9, “Integrating with partners,” you will learn how to connect with some partners’ solutions.
Accessing ingested data
After connecting with the data sources that you need, you can start validating the connection flow to ensure the data is being saved in the workspace. To perform this validation, you need to access the workspace from Azure Sentinel and perform some queries using Kusto Query Language (KQL).
A Kusto query is a read-only request to process data and return results. The request is stated in plain text, using a data-flow model designed to make the syntax easy to read, author, and automate. The query uses schema entities that are organized in a hierarchy similar to SQL's databases, tables, and columns.
Follow these steps to access the workspace from Azure Sentinel and perform the validation for Azure Activity Log, which was the first data source that you connected in this chapter:
Open Azure Portal and sign in with a user who has contributor privileges for the workspace in which Azure Sentinel will be enabled as well as contributor privileges for the resource group.
Select the All services option, type Sentinel, and click Azure Sentinel, as shown in Figure 2-21.

FIGURE 2-21 Accessing Azure Sentinel in Azure Portal Click in the workspace that was created in the “Enabling Azure Sentinel” section, earlier in this chapter, and the Azure Sentinel main dashboard appears.
Under General, click Logs.
On the Logs page, type AzureActivity and click the Run button. You should see all activities that were performed and collected in the last 24 hours (which is the default timeframe). The result should look similar to Figure 2-22.
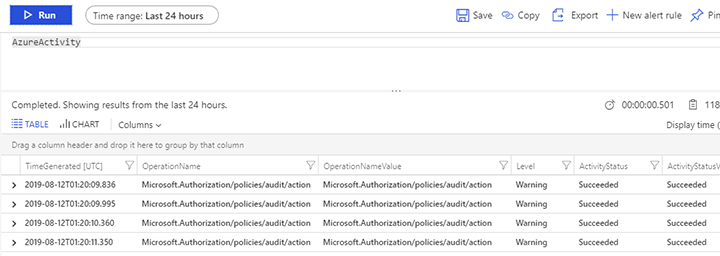
FIGURE 2-22 Azure Sentinel workspace results
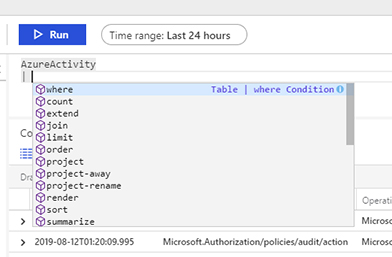
As you can see, the logs are flowing, and you can obtain all results with a single query. However, in a real scenario, you want to narrow the results. An easy way to learn KQL while performing queries is to leverage the context-sensitive IntelliSense capability. To do that, write the query and IntelliSense will open a drop-down menu showing the available options, as shown in Figure 2-23.
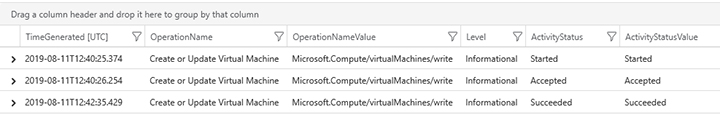
To narrow the search to look only for activities that are related to VM creation (which was the task you did in the beginning of this chapter), type the query below and click Run.
AzureActivity
| where OperationName contains "Create or Update Virtual Machine"
The results should be similar to Figure 2-24, unless you have done other activities where the operation name refers to the VM creation or an update to the VM.
To validate the other data sources that were ingested in this chapter, you can use the following sample queries:
Azure Active Directory
Query: SigninLogs
Use this query to visualize all Azure AD sign-in logs.
Query: AuditLogs
Use this query to visualize all Azure AD audit logs.
Azure Active Directory Identity Protection
Query: SecurityAlert | where ProviderName == "IPC"
Azure AD Identity Protection alerts are located under the SecurityAlert table, and the way to identity alerts coming from this provider is by using the keyword “IPC” on the ProviderName field. This query will list all alerts generated by Azure AD Identity Protection.
Azure Security Center
Query: SecurityAlert | where AlertName contains "suspicious"
This query will list all alerts generated by Security Center where the alert name contains the keyword “suspicious”.