| 6 | SoundScan and the Music Business |
Technology and the music business
Technological advancements not only launched the music business, but have continually given it a “shot in the arm” just when it needed it most. From stereo—to recordable tape—to compact discs—to digital files, technology continues to evolve the hardware and software of our industry. Not only has technology changed the format of our business, but technology has changed how the actual business gets done. Technological advancements permeate the core of the record industry, creating the scorecards for success.
Prior to the current charting system, an archaic reporting system based on undocumented sales information was garnered by Billboard to produce the sales charts. Billboard had a panel of “reporting” retail stores that stated the best-selling record in their store, based on genre. Often times, this information was not verified through actual sales data, but was based on what individuals “thought” to be the best seller. Record labels employed retail promotion teams to help influence these reports; hence, the sales charts were not always valid depictions of true sales throughout the nation.
One must remember that this reporting structure was prior to the use of bar code scanning systems and the use of point-of-sales data. So capturing accurate sales data was difficult, even for the retailer. The use of bar codes, or Universal Product Codes (UPC), has greatly affected product management. Not only do UPC bar codes assist in inventory status and reorder generation of hot-selling items, the sales information captured allows the retailer to determine the best-selling item by store and by chain, as confirmed through real sales data.
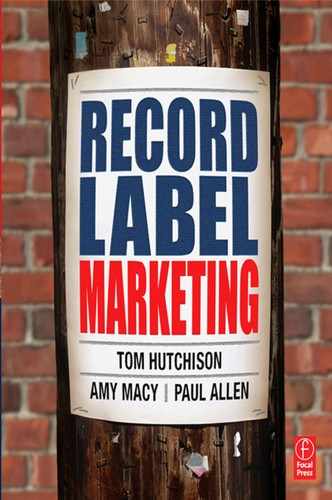
![]() Figure 6.1 Other SoundScan products (Source: Nielsen SoundScan)
Figure 6.1 Other SoundScan products (Source: Nielsen SoundScan)
With the introduction of bar codes and efficient computer management of inventory, a new idea was introduced. Mike Shalett, an ex-record label promotion guy, along with Mike Fine, a statistician who had previously worked with major newspapers and magazines with a focus on surveys, conceived a revolutionary concept that would use this new-found technology to derive the top-selling records of the week. And in 1991, SoundScan was born. The two partners held the company privately until 1998 when they sold a majority share of SoundScan, and sister company VideoScan, to VNU, a company based in the Netherlands that also owned Billboard Publications (BPI), Broadcast Data Systems (BDS) and A.C. Nielsen. This merger formed a nice framework that would allow VNU-owned companies to build new product lines by merging and overlaying airplay, demographic, lifestyle, movie and TV viewing data. This would allow decision makers at labels to see “the big picture” and create more effective marketing strategies.
SoundScan is an information system that tracks sales of music and music video products throughout the United States and Canada. Sales data using UPC bar codes from point-of-sale cash registers is collected weekly from over 19,000 retail, mass merchant and nontraditional (online stores, venues, and so on) outlets. Weekly data is compiled and made available every Wednesday. Now branded with the Nielsen name, SoundScan is the sales source for the Billboard music charts, major newspaper, magazine, TV, MTV and VH1 charts.Although 19,000 retail outlets sounds like a lot of stores, SoundScan does not capture all music retailers. Through analysis, SoundScan knows which retailers it does not capture, and via statistical equations, is able to derive a fairly accurate sales estimate. The record that sells the most earns the #1 position for the week.
The UPC bar code and registration with SoundScan
The UPC bar code contains a unique sequence of numbers that identifies a product. For music, record companies are designated a 5- to 6-digit number that identifies the label, via the Uniform Code Council. The record company then assigns a 4- to 5-digit product code that identifies the release including artist and title of the album. The eleventh digit designated the configuration of the product. The number “2” designates a CD, “1” is vinyl, and “4” is cassette, and so on. The last digit is known as the “check” digit. When scanned, a mathematical equation occurs, which determines if the product has been correctly scanned. The “check” digit is the “answer” to that equation, verifying an accurate scan. In the U.S., the standard UPC bar code contains 12 digits. For digital tracks, downloadable via the Internet, an International Standard Recording Code (ISRC) is required.
To learn more about UPC bar codes and the Uniform Code Council, contact:
Uniform Code Council, Inc.
7887 Washington Village Drive, Suite 300
Dayton, OH 45459
937-435-3870
937-435-7317
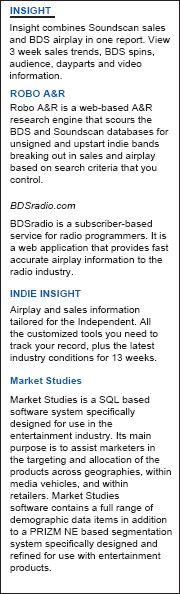
Once a product has a UPC bar code or ISRC code, the release can be registered with SoundScan so that sales or tracks can be captured on a nationwide basis. To register, the following form along with a copy of the release should be sent to SoundScan.
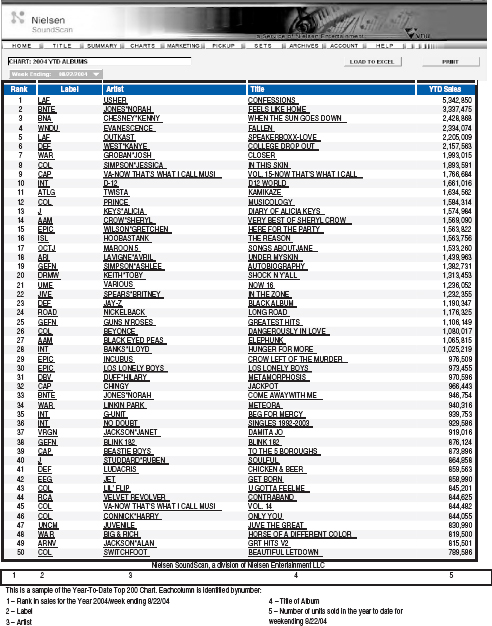
By compiling and organizing sales data, SoundScan derives many charts that help analyze the marketplace. Let’s look at a sample of these charts—know that there are hundreds of charts, subdivided by specific headings. The charts are the actual sales charts that drive the Billboard charts.
![]() Figure 6.2 SoundScan title addition form (Source: Nielsen SoundScan)
Figure 6.2 SoundScan title addition form (Source: Nielsen SoundScan)
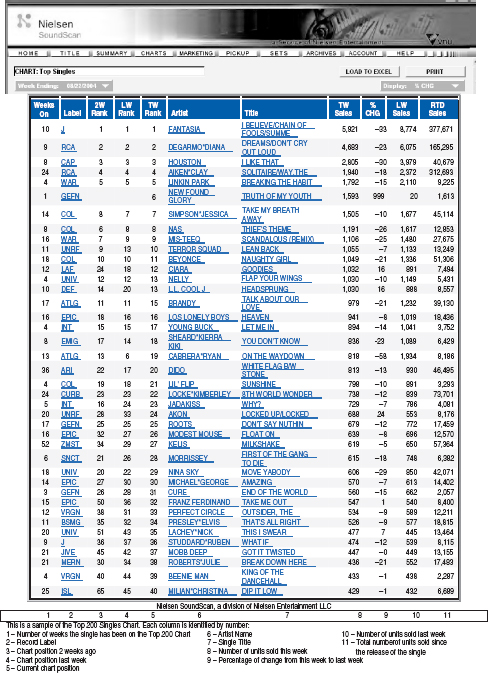
The Hot 100 Singles chart is a combination of single sales and radio airplay, as calculated by Billboard. On this chart, the ratio average of single sales is less than 1%, due to the lack of physical production of singles by the labels. A new version of the Hot 100 Singles chart is being introduced in 2005, using download sales as part of the chart equation, with test charts reporting 60% airplay/40% single sales.i
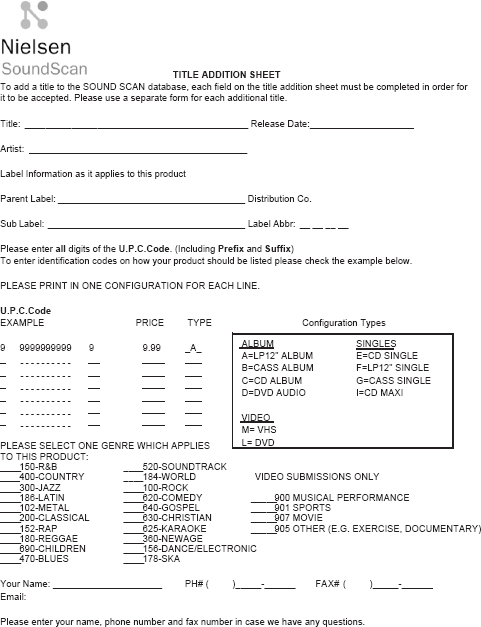
![]() Figure 6.3 Example of a Top Current Album chart (Source: Nielsen SoundScan)
Figure 6.3 Example of a Top Current Album chart (Source: Nielsen SoundScan)
![]() Figure 6.4 Example of a Year-To-Date Album chart (Source: Nielsen SoundScan)
Figure 6.4 Example of a Year-To-Date Album chart (Source: Nielsen SoundScan)
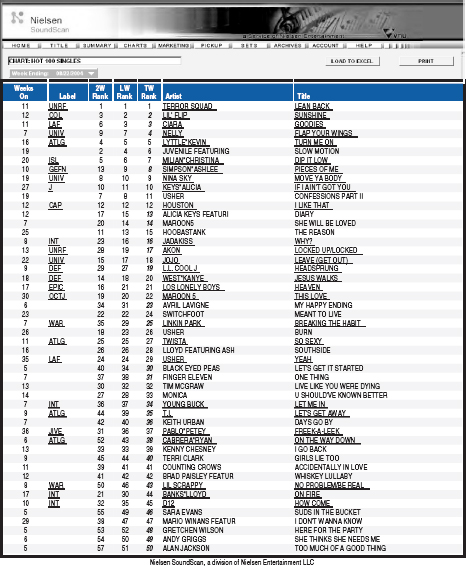
![]() Figure 6.5 Example of a Top Singles chart (Source: Nielsen SoundScan)
Figure 6.5 Example of a Top Singles chart (Source: Nielsen SoundScan)
![]() Figure 6.6 Example of a Hot 100 Singles chart (Source: Nielsen SoundScan)
Figure 6.6 Example of a Hot 100 Singles chart (Source: Nielsen SoundScan)
The Hot 100 Singles chart is not genre specific, but attempts to create a chart based on a combination of popularity votes, both airplay and actual sales.
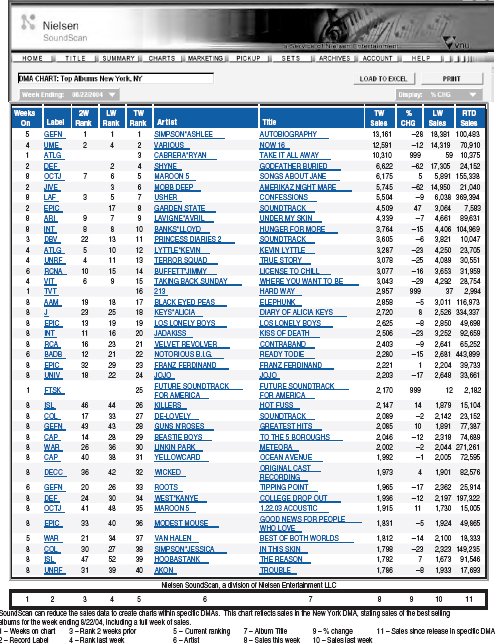
![]() Figure 6.7 Example DMA chart (Source: Nielsen SoundScan)
Figure 6.7 Example DMA chart (Source: Nielsen SoundScan)
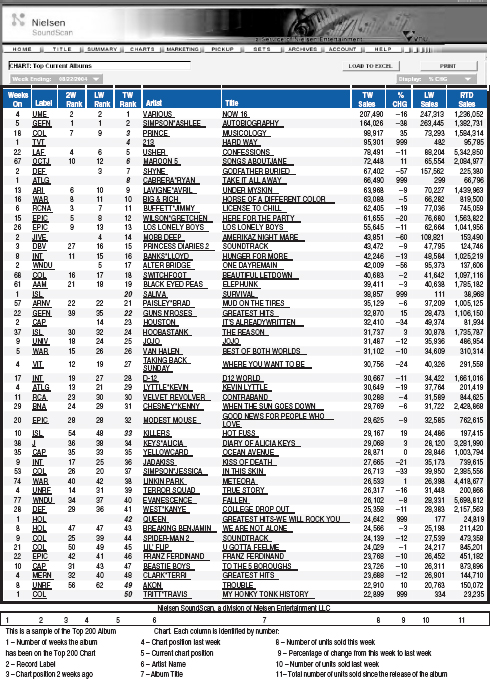
Archives – SoundScan archives the previous year’s sales data, dating back to 1994. This Top Current Album chart is the top current albums for the current week of 12/28/2003.
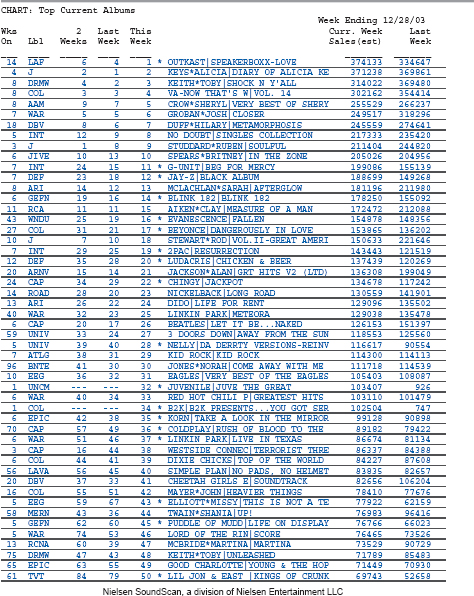
![]() Figure 6.8 Example archives chart: Top Current Albums (Source: Nielsen SoundScan)
Figure 6.8 Example archives chart: Top Current Albums (Source: Nielsen SoundScan)
SoundScan creates various marketing charts that analyze the marketplace by segmenting sales into many categories.
When reading the YTD – Sales by Format Genre Album report, add (000) to the end of the units to accurately depict album sales by genre. Note that the CD format dominates album sales. Additionally, certain releases can be counted twice since they may be considered in more than one genre.
What are not calculated in this report are the genre percentages as they relate to the total. This information is in a different SoundScan report.
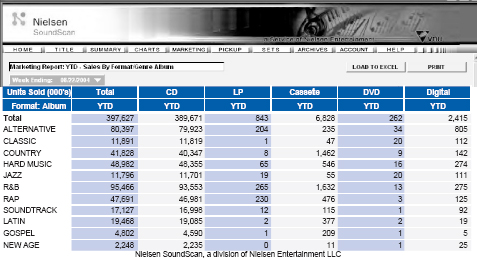
![]() Figure 6.9 Example marketing report: YTD – Sales by Format/Genre Album (Source: Nielsen SoundScan)
Figure 6.9 Example marketing report: YTD – Sales by Format/Genre Album (Source: Nielsen SoundScan)
The Label Share Marketing Report shows the percentage of business by distribution companies, as well as indies for the week ending 8/22/05. Each distributor, shown as Level 1, has “owned” labels that are part of the conglomerate, and “distributed” labels that have contracted the distributor to place their records into the marketplace, which are noted as Level 2. Label groups have sub-labels that are noted as Level 3. Each label is part of the cumulative percentage.
From a competitive standpoint, this data allows distributors and their labels to evaluate their performance as it compares to others. This data is compiled weekly, monthly, and year-to-date.
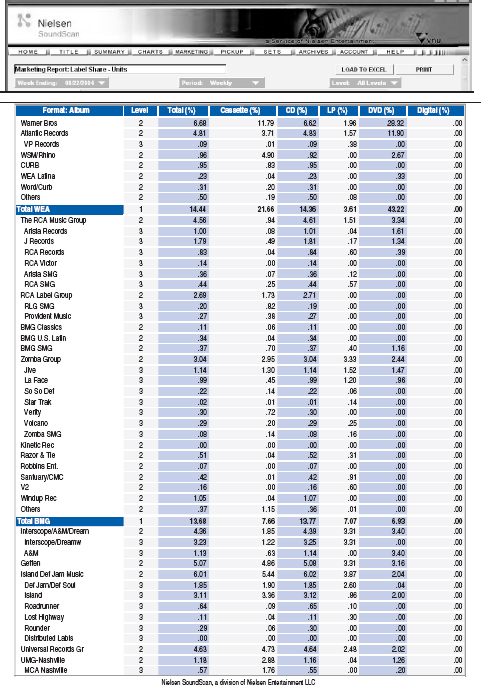
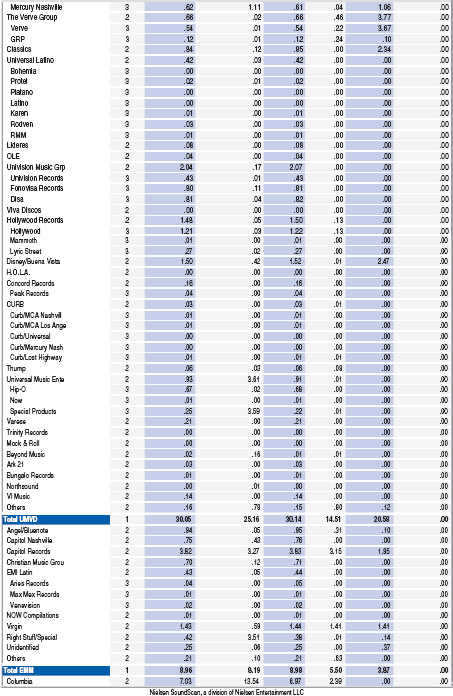

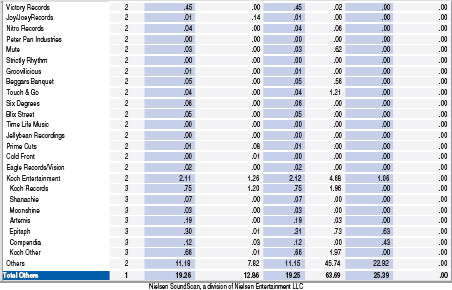
![]() Figure 6.10 Example marketing report: label share – units (Source: Nielsen SoundScan)
Figure 6.10 Example marketing report: label share – units (Source: Nielsen SoundScan)
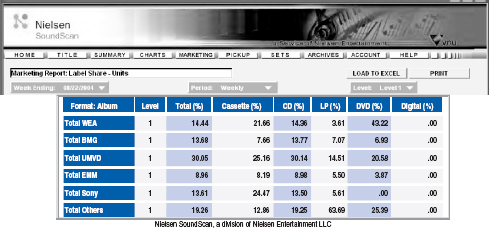
![]() Figure 6.11 Example marketing report: market share summary (Source: Nielsen SoundScan)
Figure 6.11 Example marketing report: market share summary (Source: Nielsen SoundScan)
Marketing Report: YTD Percent Sales by DMA/Genre
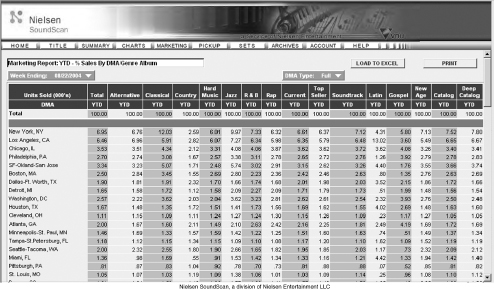
The YTD Percentage of Sales by DMA/Genre calculates the percentage of music sold in a specific DMA by genre. DMA stands for dominant market area with the regions being derived by Nielsen, the company that calculates television ratings.
Example: New York DMA purchased 6.95% of all records sold. For every 100 records sold, nearly 7 are purchased in the New York DMA.
Additionally, New York DMA purchased 12.03% of all classical records sold, making New York a ripe market for classical music. Again, for every 100 classical records sold, over 12 records are purchased in the New York DMA.
This report helps marketers to look at DMAs as a whole. Labels can compare the percentage of their artists’ sales to that of the overall market, seeing if an artist’s sales have over or under performed.
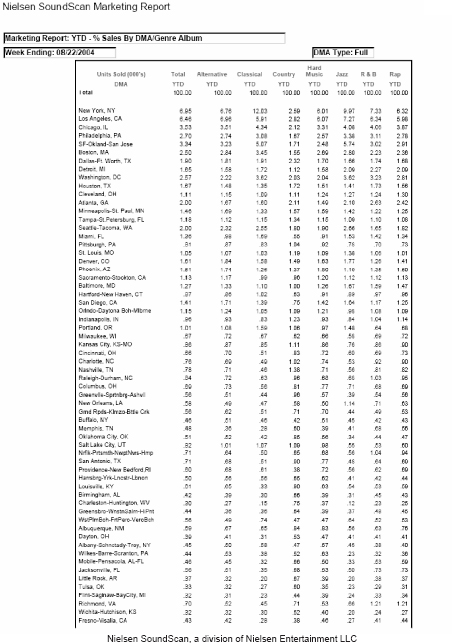
![]() Figure 6.12 Sample marketing report YTD – % sales by DMA/genre album (Source: Nielsen SoundScan)
Figure 6.12 Sample marketing report YTD – % sales by DMA/genre album (Source: Nielsen SoundScan)
The National Sales Summary Report denotes sales by store type, geographic region, and population density. Weekending data is compared to prior week sales, with YTD totals also included. A look from the same week this year to last year helps marketers understand seasonality as well as the impact of special events, such as award shows or national disasters.
Note that chain stores sold the most, with mass merchants not far behind. Chain stores include electronic superstores as well as retail chains.
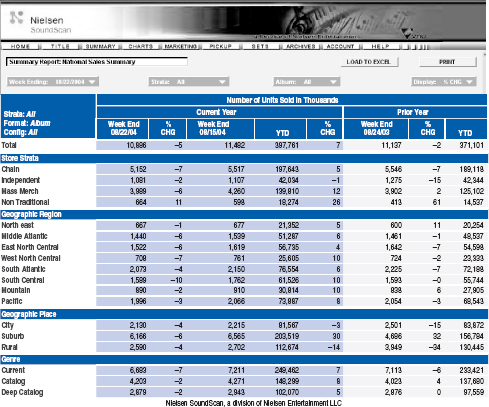
![]() Figure 6.13 Example Summary Report: National Sales Summary (Source: Nielsen SoundScan)
Figure 6.13 Example Summary Report: National Sales Summary (Source: Nielsen SoundScan)
Although cities have higher population density per square mile, rural areas out-purchase the city geographic marketplace, with the suburbs being the largest subsection of music purchasers.
A look at SoundScan title reports
In the current interface, SoundScan has created comprehensive look-up charts for individual artists. After requesting a specific artist, using last name first (for example, Jones*Norah), all releases for this artist will be listed, with release-to-date (RTD) sales included. Each title has a drop-down menu where the researcher can look at specific Title reports.
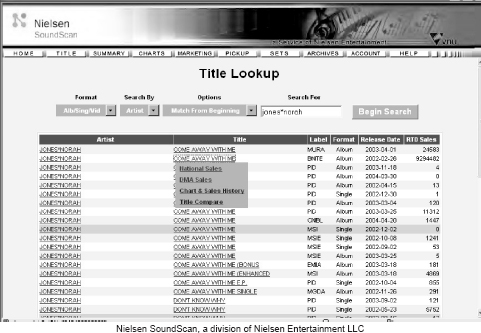
![]() Figure 6.14 Title lookup (Source: Nielsen SoundScan)
Figure 6.14 Title lookup (Source: Nielsen SoundScan)
Reports are generated that are similar to national marketing reports. Norah Jones’ “Come Away with Me” is a huge sales success, with 9 million units sold. The kind of store and geographical regions are reflected in the National Sales Title report.
Chain stores, including electronic superstores, outsell the mass merchants, but not by much. Nationally, independents comprise nearly 11% of sales, but in Jones’ case, independents sell only 5.7%, with these leftover sales being picked up by mass merchants. And by doing some fast math, percentage of business can be calculated by dividing independent sales by total sales (see overlay chart, which was calculated separately, but not supplied by SoundScan). Doing the math, a percentage of sales to the total by store strata, geographic region, and geographic place reveals how this record performs against the national averages.
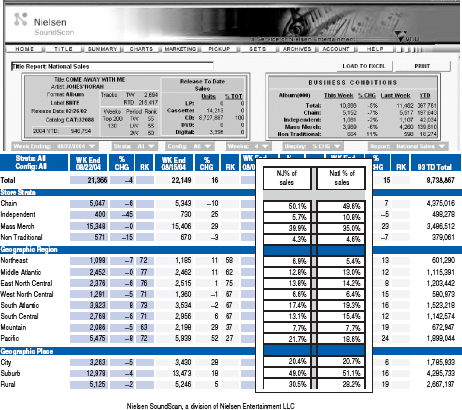
![]() Figure 6.15 Example Title Report: National Sales (comparison of NJ to national calculated separately) (Source: Nielsen SoundScan)
Figure 6.15 Example Title Report: National Sales (comparison of NJ to national calculated separately) (Source: Nielsen SoundScan)
DMA Title Reports shows sales by dominant marketing area. Again, doing some fast math, marketers can analyze the data to show what markets are the best performing, based on population, based on overall sales of the market, based on genre specific sales, and so forth. Marketers, who include label personnel, managers, booking agents, as well as advertisers, look to this type of analysis to create a blueprint—a map of to where to market, tour, create promotions, and so on. The desired result would be increased record sales, but could enhance the artist’s profile with increased ticket sales and bigger product endorsements.
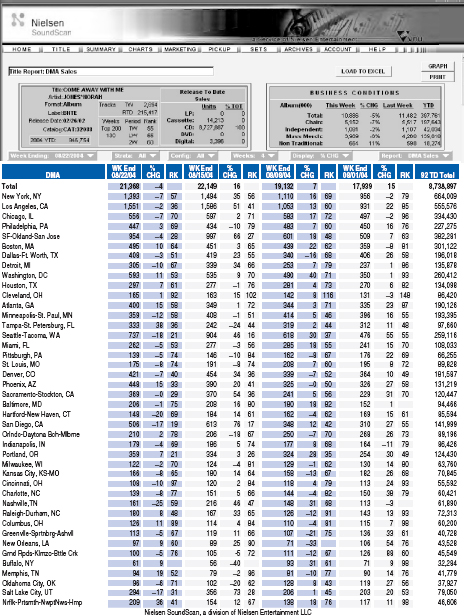
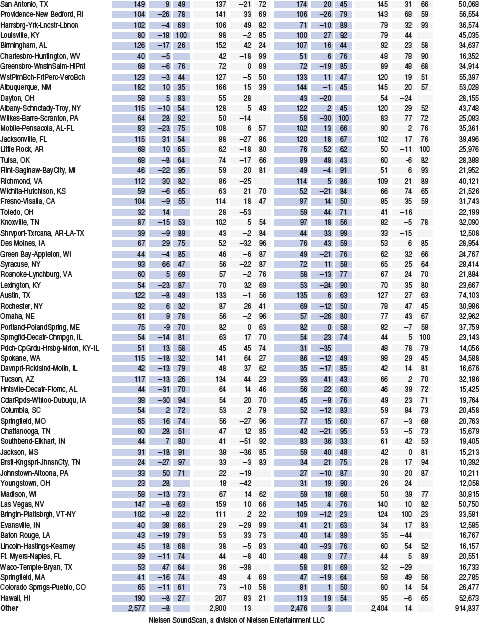
![]() Figure 6.16 Example title report: DMA sales (Source: Nielsen SoundScan)
Figure 6.16 Example title report: DMA sales (Source: Nielsen SoundScan)
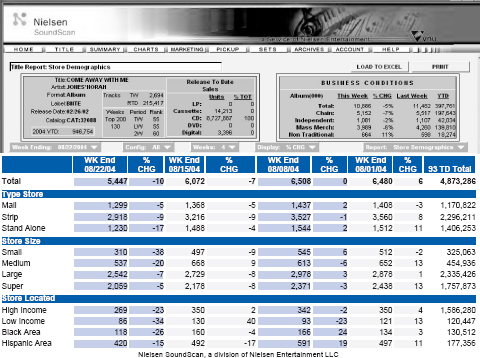
![]() Figure 6.17 Example title report: store demographics (Source: Nielsen SoundScan)
Figure 6.17 Example title report: store demographics (Source: Nielsen SoundScan)
Again, a similar look to the national Store Demo report, an artist’s report will show where records are being purchased. Importantly, label marketers could funnel marketing dollars into the most active stores to increase sales—or coop advertising dollars might be supplied to stores that are lagging behind in sales, with the hope of boosting their percentages.
The Index report reveals how well an artist is performing in a specific DMA. To read this report, SoundScan statistically evaluates each DMA by genre and gives the DMA a par score of 100, meaning that the genre sales average index score in that specific market equals 100. If an artist index number is over 100, the artist is over-performing in that DMA. If the index is under 100, the artist is under-performing in the market.
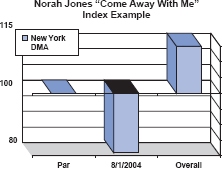
![]() Figure 6.18 Example of indexing
Figure 6.18 Example of indexing

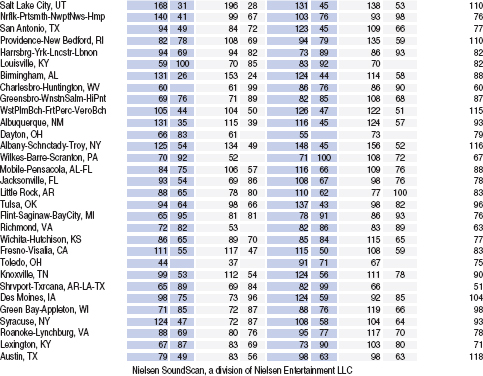
![]() Figure 6.19 Example title report: DMA index (Source: Nielsen SoundScan)
Figure 6.19 Example title report: DMA index (Source: Nielsen SoundScan)
The index number “week ending 8/1/04” in New York is 81, showing that sales under performed, but the overall index for the record since its release in New York is 115, making it a strong market overall for Jones’ “Come Away with Me.” By re-sorting any column in descending order, you can obtain a list of top markets weekly, or release-to-date.
The Artist History report is a great overview for every artist, listing all releases with pertinent information such as label, release date, and weekly and overall sales. When online, most reports are hyperlinked, so that the viewer can instantly connect to the detail of the data. This report will allow a label to look at the trend of an artist’s career.
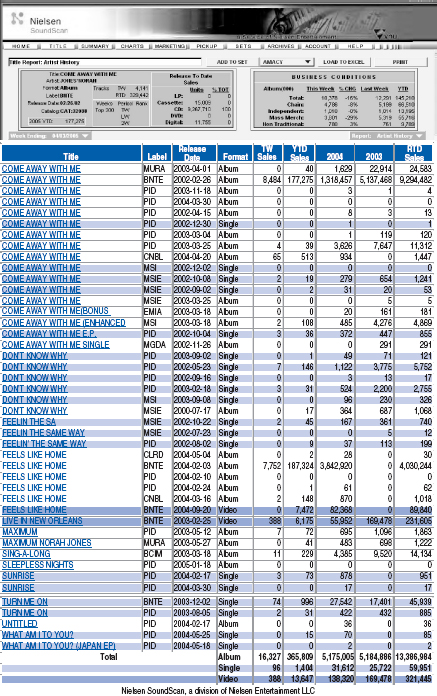
![]() Figure 6.20 Title report: artist history (Source: Nielsen SoundScan)
Figure 6.20 Title report: artist history (Source: Nielsen SoundScan)
The Chart History Report documents sales from the first week of release to current day. Each week, sales along with ranking of title on the Top 200 chart is included. Additional information such as ranking at retail, mass merchants, as well as the specific genre is also included. This data drives the life cycle sales earlier discussed in this text.
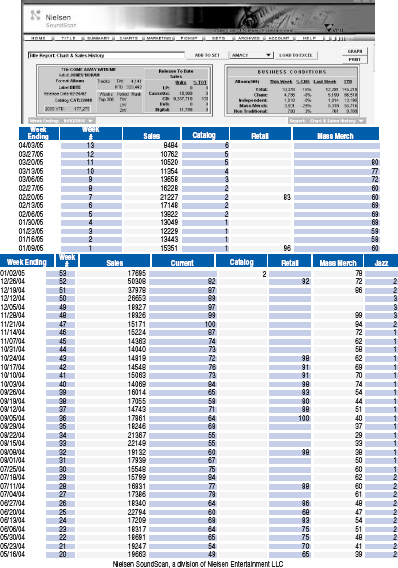
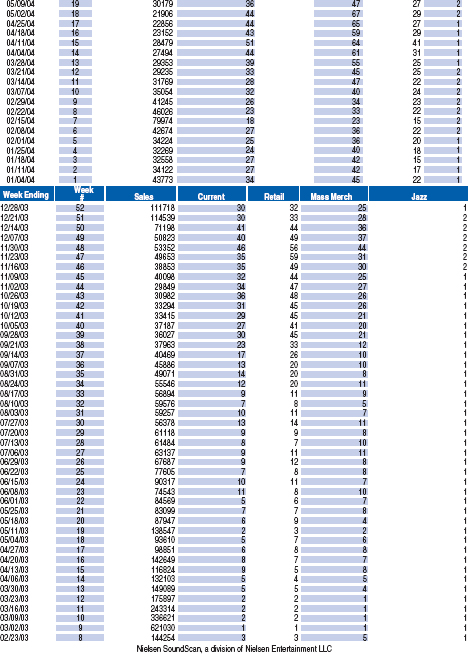
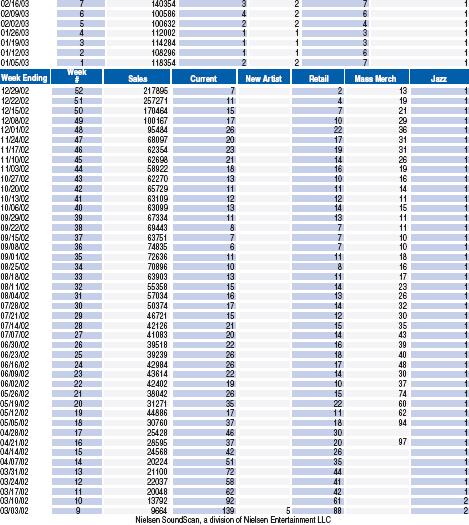
![]() Figure 6.21 Example title report: chart and sales history (Source: Nielsen SoundScan)
Figure 6.21 Example title report: chart and sales history (Source: Nielsen SoundScan)
SoundScan data gives both summaries as well as in-depth analysis as to overall sales of music, a particular genre of music, a particular artist, a particular market, and many more aspects of the business as it pertains to sales of music. By manipulating SoundScan beyond the scope of their predetermined charts, marketers can better understand the marketplace and its drivers.
Like most products, there is seasonality to the sales of music. Every year, sales trends show a similar pattern with sales spikes on Valentine’s Day, Easter, a lull through summer months, and then a steady rise through the fall going into the holiday selling season. Using the weekly sales charts of total album sales, this overlay of years of weekly sales crystallized seasonal sales trends.
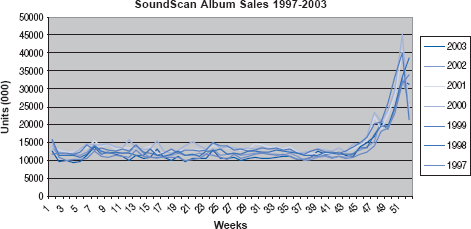
![]() Figure 6.22 SoundScan Weekly Album Sales 1997–2003
Figure 6.22 SoundScan Weekly Album Sales 1997–2003
As students of the business, record company executives analyze when the best time of year would be to release new artist verses that of a platinum act. Strictly based on seasonality alone, most would say to release a new act shortly after the New Year to take advantage of the spring sales spikes and summer touring. And if the act has radio success, the fall selling season would be healthy for the current release already in the marketplace. As for the superstar act, a fourth-quarter release would be perfect timing to capitalize on shoppers, while minimizing long-term advertising dollars. Seasonality is a major factor, but not the only factor; touring and the product life cycle of the artist also play a role.
Business climate and predictor
With some analysis of the numbers, SoundScan can tell a story or paint a picture as to the current business climate. Looking at sales figures of the genre charts before, during, and after 9/11 (2001), industry watchers could predict that the year-end sales figures would not be positive. This chart reflects the percentage of sales change by specific genre, by week. Up until 9/11, the year looked up. But once the tragedies took place, one could watch the trends evolve with the spike in sales in both the country and contemporary Christian genres. The year ended on a down note for the industry as a whole, but country was up, though minimally, and contemporary Christian gained 13.5% in sales for the year.
To determine Percentage of Change, the equation:
This Period (sales) — Last Period (sales) / Last Period (sales) = Percentage of Change
Example:
![]()
This chart takes weekly sales by genre and applies the previous equation, deriving percentage of change in sales, by week.
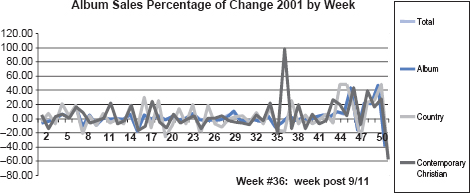
![]() Figure 6.23 Album sales percentage of change in 2001 by week (Source: Nielsen SoundScan)
Figure 6.23 Album sales percentage of change in 2001 by week (Source: Nielsen SoundScan)
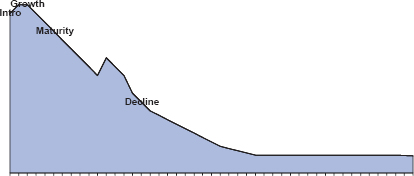
As discussed earlier in this text, there are four stages within the traditional product life cycle: introduction, growth, maturity, and decline. As a product is adopted into use, and as others learn of its availability, its sales will grow. Eventually, the product will hit maturity, level off in sales, and decline. Either its maker will “reinvent” the product as “new and improved” and evolve it in some manner, or it will no longer exist.

![]() Figure 6.24 Classic product life cycle
Figure 6.24 Classic product life cycle
Product life cycles occur in music too. Although there is an occasional exception to the rule such as a second or third single from a release being the song that drives sales, most releases have a similar sales pattern. Once an artist is established, sales patterns rarely vary, which is why the first few months of a release are so critical to the success of a record. In many cases, the sales success of a release is dependent on how many units are shipped initially into retail. And how many units are shipped is usually dependent on the pent-up demand felt from the marketplace including radio airplay, publicity, touring, press, and other marketing events. Recognize that retailers buying music also look at the track record of the artist and their previous sales as well.
Looking at these examples, most of the releases show a similar pattern in sales. Note that they are different artists, genres, sales plateaus, time of year, and yet the similarity in sales trend is unmistakable. An established artists’ sales trend shows an undeniable peak in sales early in the life cycle that tapers off within the first 6 weeks and 3 months, which is why most record labels pack their marketing strategies into this small window of time.
![]() Figure 6.25 Product life cycle for new releases
Figure 6.25 Product life cycle for new releases
The exceptions to the rule are the artists that are “breaking.” Check out the first record of these now superstar acts. Most of their initial releases had a “slow boil” effect, meaning that sales did not catch on at a street date, but later, as consumers became knowledgeable about the artist.
For example, Norah Jones’ debut album, “Come Away With Me,” is a perfect example of a “slow boil.” The single, “Don’t Know Why,” was released in summer 2002 on the AC, Adult Top 40, Hot 100, and Top 40 mainstream charts, and did not peak until Jan/Feb 2003. The album sales chart shows that over-the-counter activity began to pick up during this time frame, with a peak in sales in early 2003 as consumers sought out this new artist’s release.
Note that Jones’ sophomore album, “Feels Like Home,” reflects the classic established artist’s sales trend, with the bulk of sales occurring early in the release. Blue Note, Jones’ record label, released this album one week prior to Valentine’s Day 2004, and capitalized on seasonality of sales as it relates to their artist.

![]() Figure 6.26 Comparison of sales patterns for Norah Jones’ first and second releases (Source: Nielsen SoundScan)
Figure 6.26 Comparison of sales patterns for Norah Jones’ first and second releases (Source: Nielsen SoundScan)
Released in 2001, “Room for Squares” was John Mayer’s “official” first album release. The hit single, “No Such Thing” peaked at radio, depending on the format, in mid–2002, with the bigger hit, “Your Body Is A Wonderland,” driving sales even higher. Note the “slow boil” affect with the first release.
“Any Given Thursday” is a live album release that was to bridge sales demand while Mayer recorded the next album. Although a classic “established” artist sales profile occurs, the actual volume was much lower than that of Mayer’s initial release. “Heavier Things” continued the sales trend of an established act, though showing a quick die-off in sales, mostly because of the lack of a big single on radio.

![]() Figure 6.27 Sales patterns for John Mayer releases (Source: Nielsen SoundScan)
Figure 6.27 Sales patterns for John Mayer releases (Source: Nielsen SoundScan)
The designated market area (DMA) is A.C. Nielsen’s geographic market design, which defines each television market. DMAs are composed of counties (and possibly also split counties), and are updated annually by the A.C. Nielsen Company based on historical television viewing patterns. Every county or split county in the United States is assigned exclusively to one DMA.
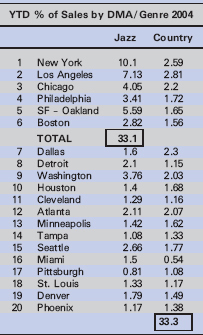
Table 6.1 Comparison of number of DMAs needed to get 33 percent of the market for Jazz and Country genres (Source: Nielsen SoundScan)
Radio audience estimates for DMAs are published in the Radio Market Reports of all standard radio markets whose metros are located within the DMA and whose names are contained in the DMA name. For example, radio audience estimates for the San Francisco-Oakland-San Jose DMA are reported in both the San Francisco and the San Jose radio market reports; however, radio audience estimates for the New York DMA are reported in the New York report, but not in the Nassau-Suffolk report (Katz Media Group Radio Resource Area).
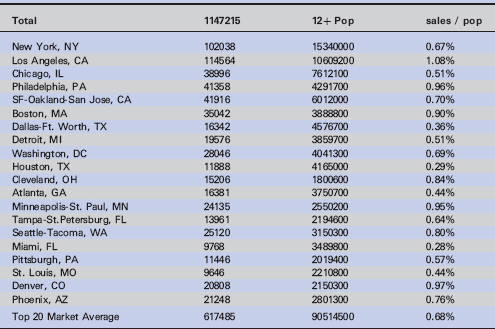
The following data reflects the percentage of music sold in each of the DMAs. SoundScan lists the DMAs in order of population, with New York being the most populated area surveyed, Los Angeles being the second largest populated area surveyed, and so on, with some variances based on radio or television markets. In Radio & Records (R&R), populations are based on 12+ age category, being people that live within the surveyed area that are 12 and over in age. When looking at the markets, record labels should consider efficiency of the advertising dollars and marketing efforts.
Each genre of music contains a unique profile; for example, the percentage of music sold in the top six DMAs for jazz equals 33.1%. Think about it—for every 100 jazz records sold, 33 of them are sold in these top six DMA markets. As a marketing department, advertising in these DMAs should have a big bang for the buck, considering the efficiency of targeting to the buyers in these markets. In contrast, to sell 33 records out of 100 in the country genre, the top twenty DMA markets are needed to achieve that percentage. Instantly, to reach buyers of country music, country record labels need to spread their marketing dollars and efforts thinner, or smarter, to effectively reach the same percentage of buyers of the genre.
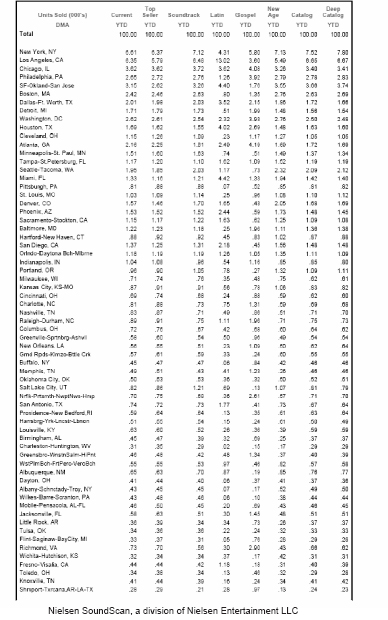
Best-Selling markets vs. strongest markets
![]() Figure 6.28 Marketing report: YTD – % Sales by DMA/Genre album (Source: Nielsen SoundScan)
Figure 6.28 Marketing report: YTD – % Sales by DMA/Genre album (Source: Nielsen SoundScan)
It sounds confusing—why wouldn’t the best selling markets NOT be the strongest markets when looking at genre sales and/or title reports of a specific release? Let’s look at how record companies can manipulate SoundScan data to be smarter marketers.
This data is a new sort of the same numbers. By ranking the DMAs by percentage of sales, marketing experts can now view the best-selling markets in order. (For this book’s example, only the Top 20 markets are being analyzed.) But are these the best markets for jazz sales? To determine the strongest markets, using population data in the equation helps to determine where to place marketing efforts.
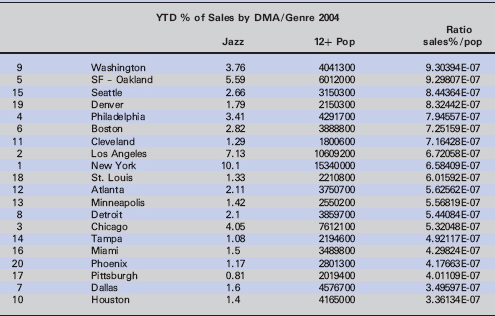
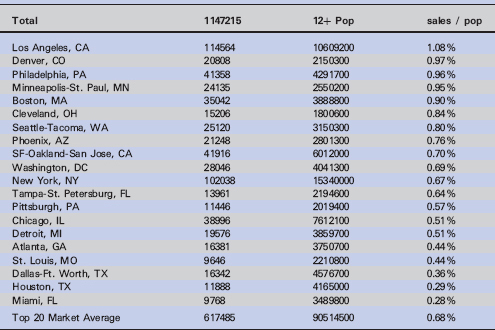
Here is another look at the same data. By adding 12+ population data and doing a simple ratio, the best markets emerge. The 12+ data comes from Radio and Records (R&R) and DMA ratings information. The equation is sales percentage/12+ population.
Where New York and Los Angeles were ranked number one and number two, respectively, the strongest market for jazz based on percentage of sales to the population of the DMA would be Washington D.C., with San Francisco closely behind. Although Washington D.C. does not sell as much jazz as New York, the propensity of the population to buy jazz in the D.C. marketplace is almost 1/3 greater, making it a better or stronger market for jazz music.
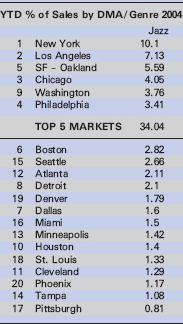
Table 6.3 Ranking of jazz sales markets based on sales per population (Source: Nielsen SoundScan)
Example: Green Day’s American Idiot album
This same type of information can be used with Title Report data. By looking at the sales of an artist’s specific record, labels can determine where to place marketing and dollars.
This example is Green Day’s American Idiot album that was released on 9/21/04. Again, ranked by DMA, then ranked by sales, then ranked by sales/population ratio, look at the variance in market strength.
Table 6.4 Green Day’s American Idiot” album ranked by DMA – cumulative sales as of 12/20/2004 (Source: Nielsen SoundScan)
Check out the table, ranked by sales per population. Based on sales per population, Denver emerges as the number two strongest market for sales of Green Day’s American Idiot album. By concentrating on markets that have a stronger probability of sales, labels can better manage their marketing dollars through succinct activities that may include radio promotions, in-store events, touring, and so on. The goal is to maximize the market and sell records.
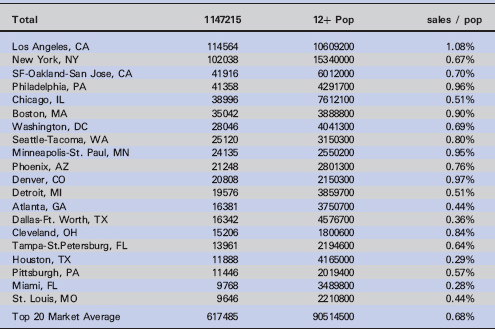
Table 6.6 Green Day’s American Idiot” ranked by sales per population (Source: Nielsen SoundScan)
The valuable information contained within SoundScan can help record labels, artists, managers, booking agents, promoters, and distribution companies create a blueprint that is invaluable in the development and ongoing career building activities. As explored in the previous pages, reams of data can be garnered and parsed. However, SoundScan data alone is not the sole answer. It takes creativity on the parts of all contributors to develop a plan that will point an artist in the direction of success.
Bar code – See Universal Product Code (UPC).
Breaking – Introducing a new artist into the marketplace.
Chain stores – Multiple stores in a variety of geographic areas that are all owned by one company.
Designated marketing area (DMA) – The geographic area surrounding a city in which the broadcasting stations based in that city account for a greater share of the listening or viewing households than do broadcasting stations based in other nearby cities.
Electronic superstores – Stores such as Circuit City and Best Buy that sell a lot of electronic gear, but also carry recorded music product.
Index number – A number assigned to a value that represents where that number lies in relation to the average, usually expressed with 100 representing the average. For example, a product that has an index of 118 sells 18% more than the average.
International Standard Recording Code (ISRC) – A new, advanced version of bar codes that includes a country of origin code.
Mass merchants – Very large retail chains that sell a variety of goods and depend on volume sales. Wal-Mart and Target are examples.
Point-of-sale – Where the sale is entered into registers. Origination of information for tracking sales, etc.
Product life cycle – The course that a product’s sales and profits take over what is referred to as the lifetime of the product.
Slow boil affect – A description for an album whose sales start out slow, but increase astronomically over time.
Uniform Code Council – The regulating body that assigns product codes.
Universal Product Code (UPC) – A standardized bar code used to identify products by laser scanners.
Year-to-date (YTD) – A measure of sales from the beginning of the calendar year until the specified date of the report.
______________________
i Silvio Pietroluongo, Billboard Hot 100 Chart Manager, Interview 1/12/05.