History provides valuable context—if we started with a blank page, investing would be largely guesswork. An evaluation of the present should always and everywhere be grounded in probabilities using the past as context. The preceding chapters provided the relevant structure. But that only gets you halfway. Markets are constantly evolving and changing before our very eyes—no two periods are exactly the same. Investors must interpret the events of yesterday into a relevant framework for today. To begin building an emerging markets portfolio, we need an understanding of its composition today. In this chapter, we deconstruct the current emerging market landscape to gain a better understanding of the areas most important to investors. We then provide a framework for thinking about markets—the top-down method—further detailing the important steps in Chapters 6 and 7.
Investors often say their goal is to beat the "market," but they rarely identify what market they mean. Yet you can't successfully beat a market unless you choose a specific one to beat. Thus, before building any portfolio, investors must choose a benchmark.
A benchmark is your market. It's an index tracking whatever asset class(es) you wish to invest in. As discussed in Chapter 1, there are indexes designed to track every imaginable investment, from US Midwestern real estate values to the probability of default for corporate bonds. Most investors are familiar with indexes as a way to track general market performance, but very few use them as benchmarks. This is misguided, as benchmarks serve several critical functions.
If your portfolio was down 10 percent in one year, did you do well? Most investors would answer a resounding no—no one likes to lose money. But there isn't enough information here to appropriately answer the question. What if we told you the broader market fell 30 percent over the same period? In that environment, a 10 percent decline sounds pretty good. Similarly, if your portfolio rose 10 percent but the broader market was up 30 percent, you aren't likely to be too happy. Too often, investors focus on absolute return. But a better focus is relative return. Rather than maximizing return in the short run, your portfolio management goal should be maximizing the likelihood of beating your benchmark. Beating a properly constructed benchmark consistently over a long period of time by even a modest amount should afford you great investment success.
Most investors think the ultimate goal of managing money is maximizing return. Not so. This is akin to thinking the best way to drive across the country is to keep the gas pedal to the floor the entire time. You might get ahead in the straight-aways, but the first obstacle can quickly send you veering off course. Most rational drivers use a roadmap to plan the quickest and safest route. A benchmark does the same for your investments by guiding your portfolio construction. Its components tell you what to include and in what percentage.
Say your benchmark is the MSCI Emerging Markets Index. Turkey represents 1.5 percent of the total index by market capitalization. Using this weight as a guide, you can either overweight, underweight, or neutral weight Turkey relative to the benchmark. Being overweight means owning more Turkish stocks by weight than the benchmark. An underweight is the exact opposite—owning less than the benchmark. And a neutral weight means your Turkish weight is in line with the benchmark. Generally speaking, investors seek to overweight categories they expect to outperform their benchmark and underweight those they believe will not.
Note that being pessimistic on a country doesn't necessarily mean holding zero weight to that country. Instead, it might only mean holding a lesser percentage than the benchmark. This is an important feature of benchmarking—it allows an investor to make strategic decisions on sectors and countries, but maintains diversification, thus managing risk more appropriately.
Benchmark weights also determine the relative impact a country (or any other benchmark component) has on the overall index's performance. For example, a 2 percent return in China (weight 18.2 percent in the MSCI Emerging Markets Index) matters more to overall performance than a 20 percent return in Turkey, because China is over 12 times the weight in the index.[155]
Last, benchmark weights are not static—they change over time based on each index component's performance. The biggest sector or country today won't necessarily be the biggest next year (again, see technology's bust in the early 2000s). As such, it's crucial to periodically monitor these weights to ensure your portfolio is properly aligned.
As you can see, picking a benchmark is no small consideration— whichever one you choose will have lasting implications on the makeup of your portfolio and how you evaluate your success. By picking up this book, we assume you're already well attuned to the wonders of global investing and need no convincing of its merits (if not, see Aaron Anderson's Own the World). But the goals and objectives of every global investor are different, and emerging markets' role varies along with them. So what benchmark is appropriate for emerging markets investors?
There are essentially two answers to this question, depending on whether you want emerging markets to play a supporting or leading role. If you're adding emerging markets to a pre-existing global, developed market benchmark like the MSCI World Index, you'll want to switch your index to one that includes emerging markets. The MSCI All-Country World Index (ACWI) is an appropriately broad, well-constructed index covering both developed and emerging markets (remember, we reference MSCI in this book, but any number of index providers create suitable indexes; the criteria across providers are essentially the same). However, if you intend to manage emerging markets as a standalone portfolio, you'll want to choose a benchmark consisting only of emerging markets stocks, like the MSCI Emerging Markets Index.
Which one you choose is essentially a question of weight. A global investor benchmarked to the MSCI ACWI will have a substantially smaller allocation to emerging markets than one devoted solely to the asset class. At year-end 2008, emerging markets represented nearly 10 percent of the MSCI ACWI.[156] Obviously, if you benchmarked to the MSCI Emerging Markets Index, your portfolio would consist entirely of emerging market stocks.
This may seem overly straightforward, but there are subtle implications. A global investor should be less concerned with the smaller emerging markets weights. Take our earlier Turkey example. If you're managing a standalone emerging markets portfolio, you might pay some attention to the country given its 1.5 percent weight. Not huge, but not completely insignificant. However, if the MSCI ACWI is your benchmark, Turkey comprises only a tiny fraction—0.2 percent. A weight that small isn't going to have too much of an impact on your overall performance and can largely be ignored. In either case, you've presumably made the decision to invest some money in emerging markets. An evaluation of the asset classes today is thus appropriate for both types of investors.
With your benchmark in hand, it's time to turn to emerging markets. What does the asset class look like today? Investors who follow the major financial publications may believe it starts and ends with Brazil, Russia, India, and China, known as the BRICs. These markets command the bulk of headlines.
But while these countries are undoubtedly important to your portfolio's performance, their reputation is partly successful marketing. Take a guess at the five largest emerging markets by market capitalization. You probably correctly picked China at the top of the list. That's an easy one. But we bet most readers wouldn't guess South Korea, Taiwan, and South Africa come before Russia or India on the scale of relative size. Table 5.1 shows the breakdown weights of the MSCI Emerging Markets Index by country as of December 31, 2008.
Table 5.1. MSCI Emerging Markets Index Country Weights
Country | Weight | Country | Weight |
|---|---|---|---|
Source: Thomson Datastream, MSCI, Inc.[157] as of 12/31/2008. | |||
China | 18.2% | Indonesia | 1.5% |
South Korea | 13.6% | Chile | 1.4% |
Brazil | 12.9% | Thailand | 1.4% |
Taiwan | 10.9% | Czech Republic | 0.9% |
South Africa | 8.4% | Egypt | 0.7% |
India | 6.5% | Peru | 0.7% |
Russia | 5.7% | Colombia | 0.6% |
Mexico | 5.2% | Hungary | 0.6% |
Israel | 3.4% | Morocco | 0.5% |
Malaysia | 3.0% | Philippines | 0.5% |
Poland | 1.6% | Argentina | 0.1% |
Turkey | 1.5% | Pakistan | 0.1% |
From a sector standpoint, the distribution is more evenly spread. Financials is by far the largest, but virtually every sector is substantial enough to warrant some attention (see Table 5.2).
Combining the two categories together—sector and country—we get Table 5.3, which reveals how sector weights vary by country. For example, Telecommunication Services represents nearly 25 percent of China (4.2 percent divided by 18.2 percent), but in Brazil, it's barely 5 percent (0.7 percent divided by 12.9 percent). Also, not every country contains every sector—going fishing in the Philippines for a Materials stock will leave you empty-handed. Given these idiosyncrasies, a brief breakdown of the major regions is appropriate.
Table 5.2. MSCI Emerging Markets Sector Weights
Weight | |
|---|---|
Source: Thomson Datastream, MSCI, Inc.[158] as of 12/31/2008. | |
Financials | 22.8% |
Energy | 14.9% |
Telecommunication Services | 13.6% |
Materials | 12.8% |
Information Technology | 10.8% |
Industrials | 7.7% |
Consumer Staples | 5.8% |
Consumer Discretionary | 4.8% |
Utilities | 4.0% |
Health Care | 2.9% |
Table 5.3. Emerging Market Country-Sector Intersections
Country | Consumer Discretionary | Consumer Staples | Energy | Financials | Health Care | Industrials | Information Technology | Materials | Telecom | Utilities | Total |
|---|---|---|---|---|---|---|---|---|---|---|---|
Source: Thomson Datastream, MSCI, Inc.[159] as of 12/31/2008. | |||||||||||
Argentina | 0.0% | 0.0% | 0.0% | 0.0% | 0.1% | ||||||
Brazil | 0.4% | 0.7% | 3.5% | 2.8% | 0.3% | 0.2% | 3.3% | 0.7% | 1.0% | 12.9% | |
Chile | 0.0% | 0.2% | 0.1% | 0.2% | 0.3% | 0.1% | 0.5% | 1.4% | |||
China | 0.6% | 0.7% | 3.3% | 6.0% | 1.7% | 0.5% | 0.8% | 4.2% | 0.4% | 18.2% | |
Colombia | 0.2% | 0.2% | 0.1% | 0.1% | 0.6% | ||||||
Czech Republic | 0.0% | 0.1% | 0.1% | 0.0% | 0.1% | 0.5% | 0.9% | ||||
Egypt | 0.2% | 0.2% | 0.1% | 0.3% | 0.7% | ||||||
Hungary | 0.2% | 0.2% | 0.1% | 0.1% | 0.6% | ||||||
India | 0.2% | 0.2% | 1.3% | 1.6% | 0.3% | 0.6% | 0.9% | 0.5% | 0.2% | 0.4% | 6.5% |
Indonesia | 0.1% | 0.1% | 0.1% | 0.5% | 0.0% | 0.1% | 0.4% | 0.1% | 1.5% | ||
Israel | 0.0% | 0.3% | 2.2% | 0.1% | 0.3% | 0.3% | 0.2% | 3.4% | |||
Korea | 1.3% | 1.0% | 0.4% | 2.2% | 0.1% | 2.6% | 3.2% | 1.6% | 0.8% | 0.4% | 13.6% |
Malaysia | 0.4% | 0.5% | 0.0% | 0.9% | 0.6% | 0.0% | 0.2% | 0.4% | 3.0% | ||
Mexico | 0.7% | 1.2% | 0.2% | 0.3% | 0.6% | 2.3% | 5.2% | ||||
Morocco | 0.3% | 0.1% | 0.2% | 0.5% | |||||||
Pakistan | 0.0% | 0.0% | 0.0% | 0.0% | 0.1% | ||||||
Peru | 0.2% | 0.5% | 0.7% | ||||||||
Philippines | 0.0% | 0.2% | 0.0% | 0.2% | 0.0% | 0.5% | |||||
Poland | 0.1% | 0.3% | 0.9% | 0.1% | 0.0% | 0.1% | 0.3% | 1.6% | |||
Russia | 0.0% | 0.0% | 3.7% | 0.5% | 0.0% | 0.6% | 0.7% | 0.1% | 5.7% | ||
Source Africa | 0.8% | 0.4% | 1.0% | 2.1% | 0.1% | 0.4% | 2.2% | 1.3% | 8.4% | ||
Taiwan | 0.2% | 0.2% | 0.1% | 1.9% | 0.4% | 5.7% | 1.5% | 0.8% | 10.9% | ||
Thailand | 0.0% | 0.0% | 0.6% | 0.4% | 0.0% | 0.1% | 0.2% | 0.0% | 1.4% | ||
Turkey | 0.0% | 0.1% | 0.1% | 0.8% | 0.1% | 0.1% | 0.3% | 1.5% | |||
Total | 4.8% | 5.8% | 14.9% | 22.8% | 2.9% | 7.7% | 10.8% | 12.8% | 13.6% | 4.0% | 100.0% |
The MSCI Emerging Markets Index comprises three regions: Europe, the Middle East & Africa (EMEA), Latin America, and Asia. At year end 2008, 21 percent of the index was in Latin America, 23 percent in EMEA, and 56 percent in Asia.[160] Each region has a distinct composition.
Emerging Asia is the largest region by market capitalization, consisting of nine countries (in order of weight): China, Korea, Taiwan, India, Malaysia, Indonesia, Thailand, Philippines, and Pakistan. Financials is the largest sector in the region, followed by Information Technology and Telecommunication Services.
Table 5.4. Emerging Asia Sector Weights
Sector | Weight in MSCI EM | Weight in EM Asia |
|---|---|---|
Source: Thomson Datastream, MSCI Inc.[161] as of 12/31/2008. | ||
Financials | 13.8% | 24.8% |
Information Technology | 10.3% | 18.5% |
Telecommunication Services | 7.0% | 12.6% |
Energy | 5.9% | 10.6% |
Industrials | 5.9% | 10.6% |
Materials | 4.6% | 8.3% |
Consumer Staples | 3.1% | 5.5% |
Consumer Discretionary | 2.8% | 5.0% |
Utilities | 1.9% | 3.4% |
Health Care | 0.4% | 0.6% |
Total | 55.7% | 100.0% |
The second largest region, EMEA, also has nine countries (in order of weight): South Africa, Russia, Israel, Poland, Turkey, Czech Republic, Egypt, Hungary, and Morocco. Financials is again the largest sector, but EMEA has virtually no exposure to Information Technology stocks. Instead, it also has a notable weight to Energy (see Table 5.5).
Latin America is the smallest emerging market region, both by number of countries and weight. It consists of (in order of weight): Brazil, Mexico, Chile, Peru, Colombia, and Argentina. Latin America's sector weights are quite different than the other regions. The Materials and Energy sectors account for 40 percent. At the other end of the spectrum, the region has miniscule exposure to Information Technology and none to Health Care (see Table 5.6).
Taking all this together, some initial thoughts on portfolio construction should be forming in your head. If you thought Information Technology will outperform in the period ahead, what region would you look to first? Or what region might you avoid if you expected Materials or Energy stocks to decline? We'll cover this in a bit more detail in ensuing chapters, but it's important to keep these considerations in mind when thinking about your approach.
Table 5.5. Europe, Middle East & Africa Sector Weights
Sector | Weight in MSCI EM | Weight in EM EMEA |
|---|---|---|
Source: Thomson Datastream, MSCI, Inc.8 as of 12/31/2008. | ||
Financials | 5.3% | 22.8% |
Energy | 5.2% | 22.4% |
Telecommunication Services | 3.5% | 14.8% |
Materials | 3.4% | 14.5% |
Health Care | 2.5% | 10.8% |
Industrials | 1.0% | 4.2% |
Consumer Discretionary | 0.9% | 3.9% |
Consumer Staples | 0.6% | 2.6% |
Utilities | 0.6% | 2.5% |
Information Technology | 0.3% | 1.3% |
Total | 23.3% | 100.0% |
Table 5.6. Latin America Sector Weights
Sector | Weight in MSCI EM | Weight in EM LatAm |
|---|---|---|
Source: Thomson Datastream, MSCI, Inc.[163] | ||
Materials | 4.7% | 22.6% |
Energy | 3.7% | 17.7% |
Financials | 3.7% | 17.4% |
Telecommunication Services | 3.1% | 15.0% |
Consumer Staples | 2.1% | 10.1% |
Utilities | 1.5% | 7.3% |
Consumer Discretionary | 1.1% | 5.2% |
Industrials | 0.8% | 4.0% |
Information Technology | 0.2% | 0.8% |
Health Care | 0.0% | 0.0% |
Total | 21.0% | 100.0% |
The preceding overview of the current landscape reveals an important theme: Emerging markets are very concentrated. A few countries dominate the market, and those countries are dominated by a few sectors and a handful of stocks. This concept is consistent with a broader way of thinking about portfolio management, an approach we believe offers investors the best chance for long-term success.
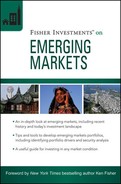
Take a peek at Table 5.1 again. Note its top-heavy structure. There may be 24 countries in the MSCI Emerging Markets Index, but only a handful have any real significance. For example, at less than one-tenth of a percent of the index weight, Argentina matters little to any properly managed portfolio. By contrast, countries like China, Korea, and South Africa are crucial to relative portfolio performance. Figure 5.1 illustrates this concept graphically. The top three countries make up 45 percent of the index. A mere 10 countries—less than half the total—represent nearly 90 percent of the index.[164]
This has broad implications. The vast majority of your time should be spent on a handful or two of countries. There may be individual winners at the stock level in some of the smaller countries such as Pakistan or Morocco. And events in these countries may reverberate through to other emerging markets. But following 24 countries with the same degree of detail is time-consuming and complicated. More importantly, these smaller countries are by definition not crucial to long-term success. So unless it's a particular interest of yours, you can track most emerging markets countries at arm's length. Focus your time on the largest countries—the decision to overweight or underweight them will have the greatest impact on your portfolio's relative performance.
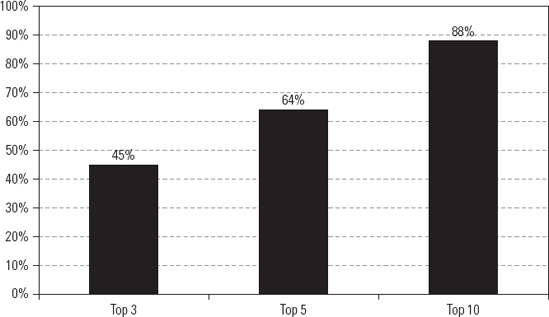
Figure 5.1. A Few Countries Dominate the MarketSource: Thomson Datastream, MSCI, Inc.[2] as of 12/31/2008.
Each country is also concentrated. As shown in Figure 5.2, the two largest sectors often represent a sizeable portion of the total market (in Peru's case, the entire market). This means an allocation to a specific country often has a residual allocation to the sectors that dominate it. For example, if you wish to purchase a Russian company, there's a good chance it will be in the Energy or Telecommunication Services sector. This also works the other way—if your interest is an Energy company, there's a good chance you'll eventually knock on Russia's door. Sometimes portfolio decisions will be driven by sector considerations; other times they will be driven by country considerations. Most of the time, however, it's some combination of both.
As Figure 5.3 shows, a handful of stocks comprise the bulk of most countries, too. The top five companies in Indonesia, for instance, make up nearly two-thirds of its market weight. Some corners of the world, like Argentina, don't even have five companies included in the index (it has four). By contrast, developed markets are notably less concentrated—the top five companies in the US and Japan comprise less than 15 percent of their respective countries.
The lesson? The structural characteristics of emerging markets reveal the best way to approach investing: from the top-down. Focusing solely on stocks, without considering underlying country or sector concentrations, can subject a portfolio to unintended performance swings.
Overwhelmingly, investment professionals today do what can broadly be labeled "bottom-up" investing. Their emphasis is on stock selection. A typical bottom-up investor researches an assortment of companies and attempts to pick those with the greatest likelihood of outperforming the market. The type of stock is usually an afterthought—it could be a donut chain or lawn mower manufacturer as long as the company's individual merits warrant investment. The selected securities are cobbled together to form a portfolio, and factors like country and economic sector exposure are often residuals of security selection, not planned decisions.
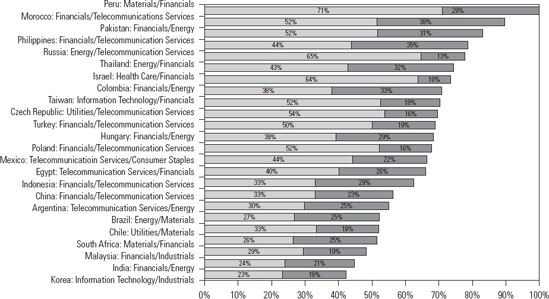
Figure 5.2. Sector Concentration Within CountriesSource: Thomson Datastream, MSCI Inc.[3] as of 12/31/2008.
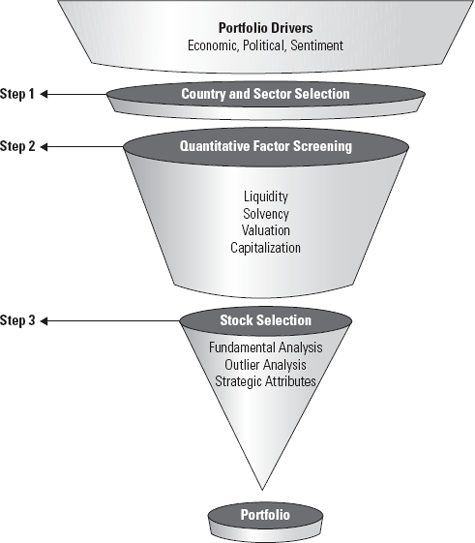
"Top-down" investing reverses the order. A top-down investor first analyzes big-picture factors like economics, politics, and sentiment to forecast which investment categories are most likely to outperform the market. Only then does a top-down investor begin looking at individual securities. Top-down investing is inevitably more concerned with a portfolio's aggregate exposure to investment categories than with any individual security. Thus, top-down is an inherently dynamic mode of investment because investment strategies are based upon the prevailing market and economic environment (which changes often).
There's significant debate in the investment community as to which approach is superior. This book's goal is not to reject bottom-up investing—there are indeed investors who've successfully utilized bottom-up approaches. Rather, the goal is to introduce a comprehensive and flexible methodology that any investor could use to build a portfolio designed to beat the global stock market in any investment environment. It's a framework for gleaning new insights and making good on information not already reflected in stock prices.
There are several key reasons why a top-down approach is advan-tageous:
Scalability: A bottom-up process is akin to looking for needles in a haystack. A top-down process is akin to seeking the haystacks with the highest concentration of needles. Globally, there are 25,000+ publicly traded stocks. Even the largest institutions with the greatest research resources cannot hope to adequately examine all these companies. Smaller institutions and individual investors must prioritize where to focus their limited resources. Unlike a bottom-up process, a top-down process makes this gargantuan task manageable by determining, upfront, what slices of the market to examine at the security level.
Enhanced stock selection: Well-designed top-down processes generate insights that can greatly enhance stock selection. Macroeconomic or political analysis, for instance, can help determine what types of firms will face head-or tailwinds (see Chapter 6 for a full explanation).
Risk control: Bottom-up processes are highly subject to unintended risk concentrations. Top-down processes are inherently better suited to manage risk exposures throughout the investment process.
Macro overview: Top-down processes are more conducive to avoiding macro-driven calamities like the bursting of the Japan bubble in the 1990s, the Technology bubble in 2000, or the bear market of 2000 to 2002. No matter how good an individual company may be, it is still beholden to sector, regional, and broad market factors. In fact, there is evidence "macro" factors can largely determine a stock's performance regardless of individual merit.
A top-down investment process also helps focus on what's most important to investment results: asset allocation and sub-asset allocation decisions. Many investors focus most of their attention on security-level portfolio decisions, like picking individual stocks they think will perform well. However, studies have shown that over 90 percent of return variability is derived from asset allocation decisions, not market timing or stock selection.[165]
Our research shows about 70 percent of return variability is derived from asset allocation, 20 percent from sub-asset allocation (such as country, sector, size, and style), and 10 percent from security selection. While security selection can make a significant difference over time, higher-level portfolio decisions dominate investment results more often than not.
The top-down method begins by first analyzing the macro environment. It asks the "big" questions like: Do you think stocks will go up or down in the next 12 months? If so, which countries or sectors should benefit most? Once you have decided on these high-level "themes," you can examine various macro portfolio drivers to make general overweight and underweight decisions for countries, sectors, industries, and sub-industries versus your benchmark.
For instance, let's say we've determined a macroeconomic driver that goes something like this: "In the next 12 months, I believe global economic growth will be higher than most expect." That's a very high-level statement with important implications for your portfolio. It means you'd want to search for countries, industries, and ultimately stocks that would benefit most from strong global economic growth. Chapter 6 will cover the process of developing these types of portfolio drivers in depth.
The second step in top-down is applying quantitative screening criteria to narrow the choice set of stocks. Since, in our hypothetical example, we believe global growth will be strong, it likely means we're bullish on emerging market stocks. But which ones? Are you bullish on, say, mining companies? Department stores? Telephone carriers? Do you want producers with exposure to a specific region? Do you want small cap companies or large cap? And what about valuations? Are you looking for growth or value? (Size and growth/value categories are often referred to as "style" decisions.) These criteria and more can help you narrow the list of stocks you might buy.
There are thousands and thousands of stocks out there, so it's vital to use a series of factors like market capitalization and valuations to narrow the field a bit. Securities passing this screen are then subjected to further quantitative analysis to eliminate companies with excessive risk profiles relative to their peer group, such as companies with excessive leverage or balance sheet risk and securities lacking sufficient liquidity for investment.
The rigidity of the quantitative screens is entirely up to you and will determine the number of companies on your prospect list. The more rigid the criteria, the fewer the companies that make the list. Broader criteria will increase them.
How can you perform such a screen? Here are two examples of quantitative factor screenings to show how broad or specific you can be. You might want to apply very strict criteria, or you may prefer to be broader.
Strict Criteria
First, you decide you want to search for only emerging market companies. By definition, that excludes all companies from the developed markets. Already, you've narrowed the field a lot!
Now, let's say, based on your high-level drivers, you only want Latin American stocks. By excluding all other regions besides Latin America, you've narrowed the field even more.
Next, let's decide to search only for steel companies because you think demand for building materials will be high.
Perhaps you don't believe very small stocks are preferable, so you limit market capitalization to $5 billion and above.
Last, let's set some parameters for valuation:
This rigorous process of selecting parameters will yield a small number of stocks to research, all based on your higher-level themes. But maybe you have reason to be less specific and want to do a broader screen because you think emerging markets in general is a good place to be.
Broad Criteria
Emerging markets
Latin America (no sector restrictions)
Market caps above $10 billion
This selection process is much broader and obviously gives you a much longer list of stocks to choose from.
Doing either a strict or broad screen isn't inherently better. It just depends on how well-formed and specific your higher-level themes are. Obviously, a stricter screen means less work for you in step three—actual stock selection.
After narrowing the prospect list, the third and final step is identifying individual securities possessing strategic attributes consistent with higher-level portfolio themes (Chapter 7 will cover the stock selection process in more detail). Your stock selection process should attempt to accomplish two goals:
Find firms possessing strategic attributes consistent with higher-level portfolio themes, derived from the drivers that give those firms a competitive advantage versus their peers. For example, if you believe owning firms with dominant market shares in consolidating industries is a favorable characteristic, you would search for firms with that profile.
Maximize the likelihood of beating the category of stocks you are analyzing. For example, if you want a certain portfolio weight to commercial banks and need 4 stocks out of 12 meeting the quantitative criteria, you then pick the 4 that, as a group, maximize the likelihood of beating all 12 as a whole. This is different than trying to pick "the best four." By avoiding stocks likely to be extreme or "weird" outliers versus the group, you can reduce portfolio risk while adding value at the security selection level.
In lieu of picking individual securities, there are other ways to exploit high-level themes in the top-down process. For instance, if you feel strongly about a particular sub-industry but don't think you can add value through individual security analysis, it may be more prudent to buy a group of companies in the sub-industry or a category product like an exchange-traded fund (ETF). There are a growing variety of ETFs that track the emerging markets. This way, you can be sure to gain broad exposure without much stock-specific risk. (For more information on ETFs, visit www.ishares.com, www.sectorspdr.com, or www.masterdata.com.)
Notice that a great deal of thinking, analysis, and work is done before you ever think about individual stocks. That's the key to the top-down approach: It emphasizes high-level themes and funnels its way down to individual stocks, as illustrated in Figure 5.4.
The next two chapters expand on Steps 1 and 3—the meat of the portfolio construction process—specifically in relation to emerging markets. We seek to provide the tools to answer the following types of questions: What allocation to emerging markets is appropriate? When might Latin American stocks outperform? How about Taiwan Health Care stocks (trick question, there are none in the index)?[166]
Chapter Recap

This concentration reveals the best way to approach investing: from the top-down.
The top-down approach emphasizes big-picture factors like economics, politics, and sentiment to forecast which categories are most likely to outperform the market.
These high-level themes—portfolio drivers—then funnel down to individual stock selection.