
Chapter 11. Debugging and Troubleshooting
Debugging Is a Good Thing
Murphy’s Law may be pessimistic, but at some point for all of us, the adage rings true: If something can go wrong, it will. Despite your best intentions, the SWF files you produce will sooner or later perform in unexpected ways. Maybe an audio clip will fail to play or a button will get stuck in its rollover state. In complex situations, the likelihood of a Murphyism is bound to increase, especially in projects comprised of numerous ActionScript classes or SWF files. This all makes perfect sense, of course. Complexity means a developer has to keep more in mind while working. Humans simply have a limit to the number of details they can juggle at once, so the occasional particulars get overlooked. The cause of unexpected behavior is usually the result of an error in the developer’s logic, though certainly other factors may come into play. An external asset, such as a JPEG file, might be missing from the server; a needed database might be inaccessible; perhaps a typo has crept into the code. The challenge in all these cases is straightforward. Once a SWF file is compiled, the timeline and all vestiges of ActionScript are gone. Assets and programming code have been compiled into bytecode, which is effectively indecipherable to the eye—and unchangeable.
How, then, can a developer see what’s going on, other than to experience the error(s) directly and make minimally informed guesses? The answer hinges on debugging, which is a skill, and ultimately a way of thinking, that will help you tremendously in your Flash endeavors. Fortunately, Flash CS4 Professional features a number of updated debugging tools. Some of these work just fine for documents configured for ActionScript 2.0, but the most beneficial improvements appear with ActionScript 3.0.
Testing Your ActionScript 3.0 Code
Programmers tend to learn a famous motto early on, especially when the teacher isn’t a book or mentor, but rather a challenging experience. There’s nothing like a fiasco to make a learning point stick, especially when you have to stay late at the office to fix it! The motto goes like this: Test early, test often. This bears repeating. Test early, test often.
This motto is a good one because it keeps you from getting ahead of yourself. If you type 100 lines of code, either in a keyframe or class file, and only test at that point ... well, you’re taking a pretty big risk. If your ActionScript has errors, the issue (or issues) might stem from any one (or more) of those 100 lines. To be sure, some errors do cause chain reactions, so you really can’t guarantee that you’ll see only a handful of errors at once. Sometimes you’ll see dozens. Ideally, though, you’ll want to grind through as few simultaneous errors as possible. Testing early and testing often helps keep those numbers down.
Compiler Errors
You can perform testing, in its most basic form, by the simple act of running a SWF file in the Flash authoring tool (Control→Test Movie, or Control→Test Scene). If invalid code causes the compiler concern, it alerts you by sending an announcement to the Compiler Errors panel. This alert occurs without any effort on your part. In fact, errors brought to light in this way are the sort that keep a SWF file from compiling in the first place, so a user never sees this category of errors.
The Compiler Errors panel gives you a brief description of each error, and lets you know where to find it, including relevant asset names and scene, layer, frame, and line numbers. For more information on this panel, see the section Exploring the Compiler Errors Panel later in this chapter.
The Flash authoring tool lets you configure the degree to which the Compiler Errors panel displays its messages. This is determined by a pair of modes called Strict Mode and Warnings Mode, which can be set on a per-FLA file basis under File→Publish Settings→Flash→Settings.
Note
You can get a full list of ActionScript 3.0 compiler errors from the built-in documentation (search “compiler errors”), or online at the Adobe online Help Resource Center:
| http://help.adobe.com/en_US/AS3LCR/Flash_10.0/compilerErrors.html |
Some errors appear only when you compile in Strict Mode (enabled by default). Strict mode is determined by the presence of a check mark under File→Publish Settings→Flash→Settings→Strict Mode.
Compiler Warnings
Once a SWF file compiles, it is finally capable of trying to carry out the instructions you’ve given it. Even so, your technically valid code may not be written according to the recommended best practices of Adobe. As an example, consider type declaration, which is optional in ActionScript 3.0. It’s possible and valid to declare variables without including a post colon suffix:
// type declared
var worthANickel:int = 5;

// type not declared
var worthADime = 10;
However, omitting the type declaration keeps you from benefiting
from ActionScript 3.0’s improved
efficiency in Flash Player 9 and higher. For example, in ActionScript
3.0, the int type (a 32-bit signed
integer) takes up less system memory than the Number type (a 64-bit double precision
non-integer). If you choose to refrain from explicitly specifying a
variable’s data type, Flash has no choice but to request as much memory
as it reasonably can, on the chance that the variable might be a string,
a date, or some other object that requires more RAM. For this reason
alone, although type declarations are not required, they’re definitely a
good idea. Compiler warnings provide a good reminder of recommended best
practices like this one, and they also appear in the Compiler Errors
panel.
In addition, some of these warnings are geared toward developer
education. Certain programming concepts, sometimes specific to
ActionScript, seem intuitive right away, while others may sink in only
after months of experience. For example, the default value of many data
types is null; that is, variables that have been declared and include
type declarations but have not yet been assigned a value.
var str:String;
trace(str); // Displays: null

var d:Date;
trace(d); // Displays: null

var mc:MovieClip;
trace(mc); // Displays: null
If you compare any of these to null with an if statement, the expression evaluates to
true:
var str:String;
if (str == null) {
    trace("default value is null");
} else {
    trace("default value is something else");
}
// Displays: default value is null
If you’re new to Flash programming, you might assume that the
default value for all data types is null, but as it turns out, instances of
Boolean, int, uint,
and Number are by default false, 0,
0, and NaN (Not a Number), respectively.
In the following example, the comparison of the default value of a
Boolean to null is actually
interpreted as false:
var b:Boolean;
if (b == null) {
    trace("default value is null");
} else {
    trace("default value is something else");
}
// Displays: default value is something else
In practice, this means your ActionScript might not always behave as you had intended. Many compiler warnings help steer you in the right direction.
Finally, a number of compiler warnings relate specifically to ActionScript 2.0–3.0 migration issues. You may consider these Help docs migration warnings a collection of freebie insider tips!
Note
A full list of ActionScript 3.0 compiler warnings can be obtained from the built-in documentation (search “compiler warnings”), or online at the Adobe online Help Resource Center:
| http://help.adobe.com/en_US/AS3LCR/Flash_10.0/compilerWarnings.html |
Note that some warnings appear only when you compile in Warnings Mode (enabled by default). Warnings mode is determined by the presence of a check mark in File→Publish Settings→Flash→Settings→Warnings Mode.
Runtime Errors
Runtime errors occur, by definition, at runtime—in other words, after a SWF file has passed the rounds of compiler errors and warnings. Because of this, runtime errors are often a bit harder to track down than the sort described earlier. After all, the ActionScript involved has already passed the test: it’s valid, and has already been converted to bytecode. At that point, the scenes, layers, and line numbers shown in compiler errors and warnings are effectively meaningless. For this reason, notifications of runtime errors do not (cannot!) provide an X-marks-the-spot treasure map to erroneous ActionScript. In fact, the code itself might actually be just fine. The culprit may well be a malformed external file. Don’t let that alarm you, though. While not as precise as compiler errors and warnings in terms of location, runtime error messages do try to show where they originated.
Figure 11-1 shows an
example error in which a SWF file attempts to load an XML document that
provides file data for a slideshow. In this case, the ActionScript is correct; it’s the XML that
contains an error (one of the elements, <slide>, is missing its matching
end-tag, </slide>). Because
this SWF file is being tested in the Flash authoring tool, the runtime
error is displayed in the Output panel.
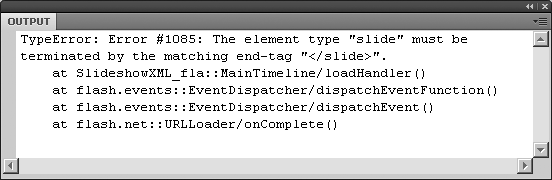
Helpfully, this message indicates that the trouble happened during
the execution of a function named loadHandler() in the main timeline, as seen in
the first line that starts with the word “at.” Further hints—the mention
of EventDispatcher and URLLoader/onComplete()—suggest that loadHandler() is an event handler. These are
all signposts that should at least give you a head start as you
re-examine your source files. Given the error’s description, “the
element type ‘slide’ must be terminated...,” and the hints on where to
look, you have considerably more information to go on than in previous
versions of Flash, which provided only compiler errors and
warnings.
To a certain extent, runtime errors are only as helpful as your naming conventions and coding practices. For example, the ActionScript that loads the XML in Figure 11-1 might look something like this:
var myXML:XML = new XML();
var xmlLoader:URLLoader = new URLLoader();
xmlLoader.load(new URLRequest("slideshow.xml"));
xmlLoader.addEventListener(Event.COMPLETE, loadHandler);
That last line of code associates a custom function, loadHandler(), with an Event.COMPLETE event. This event is dispatched
when the xmlLoader instance finishes
loading the slideshow.xml file. The
loadHandler() function might look
like this:
function loadHandler(evt:Event):void {
    myXML = XML(evt.target.data);
    myComboBox.dataProvider = new DataProvider(myXML);
}
There’s certainly nothing wrong with that function—it’s valid
ActionScript—but because the error message mentions loadHandler() by name, you know where to find
it in the source file’s frame script. The lack of any obvious errors in
the function itself may nudge you into looking at the XML file, where
the error actually occurs.
In this scenario, the warning message’s guidance is helpful
because loadHandler() is defined as a
named function. This event handler might just as well have been written as
a function literal, also known as an
anonymous function, in which the function’s code
appears directly as a parameter of addEventListener() (changes in
bold):
var myXML:XML = new XML();
var xmlLoader:URLLoader = new URLLoader();
xmlLoader.load(new URLRequest("slideshow.xml"));

xmlLoader.addEventListener(
    Event.COMPLETE,
    function (evt:Event):void {
        myXML = XML(evt.target.data);
        myComboBox.dataProvider = new DataProvider(myXML);
    }
);
If so, the runtime error inevitably becomes less clear, simply because the event handler function no longer has a name.
TypeError: Error #1085: The element type "slide" must be
    terminated by the matching end-tag "</slide>".
    at MethodInfo-392()
    at flash.events::EventDispatcher/dispatchEventFunction()
    at flash.events::EventDispatcher/dispatchEvent()
    at flash.net::URLLoader/onComplete()
This time, the function formerly known as loadHandler() is referenced as MethodInfo-392(). Cryptic? Perhaps. The
compiler automatically assigns a name to the anonymous function.
Ultimately, everything must have a reference, so Flash does what it
needs to in order to keep track of the instructions you’ve given it.
Bear this trait in mind as you program, and avoid anonymous functions if
you want to improve the clarity of your error messages.
Note
A full list of ActionScript 3.0 runtime errors can be obtained from the built-in documentation (search “run-time errors”), or online at the Adobe online Help Resource Center:
| http://help.adobe.com/en_US/AS3LCR/Flash_10.0/runtimeErrors.html |
Note that runtime errors appear regardless of your settings for compiler errors and warnings, located under File→Publish Settings→Flash→Settings.
Reviewing Improvements in Debugging Over ActionScript 2.0
So far, you’ve seen a number of ways in which Flash communicates
problems without you having to take any action (other than to address the
errors, of course!). But true problem solving, at minimum, is an
interactive process. Ideally, it’s proactive. The remainder of the chapter
fleshes out the Compiler Errors panel in greater detail, and introduces
additional debugging tools that require input from you, ranging from the
simplest—the humble trace() function—to
the improved debug workspace.
Don’t Underestimate trace()
The trace() function bears some
similarity to good old low-tech paper sticky notes. Regardless of how
powerful (and portable) PDAs and cell phones have become, replete with
programmable reminders, alarms, and automated email dispatches, nothing
beats the convenience of those stick-anywhere yellow notes. They’re
lightweight, informative, and reusable. Likewise, the trace() function makes a terrific and
uncomplicated tool.
In short, the trace() function
sends information to the Output panel. The information it sends is
entirely up to you. Doing so is as easy as passing an expression to the
function as a parameter. To ensure that a button is responding to mouse
clicks, for example, you might pass in a simple confirmation string.
myButton.addEventListener(MouseEvent.CLICK, onClick);
function onClick(evt:MouseEvent):void {
    trace("This button is working!");
}
Of course, you’re not limited to strings. The trace() function is great for bringing all
sorts of things to light, from the current value of a custom variable to
the contents of an XML node; from the position of a movie clip (for
example, the MovieClip.x property) to
an object’s data type when used with the is operator.
var s:Sprite = new Sprite();
trace(s is Sprite); // Displays true
trace(s is Number); // Displays false
Be aware that trace() always
outputs a string, no matter what expression you feed it. When passed any
object, the function essentially invokes the Object.toString() method defined for that
object (remember, all objects in ActionScript inherit from the Object class, which means all objects have a
toString() method).
So, has anything changed for this elementary debugging tool in
ActionScript 3.0? The answer is yes, even though it’s a small update.
Sometimes it’s the little things that can make your day! The trace() function now accepts multiple
parameters, separated by commas. If you’re heavily into using trace(), this can save you a degree of
typing.
var n:Number = 42;
var b:Boolean = true;
var d:Dictionary = new Dictionary();
trace(n, b, d); // Displays 42 true [object Dictionary]
In previous versions of ActionScript, the same output would have required a bit of string wrangling:
trace(n + " " + b + " " + d);
// Displays the same, but tedious to type
Warning
Trace statements display only when enabled. This situation
occurs when two settings in the Flash authoring tool are in agreement.
The checkbox under File→Publish Settings →Flash→Omit trace actions
must be deselected. Also, the Output panel’s filter level must be set
to Verbose. The filter level is available under the Output panel’s
![]() menu in the upper-right corner (beneath the
menu in the upper-right corner (beneath the X that closes the panel).
Runtime Errors Displayed in Flash Player 9 and Higher
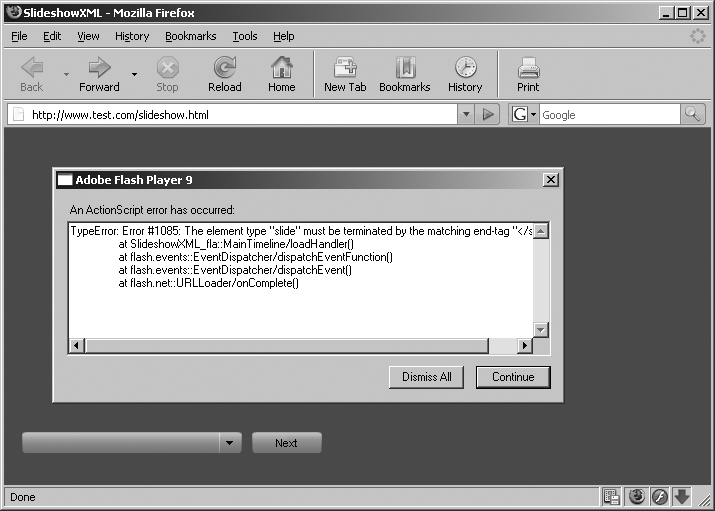
Runtime errors are available only in ActionScript 3.0, which means they’re available only as of Flash Player 9. Returning to the example shown earlier (Figure 11-1), if the same SWF file is embedded in an HTML document and viewed in a browser, the error message appears in a dialog box presented to the user, as shown in Figure 11-2. In ActionScript 2.0 or 1.0, something like this would likely have failed silently—meaning, the user may have seen partial elements of the user interface, but none of the slideshow photos. In fact, in such a scenario, it might not even be absolutely clear that something has gone wrong. The website may simply come across as incomplete or abandoned. ActionScript 3.0 fixes that. Because runtime errors are visually obvious—that dialog box is hard to miss!—the developer sees and addresses errors before the SWF file goes public.
Note
To see runtime errors in a browser, as demonstrated in Figure 11-2, you must have a debug version of Flash Player 9 or higher installed. Debugging is introduced in the Debug Vs. Release Players of Chapter 2 and explored further in this chapter.
Exploring the Compiler Errors Panel
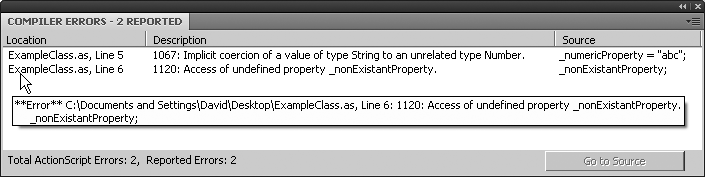
The Compiler Errors panel gives you a remarkably direct road map to errors and warnings related to the process that compiles FLA source files to published SWF files. If multiple errors or warnings are found, the Compiler Errors panel displays one line item per message, as shown in Figure 11-3.
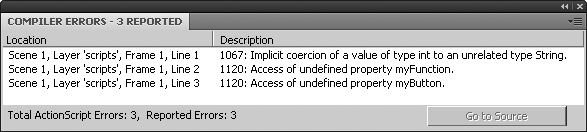
Notice that the Compiler Errors panel gives you quite a bit of information. The panel’s tab reports the number of errors found (three, in this case). The status bar at the bottom of the panel duplicates this information for convenience. Three columns inside the panel dictate where to locate the problem (these are the Location and Source columns; only Location appears in Figure 11-3) and a detailed summary of the error (the Description column).
The Location column provides the scene, layer, frame, and line number of the offending code, which is incredibly useful for files whose ActionScript is distributed among numerous keyframes or class files. The Source column shows the line of code itself. In cases where code has been placed inside the nested timeline of a movie clip symbol, the Location column mentions that symbol by name, and then the layer, frame, and line number, as before. In Figure 11-4, an error occurs in the scripts layer of a movie clip symbol whose library name is “space ship.”
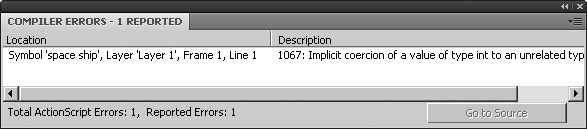
In this scenario, it doesn’t matter what scene or layer the symbol appears in—several instances might, in fact, appear in many places. Likewise, it doesn’t matter if any of the symbol’s instances has been given an instance name in the Property inspector, as only the original asset in the library needs correction.
When erroneous ActionScript has been placed in external class files instead of keyframes, the Location column states the name of the ActionScript file, and then the line number. If at any time the panel seems too cramped, bring your mouse pointer over a line item, as shown in Figure 11-5. This brings up a tooltip that displays the full content of all three columns.
To copy the content of the Description or Source column to the clipboard, right-click (Ctrl-click) the desired line item and select the appropriate option from the context menu. You’ll also find an option for clearing all the panel’s line items (Clear) and for jumping to the location of the actual line of ActionScript (Go to Source). The latter moves the playhead automatically to the relevant keyframe, opens the Actions panel if necessary, and highlights the guilty line number. This happens even in nested movie clip timelines, in which case the movie clip symbol is opened in the Symbol Editor from the library. If the code is in an ActionScript class file, then Flash jumps to the relevant line, opening the AS file if necessary.
This line jumping is a remarkable productivity booster and can also be activated by the Go to Source button in the lower-right corner of the panel, which becomes enabled when you click a line item to select it. In fact, this feature is so welcome, there’s even a third way to trigger it: simply double-click the desired line item.
Using the Compile Errors Panel to Open Code
Double-clicking a Compiler Errors panel line item is the quickest route to accessing and fixing problematic code. Here’s a quick example.
In a new ActionScript 3.0 FLA file, use the Rectangle tool to draw a small shape anywhere on the Stage.
Convert the shape to a movie clip symbol, and then double-click the symbol to enter its timeline.
Inside the symbol’s timeline, add a new layer named scripts. Add a keyframe in frame 15 of the
scriptslayer, and then open the Actions panel. Type the following invalid ActionScript:var shouldBeNumeric:Number = "But this is a string.";Choose Edit→Edit Document to return to the main timeline.
Choose Control→Test Movie to see an implicit coercion error in the Compiler Errors panel.
Close the Actions panel. Double-click the error in the Compiler Errors panel to see Flash reopen the Actions panel and jump automatically to the correct line number of frame 15 of the movie clip symbol’s timeline.
Interpreting and Understanding Errors
Admittedly, the numbers assigned to compiler errors, warnings and runtime errors aren’t self-explanatory. Compiler errors range from 1000 to 1209, warnings from 1009 to 3607, and runtime errors from 1000 to 2157. The numbers are completely arbitrary (at least, to non-Adobe employees), so you can’t easily group them by some pattern or mnemonic device, such as, “Ah, those 1-800 phone numbers are the toll free ones.” While you may eventually find yourself recognizing the numbers of a handful of your own pet errors, the bottom line is that you’ll want to pay attention to their descriptions. As a note of encouragement, even if the numeric assignments don’t have much inherent meaning, they’re great for using as search terms at the Adobe website, Google, and your favorite tech blogs.
These errors and warnings are listed in the ActionScript 3.0 Language Reference (search Help for “compiler errors,” “compiler warnings,” and “run-time errors”). Skim through the documentation’s Code Message heading for any of these terms, and you’ll see that for the most part, the messages themselves are fairly straightforward. True, not all of them necessarily make sense when they occur. That trait is demonstrated later in this chapter with “Compiler Error: 1037: Packages cannot be nested.” But even that message comes together after an explanation, and a fair number of errors and warnings feature a Description heading in the same table that shows the Code Message heading. The content of that Description column, when it does appear, may overlap with the Description column of the Compiler Errors panel. Even so, it often elaborates, including code samples.
One of the most helpful things you can bear in mind when
interpreting errors and warnings is that ActionScript 3.0 is an
object-oriented language—this version more so than any other. The
ActionScript 3.0 Language and Components Reference is neatly organized
into a structure that matches the hierarchy of the application
programming interface (API) of Flash itself; in other words,
in a structure that matches the very composition of the language. If an
error or warning mentions a class file you don’t think you’re using,
look up that class and investigate its placement in the class hierarchy
(essentially a family tree). You might, for example, see a compiler error concerning
the DisplayObject class, even though you
suspect the issue is related to a button symbol. As Figure 11-6 shows, the DisplayObject class listing, like all class
listings, shows a collection of hyperlinks just below the main
heading.
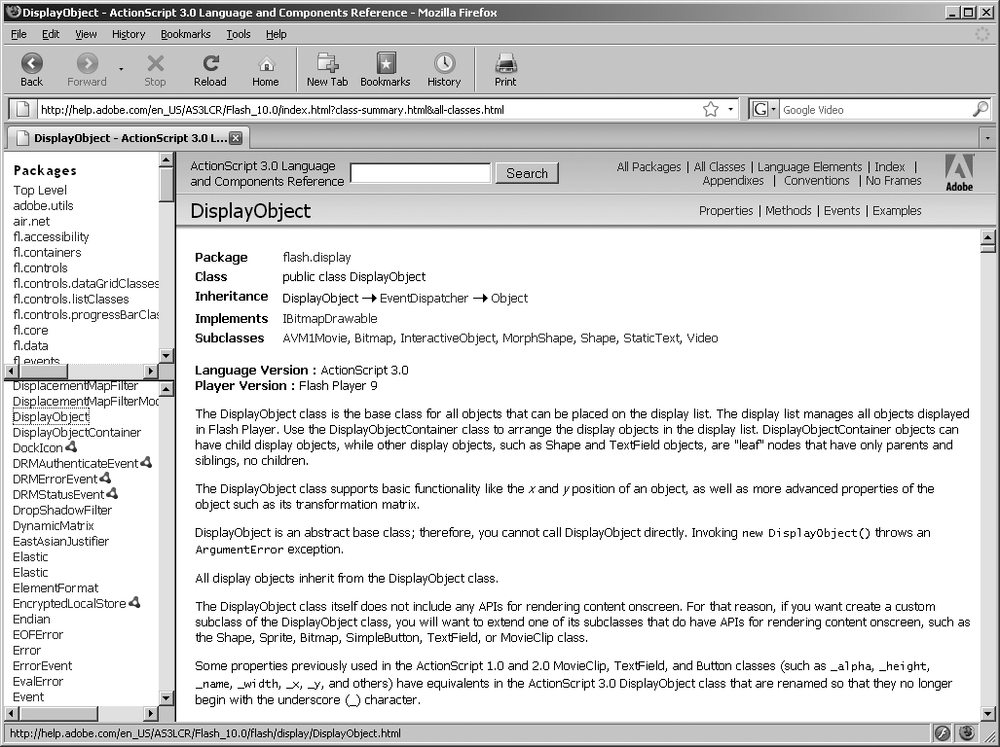
These links include Package, Inheritance, and Subclasses. The
Package heading tells what major branch of the API this class belongs to
(in this case, the flash.display package). The Inheritance
heading tells what classes this class inherits from. Here, it’s easy to
see that all DisplayObject objects
are also instances of EventDispatcher—they feature all the
functionality of that class, plus functionality of their own—and are
also instances, ultimately, of the Object class. The Subclasses heading tells
what classes further extend this class by inheriting from it. In this
hypothetical scenario, you’re looking for something that seems like a
button, because your hunch tells you a button symbol is at fault. Of the
choices shown, InteractiveObject
seems like the best bet. Certainly, it won’t always be this easy, but be
sure to always let your fingers do the walking through the
documentation.
The documentation is the closest resource and often the quickest
way to find your bearings. Clicking InteractiveObject brings you to the listing
for that class, whose own Subclasses heading includes an entry called
SimpleButton, which in fact is the
class that defines button symbols.
Note
The authoring tool includes Help content that is installed locally on your hard drive. If you don’t have an Internet connection, you’re not entirely out of luck, but the local content is limited to the Using Flash book and the ActionScript 3.0 Language and Components Reference. For anything outside of that, including ActionScript 2.0 reference documentation, you do need to be online.
Identifying Common Errors and What They Mean
Coming from any level of ActionScript 2.0 experience, you may find yourself “stuck” with old habits that were perfectly fine before, perhaps even recommended best practices. New syntax changes things. Some changes are relatively obvious, because they get abundant coverage in the Adobe Developer Connection (http://www.adobe.com/devnet/); the improved ActionScript 3.0 event handling model comes to mind. Other changes may show up on your doorstep at midnight unannounced, pushing their way past you to the fridge, thanking you in advance for a place to crash—through mouthfuls of your last leftover pizza. Here’s a list of some of most common gate-crashers.
Be careful where you type your code
Many of the ActionScript 3.0 guides on the market—and in fact,
most of the code samples in the ActionScript 3.0 Language
Reference—are written in class format, complete with package and class declarations. When such code is typed or pasted into a keyframe, you
see the following compiler error:
Compiler Error: 1037: Packages cannot be nested.
This error happens because every ActionScript 3.0 SWF file is associated with a default document class (see Chapter 6), which can be optionally overridden by a custom class. This means the SWF file’s code already exists inside a package automatically. The introduction of a second (seemingly original) package declaration in timeline code causes those two packages to be nested, which isn’t allowed.
To test sample code that’s formatted as a class, make sure to set it as the document class of your FLA file or create an instance of it in your timeline code:
var codeSample:ExampleCode = new ExampleCode();
Alternatively, though it may take more effort, you can “lift”
the relevant code sample from its class trappings by removing the
package and class declarations and any exclusively
class-related elements, such as public and private member attributes, converting
constants to variables, and the like.
Here’s an example that lets you test a code sample from the
ActionScript 3.0 Language Reference in a timeline keyframe. This example is taken directly from the Graphics.moveTo() method listing:
package {
    import flash.display.Sprite;
    import flash.display.CapsStyle;
    import flash.display.LineScaleMode;
    public class Graphics_moveToExample extends Sprite {
        public function Graphics_moveToExample():void {
            graphics.lineStyle(3, 0x990000, 0.25, false, ¬
                 LineScaleMode.NONE, CapsStyle.SQUARE);
            graphics.moveTo(10, 20);
            graphics.lineTo(20, 20);
            graphics.moveTo(30, 20);
            graphics.lineTo(50, 20);
            graphics.moveTo(60, 20);
            graphics.lineTo(80, 20);
            graphics.moveTo(90, 20);
            graphics.lineTo(110, 20);
            graphics.moveTo(120, 20);
            graphics.lineTo(130, 20);
        }
    }
}
As written, you can’t test this ActionScript from a keyframe. It
must be saved as an ActionScript (.as) file named Graphics_moveToExample.as in the same
folder as a new ActionScript 3.0 FLA file. The FLA file’s document
class must be set to Graphics_moveToExample, as explained in
Chapter 6.
The point of this sample code is to demonstrate the moveTo() method, which is simple enough to
illustrate and actually use in a timeline setting. Note that this
class extends Sprite, which means
that when used as a document class, it treats the main timeline as a
Sprite instance. Because the
Sprite class and MovieClip class share the same family tree,
both inherit a graphics property
from DisplayObject. This means that
even the default document class—that is, the absence of a custom
document class (just a plain old FLA file)—can be used for this
example. Contrast the previous package-based code with the following
pared-down revision:
function Graphics_moveToExample():void {
    graphics.lineStyle(3, 0x990000, 0.25, false, ¬
         LineScaleMode.NONE, CapsStyle.SQUARE);
    graphics.moveTo(10, 20);
    graphics.lineTo(20, 20);
    graphics.moveTo(30, 20);
    graphics.lineTo(50, 20);
    graphics.moveTo(60, 20);
    graphics.lineTo(80, 20);
    graphics.moveTo(90, 20);
    graphics.lineTo(110, 20);
    graphics.moveTo(120, 20);
    graphics.lineTo(130, 20);
}
Graphics_moveToExample();
The package and class declarations are gone. The import statements are gone. The constructor
function, along with its public
attribute, has been removed. What remains is the part that actually
demonstrates the moveTo() method.
If you paste the revised version in frame 1 of a new ActionScript 3.0
FLA file and test the movie, you see a dashed line in the upper-left
corner of the stage. The dashed line occurs because lineTo() draws while moveTo() merely moves the pen.
Remember to omit property underscores
Years ago, most of the familiar movie clip getter/setter
properties were preceded by an underscore (MovieClip._x, _y, _width, _height, _currentframe, and so on). As ActionScript
matured and new properties were introduced, the underscore was omitted
for the new properties (MovieClip.hitArea, scale9Grid, forceSmoothing, and so on). This led to a
perplexing situation for newcomers, as it wasn’t apparent without
longtime experience why some properties had the underscore and others
didn’t. It was simply a matter of a historical change in convention.
This scenario was frustrating for seasoned developers new to Flash
because, by widely held convention (even in other programming
languages), private class members are often preceded with an
underscore to set them apart—yet the MovieClip getter/setter properties, and also
those of the TextField class and
others, were public.
In ActionScript 3.0, the underscore has been dropped across the
board as a relic of the past. Still, you may find that your fingers
automatically type mc._width when
you actually mean mc.width.
// Assumes a movie clip symbol with the instance name mcBox
mcBox._x = 400; // Displays compiler warning
If you do, then you see a compiler warning when the compiler is configured for Warnings Mode:
Compiler Warning: 1058: Migration issue: The property _x is no
longer supported. Use the DisplayObject.x property instead.
You may also see an error in the Output panel:
ReferenceError: Error #1056: Cannot create property _x on flash.display.Sprite.
Don’t be thrown by the mention of DisplayObject or Sprite: the MovieClip class is a descendent of both
classes (its full pedigree is DisplayObject→InteractiveObject→DisplayObjectContainer→Sprite→MovieClip). Just drop the underscore and the
warning goes away:
mcBox.x = 400; // Updates movie clip's horizontal position
Referencing movie clip’s parent requires explicit conversion (casting)
Imagine a relatively simple movie, such as a banner ad or
corporate presentation. The main timeline moves from frame to frame,
then halts—thanks to a keyframe stop() call—and waits for a nested movie
clip in that frame to display an animation of its own. The last
keyframe of the nested movie clip tells the main timeline to continue
again by issuing a call to MovieClip.play() in the following
manner:
// Last keyframe of a movie clip symbol in the main timeline
this.parent.play();
That seems like a straightforward exercise, but in ActionScript 3.0 it generates a potentially confusing compiler error when the compiler is configured for Strict Mode.
Compiler Error: 1061: Call to a possibly undefined method play
    through a reference with static type flash.display: ¬
     DisplayObjectContainer.
How is MovieClip.play() an
undefined method, much less static? As it turns out, the problem here
is nothing more than a confusion of data type. From the point of view
of the movie clip’s timeline code, the expression this.parent thinks it’s referencing a
DisplayObjectContainer instance,
and that particular class appears too early in the MovieClip inheritance chain to feature a
play() method. Movie clip symbols
are instances of DisplayObjectContainer, but additional
inheritance eventually gives them the properties, methods, and events
featured in the MovieClip
class.
To nudge ActionScript 3.0 in the right direction, use the
as operator or relevant class function—in this case, MovieClip()—to explicitly convert, or cast,
the reference:
// Last keyframe of a movie clip symbol in the main timeline
(this.parent as MovieClip).play();
Or:
MovieClip(this.parent).play();Warning
In some cases, the as
operator is the only real choice for casting. Date(someValue) doesn’t convert to the Date data type, but instead behaves the
same as new Date.toString().
Array(someValue) behaves the same as new Array(someValue), which sets a new array to the length
specified by a numeric parameter.
Variables can be declared only once per timeline or class
In ActionScript 2.0, you could declare a variable in one frame,
then declare it again in another (or even the same) frame, or declare
the variable more than once in a class file. In fact, re-declaring a
variable was a handy way of clearing it out and starting fresh. It
tended to happen in one particular circumstance, especially: for statements. Due to the strict nature of
ActionScript 3.0, the following pair of for statements generates a compiler error
because the variable i has been
declared more than once in the same scope.
for (var i:int = 0; i < someUpperLimit; i++) {
    // loop code here
}
// Displays compiler error
for (var i:int = 0; i < someArray.length; i += 2) {
    // loop code here
}
Compiler Error: 1151: A conflict exists with definition
    variable name in namespace internal (or relevant namespace).
A compiler warning can also be generated by this issue.
Compiler Warning: 3596: Duplicate variable definition.
To fix these multiple declarations, drop the var definition keyword in the second (or any
subsequent) update of the value of the previously declared variable
(change in bold):
for (var i:int = 0; i < someUpperLimit; i++) {
    // loop code here
}
for (i = 0; i < someArray.length; i += 2) {
    // loop code here
}
Undeclared timeline variables cannot be referenced
In a common practice ActionScript 2.0 timeline code, an if statement could be used to check for the
existence of a variable. If the variable hadn’t yet been declared, or
hadn’t yet been given a value, a reference to it returned null or undefined, which resolved to false in an if statement. People often used this
technique for checking variables passed into the SWF file from
external code, such as JavaScript, as with FlashVars.
In ActionScript 3.0, any reference to an undeclared variable generates a compiler error when the compiler is configured for strict mode.
if (someUndeclaredVariable) { // Displays compiler error
    // variable exists
} else {
    // variable does not exist
}
Or:
// Displays compiler error
if (someOtherUndeclaredVariable != null) {
    // variable exists
} else {
    // variable does not exist
}
Generates an error:
Compiler Error: 1120: Access of undefined property variable name.
To avoid this error, precede the variable with the this expression keyword, which causes Flash to interpret the variable as a class
property. In ActionScript 3.0, after all, the main timeline is
associated with a default document class (see Chapter 6), which can be overridden by a
custom class. In either case, timeline variables are ultimately class
properties. The inclusion of this
reminds the compiler of that point and keeps the compiler error at
bay.
Properties and methods cannot be referenced from a null reference
Related closely to the previous example, ActionScript 3.0 generates a runtime error if you try to reference properties or methods of an object that hasn’t yet been given a value. (In the previous example, it was a reference to the variable or object itself that caused a compiler error.)
var aNullObject:Object; // Declared, but not given a value
if (aNullObject.someProperty) { // Runtime error
    // property exists
} else {
    // property does not exist
}
Results in the error:
TypeError: Error #1009: Cannot access a property or method
of a null object reference.
Note that the variable (an Object instance) does exist, but doesn’t yet
contain the property referenced, someProperty. To avoid the runtime error,
use the logical AND operator (&&) to test for the object
first:
var aNullObject:Object; // Declared, but not given a value
if (aNullObject && aNullObject.someProperty) {
    // property exists
} else {
    // property does not exist
}
Or use a try..catch..finally
block:
var aNullObject:Object;
try {
    if (aNullObject.aProperty) {
        // property exists
    }
} catch (e:Error) {
    // property does not exist
    trace("Caught error: " + e);
} finally {
    // trace("bad reference!");
}
Troubleshooting
How do you eat an elephant? One bite (or maybe one byte!) at a time. This adage has been a gentle encouragement since Lao Tzu first rendered it as The journey of a thousand miles begins with one step. In short, and in terms of programming, it speaks to breaking down large problems into smaller components, and then repeating the process until the first step (or first bite) becomes clear. In development environments, that first step, no matter how long the journey, tends to be easier when it’s small. Remember, testing early and testing often helps to keep you from getting overwhelmed.
When you do encounter an error or warning you truly can’t make
heads or tails of, your situation is ready for troubleshooting.
Troubleshooting is a “divide and conquer” approach to problem solving,
in which your main aim as a developer is to isolate potential sources of
the trouble at hand and, by a process of elimination, find the actual
causes and fix them. The trace()
statement, mentioned earlier in this chapter, is a good entry point into
the troubleshooting process. Two other tools, the Compiler Errors panel
and Output panel, are just as important and may be the instruments that
alerted you to the trouble in the first place. The most powerful tool in
your arsenal is the mechanism that lets you see into a SWF file’s inner
workings at runtime. It’s called the debugging
workspace, and it’s only available for ActionScript 3.0
documents.
Using the Enhanced Debugging Workspace
FLA documents configured for ActionScript 2.0 and earlier do have a debugging tool, but it exists as a fairly cramped environment, packed into a single panel called the ActionScript 2.0 Debugger panel (Figure 11-7).
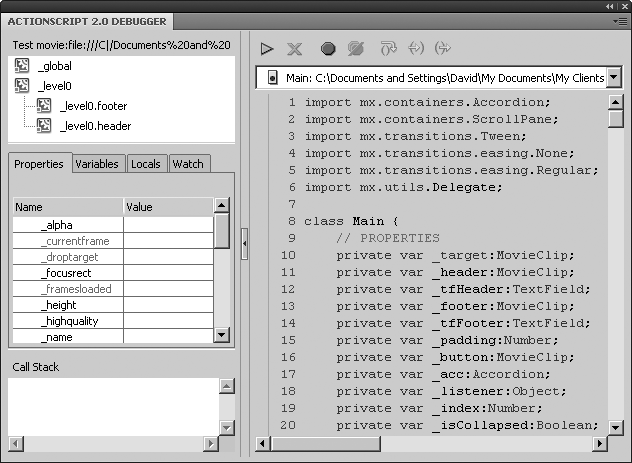
To be sure, the old panel is no slouch. It does get the job done. In addition, it’s your only choice if your document’s Publish Settings are configured for anything other than ActionScript 3.0 (see File→Publish Settings→Flash). In contrast, using the updated workspace is like stepping from an office cubicle into a swank conference lounge. Its panels are separate, which means you’ll find plenty of elbow room, and the panels can be collapsed, expanded, and rearranged like those of any other workspace (Figure 11-8).
Using the new debugger is relatively easy, but you should be aware of a few changes before diving into an example.
For better or worse, the ActionScript 2.0 Debugger panel’s
introspective tree view is no longer available in the new workspace. This
is unfortunate, because the tree view was a useful discoverability tool.
In addition, two file menu selections in the debug version of Flash Player
have disappeared for SWF files published in ActionScript 3.0. Those
selections were List Objects and List Variables, each of which sent a
text-based snapshot to the Output panel of the objects and variables
resident in memory at the time the selections were made. The closest
approximation now for the List Objects and List Variables selections is
the new public describeType() function,
found in the flash.utils package.
Use a trace() statement to
display the results to the Output panel in XML format:
trace(describeType(objectReference));

// In timeline code, for example, the following
// provides a data dump of the timeline:
trace(describeType(this));
Note
The option for the SWF files in tabs preference is located under Edit (Flash)→Preferences→General→Workspace→Open test movie in tabs. ActionScript 3.0 SWF files are displayed in windows only during debugging, but may be displayed in tabs during normal testing.
Using the Debugger Workspace
In ActionScript 3.0 FLA files, debugging is possible only with documents that actually contain ActionScript. That trait may seem self-evident, but the ActionScript 2.0 Debugger panel can be displayed regardless of the presence or absence of code. If you select Debug→Debug Movie for a codeless ActionScript 3.0 file, you see an alert box warning: “You cannot debug this SWF because it does not contain ActionScript.” Can’t argue with that.
To demonstrate the debugging environment, you need a bit of code. The slightest smattering will do.
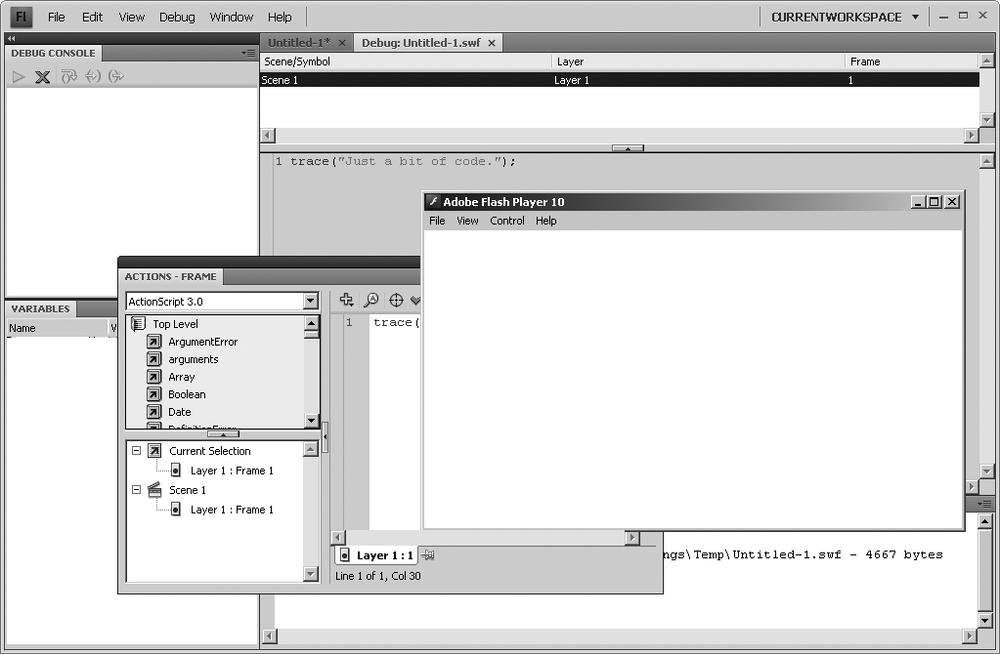
Select Debug→Debug Movie to enter the debugging workspace. Note the empty Debug Console panel and Variables panel on the left side (Figure 11-9). These panels are empty for a reason, which will be covered shortly. The SWF file itself appears in the debug version of Flash Player, just off center in the figure. The Actions panel may or may not be present, but if so, any changes you make will require a new debug session. The area just below the document tabs, near the top on the right, indicates that ActionScript has been found in Scene 1, Layer 1, Frame 1. In cases where ActionScript appears in several scenes or frames, this area of the debugging workspace displays each of those locations as a clickable line item. The largest pane, middle-right and behind the other content, shows the code for the currently selected frame or, if an AS file is open, the code in the script file whose tab is selected.
Note
This is another change from the older debugger. In the ActionScript 2.0 Debug panel, as debugging starts, the panel waits for you to choose which script(s) to examine, including external AS files, which needn’t be open when debugging starts. Any classes that are referenced with
importstatements, in keyframe or external files, are made available in a list box. In the new workspace, AS files must be opened prior to debugging if you wish to examine their contents before debugging begins.Finally, the Output panel appears at the bottom right (obscured, here) and behaves as it does during authoring.
End the debugging session by any of the following methods: close Flash Player, close the SWF file’s tab in the Flash authoring environment, or, in the Debug Console panel of the workspace, click the red
X.
Breakpoints
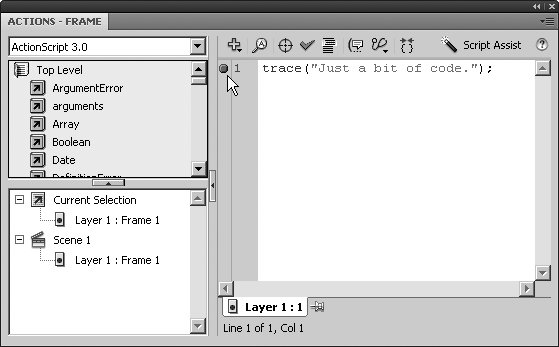
In order to get the most out of a debugging session, you need to add breakpoints. A breakpoint is a special toggle that lets you pause the execution of code inside a SWF file. Breakpoints are easy to add, both to timeline or external ActionScript. Just locate the desired line number, and then click to the left of it, in the gutter, until a red circle appears (Figure 11-10).
To remove a breakpoint, click the red circle to make it disappear. Alternatively, you can right-click (Ctrl-click) to the left of a line and select Toggle Breakpoint from the context menu, which adds or removes a red circle. To remove all breakpoints at once, select Remove Breakpoints in This File. Flash CS4 is smart enough to remember your breakpoints even after you close the authoring tool, whether they appear in timeline or class code. You may add as many breakpoints as you wish. In the next few steps, you’ll learn how they work.
Continuing with the same FLA file, use the Actions panel to add a breakpoint to the left of line 1, which contains the
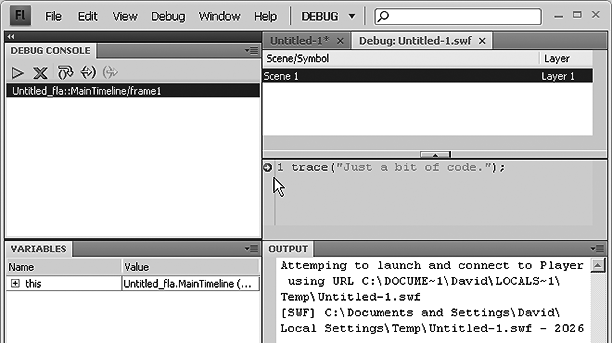
trace()function.Select Debug→Debug Movie to re-enter the debugging workspace. Note the difference among the panels: Flash Player no longer shows, because it hasn’t yet opened (the breakpoint in the first line of code has halted the movie). In addition, both the Debug Console panel and the Variables panel now display information, as seen in Figure 11-11 (click the + sign or arrow triangle inside the Variables panel to open the nodes shown).
In the upper left, the Debug Console panel displays an interesting bit of information in an area known as the call stack:
Untitled_fla::MainTimeline/frame1. The call stack shows the currently executing method, in an ordered list of all methods under execution. Here, the list displays only one item because only one method is executing. Unless you associate a FLA file with a custom document class (see Chapter 6), an automatic document class is assigned by default. This class is namedMainTimeline, and keyframe scripts are considered methods of that class, which explains theMainTimeline/frame1reference, functionally equivalent to the more familiar syntaxMainTimeline.frame1(). In complex movies, you may see many entries in the call stack, as potentially numerous methods call each other, and then remove themselves as execution completes.The Variables panel displays the properties of the object currently in scope, which is still
MainTimeline. Click the + sign or arrow triangle next to the wordthis, and you see the familiar properties of theMovieClipclass, which is the data type of the main timeline in this scenario. The values of these properties reflect the current state of the main timeline as movie clip. ThecurrentLabelsproperty, for example, is an empty array, because the main timeline hasn’t been given any frame labels. Thexandyproperties are0and0, because the main timeline is inherently positioned in the stage’s upper-left corner.Note
The expressions after some properties, for example (@120aec1), are hexadecimal representations of their addresses in memory.
In the Debug Console panel, click the green arrow button. Two things happen when you do: first, Flash Player appears; second, the Output panel displays the
trace()message, “Just a bit of code.” The buttons along the top of the Debug Console panel let you control the playback of your breakpoints (Figure 11-12).The green arrow resumes normal play of the SWF file until the next breakpoint is encountered. The red
Xcloses the current debugging session. The remaining three arrow buttons let you Step Over, Step In, and Step Out of your breakpoints.Step Over causes the debugger to move to the very next line of code and pause, as though it has encountered a breakpoint. By clicking this button repeatedly, you can step through your code line by line, keeping an eye on the Variables panel to see how values change.
Step In jumps to any function or method referenced on the current breakpoint, and then steps through the code of that function or method line by line.
Step Out moves the debugger immediately to the exit point of the current function or method, typically where the function or method returns a value.
Stepping Through a Debugging Example
Here’s a slightly more complex—but still very simple—example that demonstrates the Debug Console panel and Variables panel in action.
In a new ActionScript 3.0 FLA file, use the Oval tool to draw a small shape in the stage’s upper-left. Convert the shape to a movie clip symbol, and then use the Property inspector to give it the instance name btnOrb.
Use the Text tool to add a text field to the right of the movie clip. Use the Property inspector to make sure this text field is set to Dynamic Text, has a width and height of approximately 300 pixels, is set to Multiline, and has the instance name
tfReply.Create a new layer, and then name it
scripts. Save the FLA file as DecisionMakerDemo.fla.Create a new ActionScript file, and then save it as DecisionMaker.as.
Type the following code into the ActionScript file:
package {
    public class DecisionMaker {
        private var _replies:Array;
        public function DecisionMaker() {
            _replies = new Array("Yes", "You betcha", "No", ¬
                 "No Way", "Maybe");
        }
        public function getReply():String {
            return _replies[getRandomMessage()];
        }
        private function getRandomMessage():int {
            var count:int = _replies.length;
            var float:Number = Math.random() * count;
            var index:int = Math.ceil(float);
            return index;
        }
    }
}
This ActionScript defines a class,
DecisionMaker, that answers yes/no questions. The code contains an error that’ll be spelled out in the debugging workspace.Save DecisionMaker.as, and then return to DecisionMakerDemo.fla. In frame 1 of the
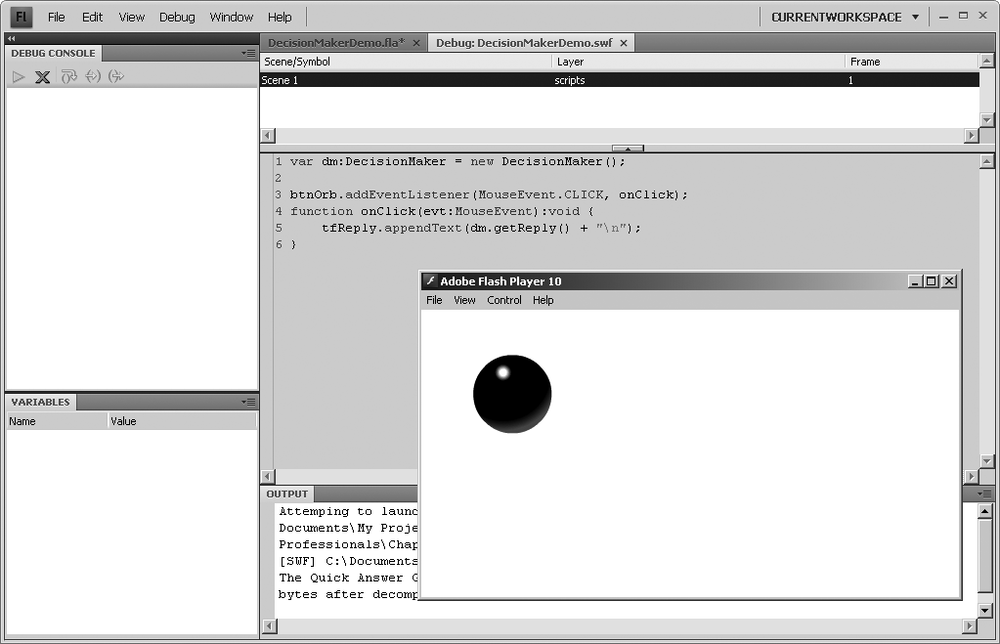
scriptslayer, type the following ActionScript:var dm:DecisionMaker = new DecisionMaker(); btnOrb.addEventListener(MouseEvent.CLICK, onClick); function onClick(evt:MouseEvent):void { tfReply.appendText(dm.getReply() + " "); }Select Control→Test Movie to test the movie.
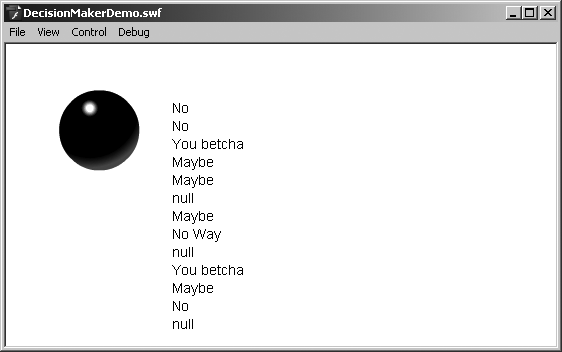
When the SWF file opens in Flash Player, click the “orb” button several times to populate the dynamic text field with replies. Occasionally, you should see “null” among the answers, as shown in Figure 11-13.
Close Flash Player.
A breakpoint would be useful, but where should it go? The “orb” button clearly works, because text does appear when the button is clicked, so the FLA file shouldn’t need a breakpoint. Return to DecisionMaker.as and add a breakpoint to line 7 (the first line of the
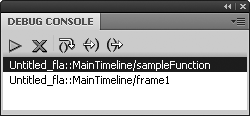
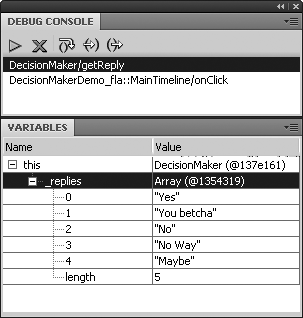
getReply()definition).Select Debug→Debug Movie to enter the debugging workspace. Click the “orb” button in Flash Player. Note that Flash stops at the breakpoint (you may have to drag Flash Player aside to see the panels you’re interested in). The call stack in the Debug Console panel now shows two methods (Figure 11-14) because the
onClick()function in the timeline has called thegetReply()method in the class file.The Variables panel now shows properties of the current object, the
DecisionMakerinstance, which features a_repliesarray with five elements,0through4, and alengthproperty of5.Click the Step Over button, and watch the small yellow arrow move from the breakpoint in line 7 to the next line. Click the Step In button to enter the
getRandomMessage()method referenced in that line. The call stack updates with a third method—the one you just entered—and the Variables panel now displays the three variables declared in thegetRandomMessage()method:count,float, andindex.Click the Step Over button again. The yellow arrow moves to line 11. Continue clicking Step Over to advance to line 12, 13, and onward. The
countvariable updates to5, thefloatvariable to a random number, and so on. You will eventually exit the function through thereturnstatement, at which point Flash Player proceeds as usual, until it encounters another breakpoint. The green arrow (Continue) button also returns Flash Player to a normal execution flow.
If nothing jumps out at you, then you may have to repeat the process a few times. This is the patient discipline of a good troubleshooter. The clues really are right in front of you.
Eventually, you see the float
variable get assigned a number greater than 4, which gets rounded up to
5 and assigned to the index variable
in line 13. The trouble with 5 in this scenario is that the _replies property, an Array instance, has a total of five elements.
Arrays start their count at zero, as shown in the Variables panel in
step 12, which displayed elements 0 through 4. There is no element 5.
Aha!
The cause of that occasional number 5 is the Math.ceil() method in line 13, which always
rounds up. Change that method to this (change in bold):
var index:int = Math.floor(float);Math.floor() always rounds
down, which ensures that index is
always a number between 0 and 4.
Debugging Remotely
Flash is a medium designed for the Web. Even with the advent of the Adobe Integrated Runtime (AIR), it’s safe to say that most Flash content is currently displayed in a browser—and browsers don’t feature the Flash debugging workspace. In spite of this inevitable gap, you can bridge published SWF files past their browser host environments in order to communicate with the Flash authoring tool. The process is called remote debugging.
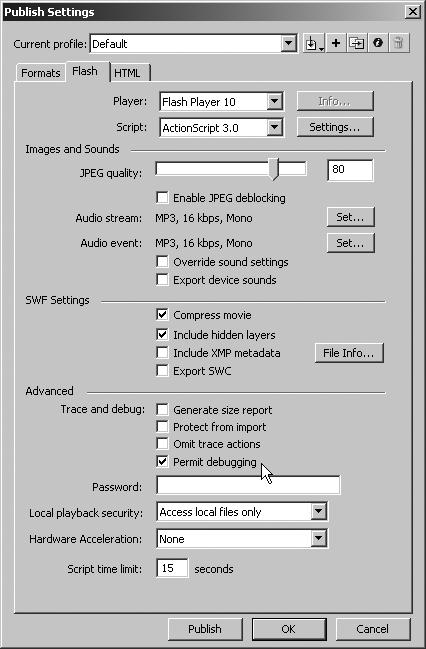
To allow Flash CS4 to remotely debug a SWF file, you need to indicate your intent by selecting the checkbox at File→Publish Settings→Flash→Permit debugging. Adding that checkmark enables a Password input field (Figure 11-15) intended to let you password protect a SWF file to ensure that only you can debug it. Unfortunately, this password field is only supported by ActionScript 2.0 documents. The Permit debugging option saves breakpoints and other debug information into the compiled SWF file, which can increase file size. In light of this, when it’s time for deployment, you may want to disable remote debugging and perhaps enable Omit trace actions in the same preferences dialog box.
With remote debugging enabled, select Debug→Begin Remote Debugging Session→ActionScript 3.0. The debugging workspace appears, and the Output panel displays the message “Waiting for Player to connect...”. At this point, launch the SWF file in a browser and then right-click (Ctrl-click) and select Debugger. You need a debug version of the Flash Player ActiveX control or plug-in for this to work, as described in the next section (you may also use the debug version of the standalone Flash Player). The SWF file connects with the authoring tool and debugging continues as before.
Logging trace() Statements from a Browser
The Flex documentation has a trick that explains how to configure
the debug version of Flash Player to log trace() statements to a local text file.
Fortunately, it works for Flash too, and it doesn’t
involve the debugging workspace. In order to make use of this technique,
you’ll have to install the debug version of Flash Player as an ActiveX
control or plug-in. You can find the necessary files within the installation
folder of Flash CS4:
Windows: C:Program FilesAdobeAdobe Flash CS4PlayersDebug
Mac: /Applications/Adobe Flash CS4/Players/Debug/
These files are also available from the Adobe website:
| http://www.adobe.com/support/flashplayer/downloads.html |
Uninstall your current version of Flash Player with the uninstall file here: http://www.adobe.com/support/flashplayer/downloads.html#uninstaller
Close all your browsers, and then launch the desired installation file. The one with “ActiveX” in the filename is for Internet Explorer; the one with “Plugin” is for other browsers in Windows, such as Firefox; the one with “UB” is for Mac. For convenience, you may want to use one browser for debugging and one for normal viewing. You know the debug version has been properly installed when you right-click (Ctrl-click) a SWF file in the relevant browser: the context menu has a new option named Debugger.
Create a new text file named mm.cfg in the following location:
Windows: C:Documents and Settings<user name>mm.cfg
Mac: /Library/Application Support/Adobe/mm.cfg
Add the following content to mm.cfg, and then save the file:
ErrorReportingEnable=1
TraceOutputFileEnable=1
MaxWarnings=0
If you’re on a Windows machine, you’ll have to perform the following additional steps:
On the Desktop, right-click on My Computer, and then, from the context menu, select Properties.
In the System Properties dialog box, select the Advanced tab, and then click the Environment Variables button.
In the User variables area (not the System variables area), click the New button, add the following new variable, and then click OK:
Variable name: HOMEDRIVE
Variable value: C:
Click the New button again, add the following new variable, and then click OK:
Variable name: HOMEPATH
Variable value: C:Documents and Settings<user name>
Click OK until the remaining dialog boxes are closed.
Restart your computer.
At this point, when you view a SWF file in a browser that has the
debug version of Flash Player installed, any trace() statements in that SWF file are
written to a text file named flashlog.txt. This text file is cleared and
restarted each time you view the SWF file in a new browser session.
The location of flashlog.txt used to be configurable, but
this changed with version 9.0.28.0 of Flash Player. The current location is:
Windows: C:Documents and Settings<user name>Application DataMacromediaFlash PlayerLogsflashlog.txt
Mac: <user name>:Library:Preferences:Macromedia:Flash Player: Logs:flashlog.txt
Note
Alessandro Crugnola wrote a Firefox extension called FlashTracer that reads from flashlog.txt. This free extension is available at http://www.sephiroth.it/firefox/.