This section covers IDE-related tips on debugging, including Tools Options settings and tool windows found only while debugging. This section also explores how to debug multiple projects.
On a given line of code where you want to log the value of a variable, you can use the old-fashioned way of doing a Console.WriteLine() or a PrintF(). But in Visual Studio 2008, there’s a new feature called Tracepoints that allows you to print out these debug statements without modifying your code. Hence, there’s no having to go back and delete code prior to a check-in or unwanted debugging info getting released into deployment.
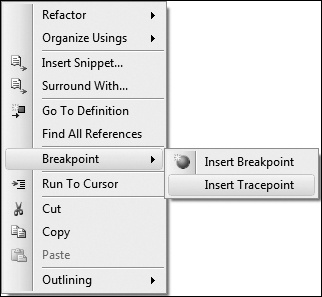
Right-click in the editor wherever you want to insert a tracepoint, select Breakpoint, and then select Insert Tracepoint.
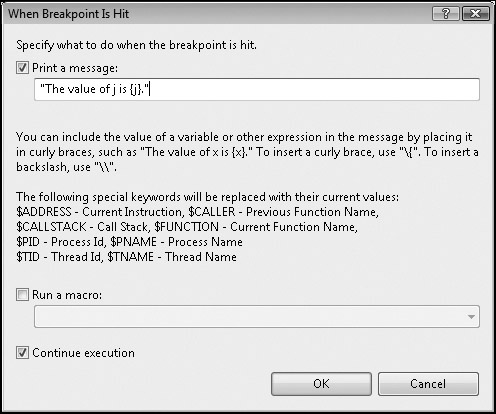
This brings up the tracepoint dialog box, which gives you some helpful default settings. But for this example, the really helpful default is in the descriptive text for logging the contents of a variable.
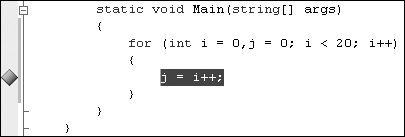
You’ll notice that the editor shows a diamond instead of a circle.
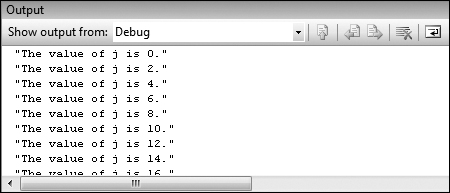
And the tracepoints are logged in the Output window’s Debug pane.
Where would debugging be without breakpoints? This section covers the basics of breakpoints, including the various ways to set breakpoints and how to set conditions on them.
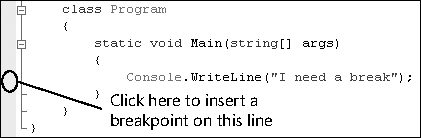
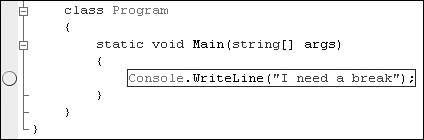
You can set a breakpoint on any applicable line by clicking the indicator margin, as illustrated here.
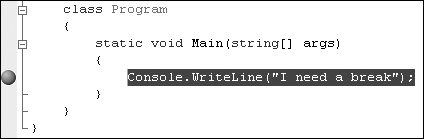
Clicking here inserts the breakpoint, as shown next.
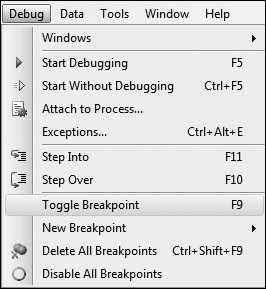
The command Debug.ToggleBreakpoint sets (or deletes) the breakpoint on the current line, in case you don’t want to take your hands off the keyboard.
I didn’t see this command under the Debug menu. So, in case you want to use the keyboard to enable or disable a breakpoint, you can press Ctrl+F9, which is bound to the command Debug.EnabledBreakpoint. Note that you won’t find a Debug.DisableBreakpoint because this is handled by the enabled command.
A disabled breakpoint still gets saved in your Breakpoints window, even though it will not get hit during debugging.
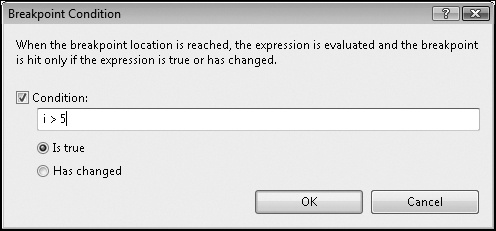
When you want to break only under certain conditions, you can right-click a breakpoint red circle (or go to the Breakpoints window and bring up the context menu on a given breakpoint) and select Condition to bring up the dialog box for conditional breakpoints.

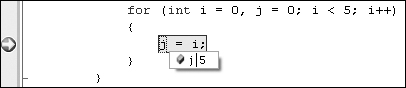
You’re given two options: break only when the specified expression is true, or break only when the specified value has changed. For this example, because I’m in a for loop, I’ll break when the value of i is greater than 5.
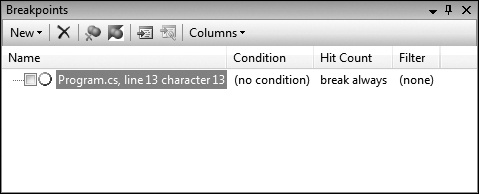
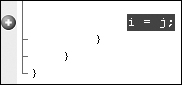
You’ll notice that the breakpoint circle now has a red plus on it to indicate it is conditional.
Conditional breakpoints are for breaking at the expression level, when a particular condition is true, like x = 5. But what if you have multiple instances of the same app running? How do you set to break the instance you want?
The answer is breakpoint filters.
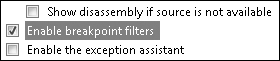
Go to Tools–Options–Debugging–General, and you’ll see the option Enable Breakpoint Filters.
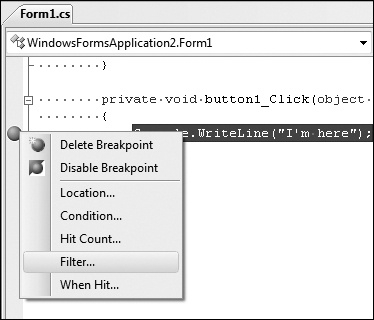
Set a breakpoint and right-click to bring up the context menu.
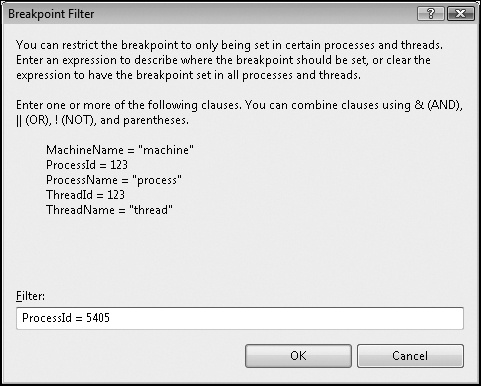
In the Breakpoint Filter dialog box, you can specify when to break. The next image shows breaking a process by its process ID.
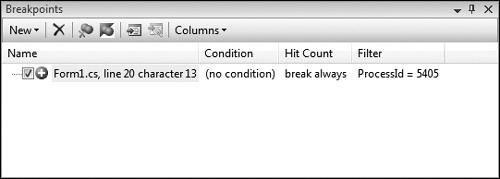
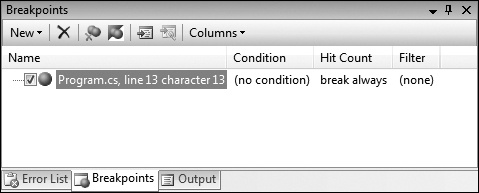
And you can verify the breakpoint filter in the Breakpoints window under the Filter column.
In case you want to set a breakpoint at a given function, and not at the current line, you don’t have to search for the function name and then hit F9. Instead, you can press Ctrl+B to run the Break At Function command.
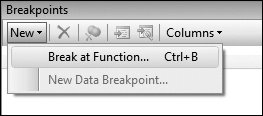
This command brings up the New Breakpoint window.
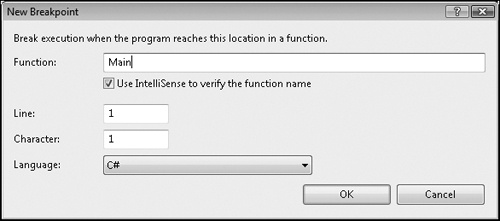
Here you can type the name of the function you want to set a new breakpoint at.
Under Debug–Windows, you’ll find the Breakpoints window.
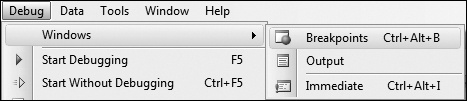
The keyboard shortcut is Ctrl+Alt+B, which is bound to the command Debug.Breakpoints.
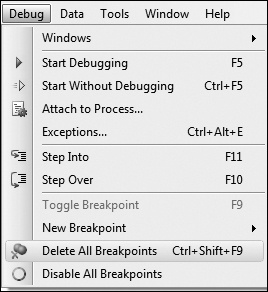
You can press Ctrl+Shift+F9, bound to Debug.DeleteAllBreakpoints, to delete all the breakpoints you’ve created in your solution. The command is found under the Debug menu.
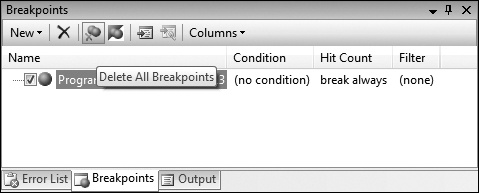
The option is also found on the Breakpoints window in the toolbar.
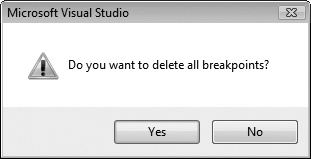
The previous tip talked about how to delete all breakpoints. If you are following along at home, you have encountered the warning message that appears when you attempt to do this.
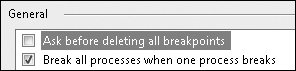
If you find it annoying, you can disable it by going to Tools–Options–Debugging–General and unchecking the Ask Before Deleting All Breakpoints option.
DataTips are very similar to the Watch window. (See the Watch window tips that appear later in the chapter.) However, unlike the Watch window, where you have to navigate to a tool window, DataTips allow you to keep your focus in the editor.
Whenever you are debugging and want to change the contents of a variable, you can drag the variable into the Watch window. But you can also use DataTips to change the variable without leaving the editor.
Hover over a variable when you have hit a breakpoint. You’ll notice a glorified ToolTip appear. This is actually a DataTip. You can click the value of the variable to go into an edit mode. Change the contents of the variable, and press Enter to commit.
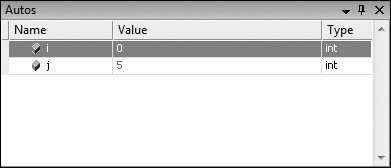
If you have the Autos window open, you’ll notice the color change, implying the commit was successful.
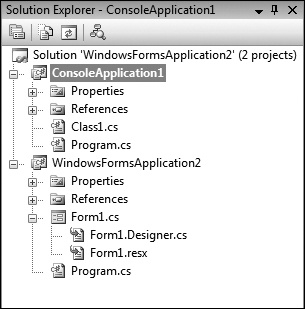
If you are using only one project per solution, this section may not have too much significance for you. But if you have multiple projects, you can select which ones you want started under the debugger.
There are two ways you can select a project as the startup project when you have more than one project in your solution.
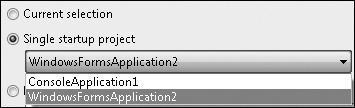
The first way is via the Solution Property pages. Right-click the solution node in the Solution Explorer, and under Common Properties–Startup Project, you can choose Single Startup Project. Now you can select which project you want.
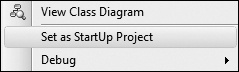
The second way is to right-click the project and select the Set As StartUp Project command from the context menu.
The startup project appears in bold in the Solution Explorer.
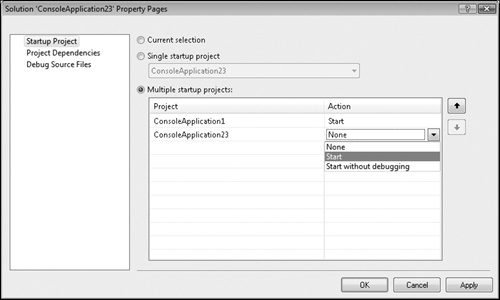
Right-click the solution in the Solution Explorer, and select Properties. Go to the Common Properties–Startup Project page. (It’s the first page in the dialog box.)
You’ll see three option buttons:
Current Selection. This option selects whichever project had the inactive selection (that is, whichever project was selected previously) when you went to the Solution Property Pages.
Single Startup Project. Usually this is the first project you had in the solution, or it’s the project that you manually set as the startup project.
Multiple Startup Projects. And there was great joy! When this option is enabled, you can pick and choose which projects to start (and make sure you choose Start and not Start Without Debugging).
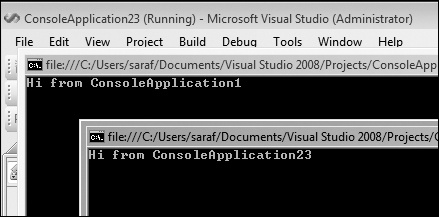
And using the preceding example, when I hit F5, I get the following.
In Tools–Options–Debugging–General, there’s the option Break All Processes When One Process Breaks.
Let’s say you are debugging multiple projects, and you want to configure what happens when one process breaks.
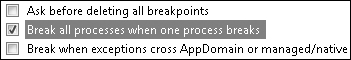
For example, let’s say I have two console applications running in an infinite loop. On the second console application, I break the process. If I have checked the Break All Processes When One Process Breaks check box, the first console application will break also.
And, of course, you can uncheck this option to have the first console application keep going.
This section explores the various tool windows you can use while compiling and debugging your code, including the Error List view, Watch window, and Immediate Window.
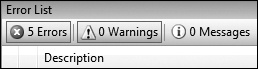
The Error List does exactly as its name suggests. It lists all the errors in your solution, alongside any warnings and messages.
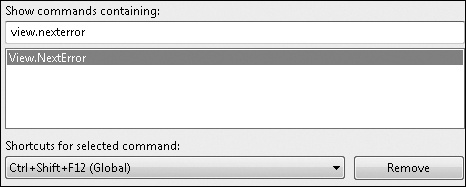
The keyboard binding is Ctrl+Shift+F12, and the command is View.NextError. I’m a little surprised that there isn’t a default keyboard shortcut for View.PreviousError. But you can always add one yourself.
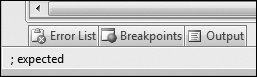
And, of course, the status bar tries to be helpful by showing you the error you have navigated to. =)
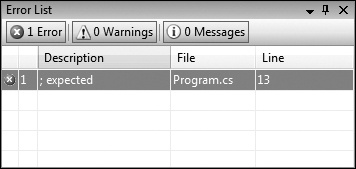
For example, here’s the default with everything enabled.
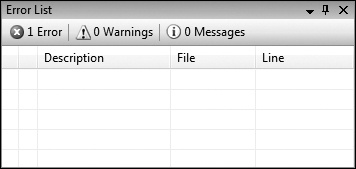
And now, here’s the Error List with nothing enabled, for dramatic effect.
If you right-click an error in the Error List view, you’ll see a context menu pop up with the Show Error Help option.
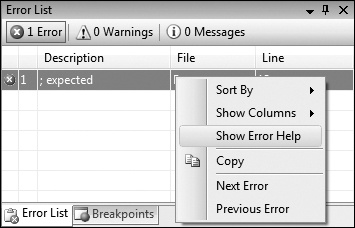
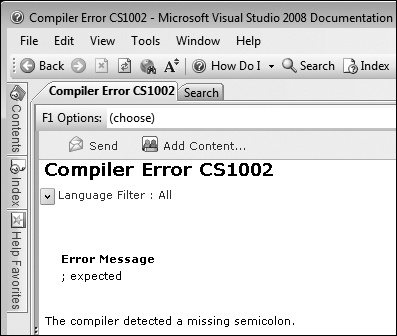
Clicking this command launches the external documentation viewer, also known as dexplorer in some social circles, to that specific error.
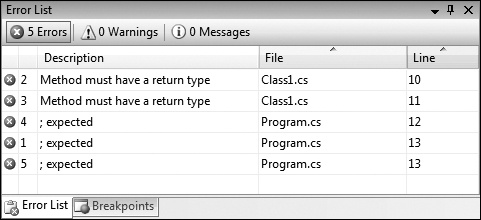
Both the Error List and the Task List have support for multicolumn sorting, such as secondary sort and tertiary sort.
For example, suppose you want to sort all tasks (or errors) by file first and then by line number so that you can go through each file in the order in which the tasks (or errors) appear.
To do a secondary sort, follow these steps:
Click the column that you want to have as the primary sort (such as File).
Shift+Click on the column you want to have as a secondary sort (such as Line number).
Rinse and repeat for other columns.
For the Error List, you can see how things are sorted first by File and then by Line number.
I’m excited about this tip. Not because it is tip number 200—this was purely coincidental—but because I accidentally found it while browsing the commands in the Tools–Options–Environment–Keyboard page that contained the word Error.
Go to Tools–Options–Environment–Keyboard, and search for Errors. You’ll notice that this odd Errors command will stare back at you.
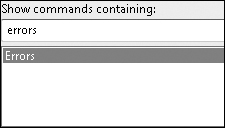
I say this "odd" command because usually Visual Studio commands have the canonical name format of <word>.<word>. This obviously caught my eye, so I contacted the developer for confirmation.
These commands toggle the Errors, Warnings, and Messages shown on the Error List, so you can bind them to keyboard shortcuts.
For example, you could bind the following commands to the keyboard shortcuts shown:
Errors: Ctrl+Alt+Shift+E
Warnings: Ctrl+Alt+Shift+W
Messages: Ctrl+Alt+Shift+M
Now, instead of clicking the buttons, you can just use the keyboard shortcut. Pretty cool.
Usually the Error List is shown (whether it is autohiding or just closed) whenever a build fails with errors. If you like using just the Output window (because you can double-click an error message in the Output window and jump to that line), here’s how to prevent the Error List from appearing.
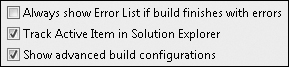
Under Tools–Options–Projects And Solutions–General, there’s the Always Show Error List If Build Finishes With Errors check box. Uncheck this option to prevent the Error List from appearing after a failed build.
The Watch window (or Watch windows, because you can have up to four of them) not only provides a way for you to keep track of your variables and their contents, it also allows you to make changes to the contents of your variables.
Have you ever been debugging some code and wanted to quickly change a variable’s value without having to stop debugging? Here’s what to do.
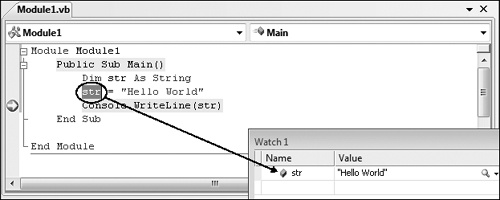
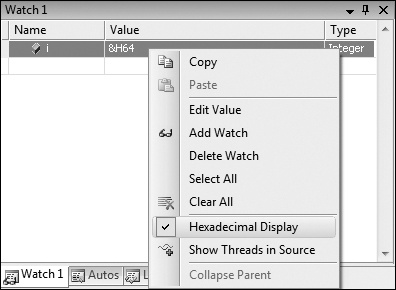
Add the value to the Watch window. You can select the variable and drag it into the Watch window as shown here.
Then double-click the variable’s contents within the Watch window, and you’ll be able to edit.
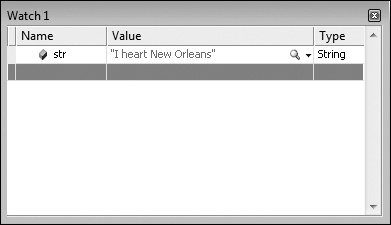
Either click outside this field or press Enter to commit the change, and the variable will contain the new contents.
If you need to clear the Watch window’s variable contents, just hit Delete on that row.
When you want to do more than just edit the value of a variable, you can rewrite entire functions or create new ones in the Immediate Window.
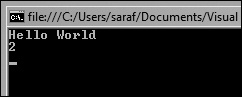
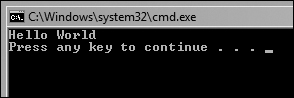
Let’s start off with a very simple example. Let’s say that you have the basic "Hello World" console app, but you want to print out the result of some calculation. Notice how the console app just has "Hello World."
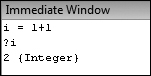
If I put a breakpoint at the very end of this simple console app, I can bring up the Immediate Window via Debug–Windows–Immediate and do whatever I need. Let’s say I needed to use the Immediate Window as a glorified calculator. I can figure out the value of 1 + 1, as shown in this Visual Basic console app.
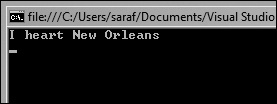
Since we’re in a console application, we can even have the value of i printed to the console window via the Immediate Window.
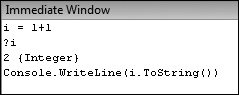
And now the value of 2 appears in the console window.