
Project management
4.1 What is project management?
This section introduces the topic of project management and the importance of the activity. It briefly describes the initial stages of a project such as the setting of objectives, the team selection and the feasibility study. The section concludes with the start of the planning operation where the activities are quantified and dependencies derived.
As discussed in Chapter 1, organizations exist to provide a product or a service and that is where their main day-to-day effort is directed. However, not all the activities within the organization are concerned with these repetitive operational issues. Some activities are part of a one-off effort directed towards a major change within the organization – these are termed projects. They have to be carried out alongside the normal activities with minimum disruption.
Project management deals with the organization and control of the activities involved in planning and carrying out these projects. Projects come in all sizes and shapes from relatively short, one-man affairs to large multi-million pound projects involving hundreds of people and even several organizations.
Examples of projects vary from highly technical ones, e.g. the design of a new aircraft, to organizational ones such as discussed in Chapter 2. Although each project tends to be unique from previous projects, there are sufficient similarities in the approach needed, and the problems encountered, that we can examine and learn from.
A major project goes through several stages:
• Concept: Here the initial need for the project evolves. This stage identifies an opportunity of some importance to the organization to justify the diversion of resources from the normal day-to-day activities.
• Feasibility study: This is where the project gets firmed up, or discarded. An initial examination is needed to check the technical feasibility, the time and cost involved and the resources required. Many companies fail to invest sufficient effort here. A project manager is often selected at this stage, although this may be left until the next stage.
• Project specification and initiation: This is where the project starts to fill out with clear goals and constraints laid out in the terms of reference. The project manager and the initial team are confirmed. The team could change through the project stages, but the project manager should stay with it.
• Schedule: The detailed planning now takes place. The activities are developed showing their sequencing and the time and resources required. The latter need checking out for availability constraints at this stage. This finalizes in the detailed project plan.
• Application: This is the ‘doing’ part of the project where the plan gets put into operation.
• Completion: The penultimate stage is when the project is completed and handed over to the operational personnel, who may be the project team themselves.
• Evaluation: This final stage is too often not carried out properly. It is the stage where lessons for future projects are gathered and the life plan for the project is completed.
At each of these stages there should be considerable discussion and negotiation with senior staff and other stakeholders to ensure that the whole organization understands the project and agrees with the direction it is taking. As shown in Figure 4.1.1, there are key points during the process when a formal commitment to proceed is required from senior management.
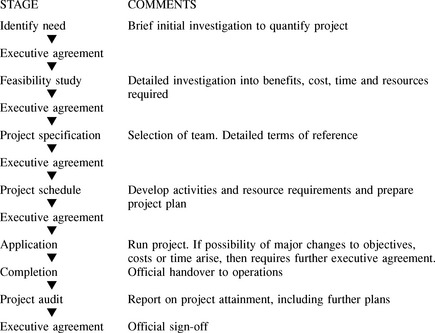
Figure 4.1.1 Flow chart of the stages of a major project. (Note the need for executive agreement at key stages)
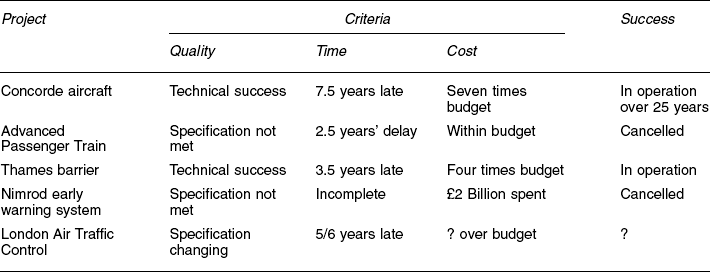
Unfortunately all too often a project does not achieve full success and is judged to be a partial, or complete, failure. Projects can be late, fail to be within their budget, fail to meet all their aims or a combination of these. Some of these failures are due to technical problems but the main reason for failure is the human factor – the least of which is overconfidence in the organization’s technical or managerial ability which leads to little input at the initial stages. Table 4.1.1 demonstrates some major projects of recent years, and their outcome.
Because projects tend to be a unique one-off task, many of the activities or technologies involved are unfamiliar to the people involved. This leads to a degree of uncertainty in them. This uncertainty shows up in various matters:
• Technological uncertainty: This form of uncertainty is present in most product and process development – especially where new technologies are blended with existing technologies.
• Scheduling uncertainty: When people are doing something new, they will be unable to predict accurately how long it will take them, or others, to complete their tasks. There may even be doubts about their release from other ongoing tasks.
• Cost uncertainty: The uncertainty in the time factor means it is difficult to anticipate associated spending. In addition the full cost of equipment suffers from a similar lack of identification.
• Organizational/Political: This is where many projects get into real difficulties. Part of this is the struggle for scarce resources to meet personal targets and part is the rearward action of the potential losers in any change.
• Staff turnover: The longer a project runs the more chance that key staff involved will change. This leads to loss of time as the replacements come up to speed and develop the required knowledge.
• Environment: New legislation and competitors’ actions may affect the marketplace.
Any project plan therefore must anticipate these problems and seek to eliminate, or minimize, them by careful contingency planning and management to reduce the risks involved.
Project initiation
A project is started with the identification of a need for a change. This need can arise from many reasons some of which will be proactive, i.e. an attempt to evolve, or use, a new technology, and others will be in reaction to events in the organization’s marketplace. The needs can come from a variety of sources, such as a SWOT analysis (see page 305). The following give an indication of some project aims:
• Installing a new computer system.
• Selecting and installing a new process.
• Retraining in new technologies or techniques.
• Refocusing managerial priorities.
Whatever the need identified, for it to be accepted as a project it must primarily contribute to the business objectives of the organization, and be formally recognized by senior management.
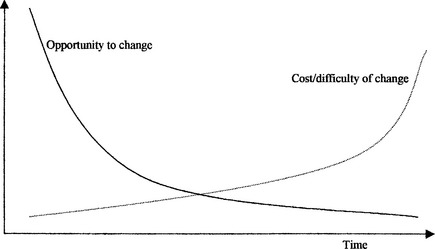
At this stage the full solution will probably not be known. In fact too often an intuitive jump to a solution is made without fully examining the implications or the alternatives. Instant answers and quick commitments may look good, but quite often they contribute to the lack of success as organizations become committed to one solution. It then becomes emotionally difficult, and costly, to change later as shown in Figure 4.1.2.
The project team
Early on in the project life, a team must start to be formed to carry out the detailed planning and control activities.
The first appointee is not the project leader, but the project sponsor or champion. This is a member of senior management who is responsible for the progress and success of the project. This gives the project status and top level access and commitment. The sponsor may delegate most of the planning and control of the project to a team, but must retain a full comprehensive involvement in the progress.
The next decision is how to manage the project. Depending on its size and complexity, it may be manageable within existing structures with one manager, or technical expert, in control. It may require a team which could be a task force made up of managers and others involved on a part-time basis, or it may require a full-time focused team.
The important thing is the composition of skills, attitudes and commitment required to fully understand and manage all the different aspects of the project. These cannot all be learned during the project so the team needs to bring most of these with them. The team therefore needs both technical knowledge and the ability to carry out the following management tasks:
The key person is the project manager, who is usually full time on the project from start to finish, although other members of the team may change. This individual could be someone from the area most involved in the project, but choice may be limited. The person requires a broad range of experience, ability and organizational standing which may not be available, therefore the appointment of someone from outside the immediate area often has to be made.
The team itself needs a blend of personalities as well as skills and experience. They must be able to work together openly. This does not mean submerging into one homogeneous group but a willingness to openly respect and discuss points of difference and come to a group consensus which is acceptable to everyone. To aid this blending, the group size must be limited and made up of people without too wide a status within the organization.
Terms of reference
This is the important authority to proceed document. It sets the objectives, the scope and constraints of the project. This can be brief initially, i.e. prior to the feasibility study, but must be firmed up before the main project goes ahead. Areas needing detailing are:
• Authority and sponsorship – identification of project sponsor.
– Alignment with business objectives.
– Measurable in quantity, quality, time, cost and end product.
• Scope – departments, people, products, processes, etc.
• Budget and timings of cash flows.
• Timetable showing phases and involvement.
This requires firm agreement at top level.
The feasibility study
A comprehensive feasibility study is not just directed to answering the question ‘Can it be done?’ It is better that this stage be carried out by the project team, although some organizations use consultants for initial confidentiality. Whoever does it, they must address all the questions surrounding the issue such as:
• How technically feasible are the alternatives?
• What is involved in doing it?
• Do we have the internal skill and experience to carry it out?
• Who needs to be involved during the process?
• What are the potential problems that may arise?
• What training will be required?
• What disruptions will it cause?
• Areas of potential controversy and disagreement?
• What will be the effect on people directly, and indirectly, involved?
• What is needed in resources?
• What are the dependency chains?
• Are there existing benchmarks available to use to set targets?
For these questions to be fully answered will take a fair degree of investigation to gather facts and opinions. This may mean visiting other establishments and suppliers, use of consultants, etc. During this investigation there will have to be considerable discussion with those directly, and indirectly, affected to determine their support, or resistance.
There will be resistance to spending a considerable amount of time and money at this stage and impatience to get on with the job. Although it is important to be cost effective and efficient in carrying out the feasibility study, stinting it too severely can easily lead to problems later on in the main project itself.
The final stage of the feasibility study should be the selection from the available alternatives.
Selection process
The final point of the feasibility study is where the alternatives are evaluated, compared and one selected as the preferred option.
Each of the alternatives can be compared under as many aspects as deemed desirable, perhaps by ranking them using the paired comparison technique (see Chapter 2) to reduce them to the one or two main contenders. These remaining contenders then need to be put through the organization’s economic appraisal system (see Chapter 4) to determine their economic standing.
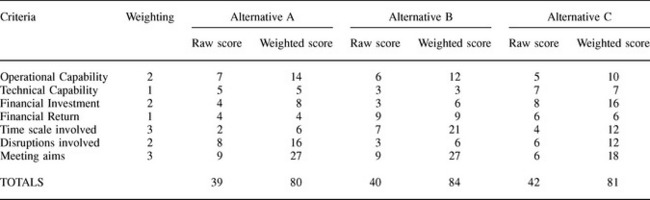
Another way of selecting can be by a similar process to that used in design, i.e. by ranking each alternative’s match to a set of key criteria. This can be carried out by producing a matrix, in which each alternative is scored on a scale from a relative value, or cost, viewpoint, i.e. a low of one up to a high of ten under a range of significance criteria. Depending on the circumstances, one set of criteria may be:
• Operational capability: This judges the degree of internal skill and experience available to operate and maintain an alternative. A score of one means that there is very little internal ability and a score of ten means that internal abilities are more than sufficient.
• Technical capability: This is looking at the match between the project team’s technical competence to design and evaluate an alternative. It may show that the project will need outside support of consultants.
• Financial investment: The full cost-benefit analysis will show up the total amount of investment required. Here a very high capital investment scores just one – with little or no investment scoring ten.
• Financial return: The time to payback and total return can be judged here to determine future financial benefits.
• Time scale: The ability to complete the project within a certain time frame which can be set by the organization. The longer the timescale, the lower the points gained. It is often easier and better to have several limited connected projects than to try and have them rolled into one big project.
• Disruptions to present activities: This judges the disruptions to present activities that an alternative will involve.
• Ability of the alternative to meet aims such as quality, delivery speed, etc.
All the criteria need not carry the same weighting. A survey of top management may decide at a particular time that the criteria may be weighted as follows, with three being the most important aspects in present circumstances:
At another time they may increase the weighting of the financial investment to 3 because of plenty of available cash funds, or reduce it to 1 where investment needs to be curtailed due to lack of funds.
For the scoring we can produce a decision grid as in Figure 4.1.3. The columns show the total score against each alternative under both weighted and non-weighted conditions. From these, the alternative with the highest weighted score would be selected for first choice – in this case project B.
The result of the feasibility study and the basis of selecting a particular alternative would be presented to the management committee for approval before proceeding to the detailed planning stage. It is at this stage that the main direction and cost of the project is decided. It will be difficult, but not impossible to change these later.
Initial project planning
As with any job, the key to a successful completion lies in the preparatory work carried out beforehand, in this case the detail project plan. Planning projects involves several stages:
• Logical analysis of the many different activities to be done.
• Estimating the resources and time required for each activity.
• Calculating the costs involved.
• Setting these activities in a sequence of dependency.
• Preparing a cash flow requirement.
• Setting milestones to denote important stage completion.
• Identifying potential problems and making contingency plans.
Quantifying the activities
Use people familiar with the work involved to gradually break down the main activities into smaller component activities at lower levels. Initially this should stop at a department or section level. The more detailed breakdown can be done by the managers within these areas.
The main characteristics of an activity at this level should be that it has a clear start and end point which can be measured by an end product. Once this is established, then the activity can be quantified in cost, effort, resources and time. This should be under the clear responsibility of one person, not necessarily the one who will be actually carrying it out.
Because of the uncertainty that is often involved at the planning stage, there may be difficulty in arriving at an estimate of time and cost. What is required is a reasonable, honest figure which is based on using committed, skilled staff. Depending on personalities involved and the culture of the organizations there will be a tendency to over- or underestimate the task needs:
• Overestimation occurs when there is a blame culture and people are wary of committing themselves when the consequences of doing so may rebound on them, this leads to extra padding being inserted as a safety margin. Overestimation may also be based on concerns about the complexity of the task, or may be based on overengineering.
• Underestimation occurs when people are overconfident and take risks or make false assumptions about what is required to be done, perhaps because they do not realize the complexity, or what is required of them.
Both need guarding against because of the overall picture.
Dependency
Alongside the breakdown of the work involved into smaller activities, we need to determine the sequence in which these must be carried out.
This is arrived at by looking at what needs to be complete before each activity can start. Sometimes this will be information but at other times there will need to be a physical entity available such as an object or perhaps an area being made available or prepared.
When this condition is arrived at in another activity, then we say there is dependency on that activity. The point need not be at the end of an activity, but needs to be clearly identified.
Where there is no dependency, it may be possible to carry out several activities at the same time, i.e. in parallel.
However, when there is dependency this controls the sequence that the activities have to be scheduled. The normal type of dependency is that of waiting until the end of the preceding activity, but the start signal can arise at any point – even at the beginning where some degree of overlap can take place. In a few cases, the dependency can come from the ending of two separate activities, i.e. we may need them both to be completed before we can start the next activity.
Once we have all the information about the activities, we can then schedule them together to make up the overall project plan, and then get on with the project.
4.1.1 Problems
(1) Think of all the different types of projects you have been involved in – what made you think of them as a project?
(2) Why do you think the terms of reference for a project require top level agreement?
(3) Under what circumstances do you think that financial considerations will play a minor part in deciding a project has top priority?
(4) How long would you say it takes to travel from your home to your place of work or study?
(5) Can you think of an activity in your daily life that can start only after another activity has started?
4.2 Project scheduling – the critical path
This section looks in detail at scheduling activities within a project to find project completion dates by using dependencies between activities and establishing float (spare) times associated with these activities. This is examined first in small projects and then the effect of combining these small projects into one larger project is investigated. Methods of changing activities and resource allocation to alter the overall completion times are also addressed. Network diagrams and Gantt charts are introduced using Microsoft™ Project to provide the illustrations.
Assuming that all the activities and dependencies have been correctly identified, we now need to complete a schedule showing when each activity should start (and finish), the use of resources especially when money needs to be made available and of course when the project will be complete. This will identify those activities which must be completed on time and those where some spare time exists.
There are dozens of different software packages available to assist project scheduling. In this textbook Microsoft™ Project is used for illustrating software usage. This is merely for convenience – if you wish to purchase a suitable package, you are recommended to conduct your own investigation to meet your particular requirements. A good place to start is the annual Source Book published by Project Manager Today.
To explain the stages in scheduling we will use three interconnected projects:
• The construction of a new building.
• The design and prototyping of a new product.
• Installing the manufacturing process for the new product in the new building.
Each will be used to explain a principal technique and then they will be amalgamated to show the problem in scheduling multi-projects.
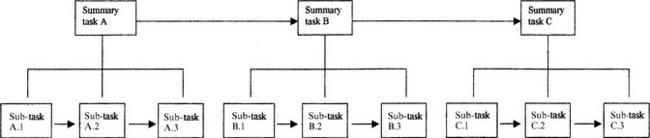
When scheduling projects we need to have a manageable number of activities, say a maximum of twenty. As most projects will consist of a large number of small activities, it is best to group these logically into higher level groups as in Figure 4.2.1. The lower level activities can be scheduled interdependently within Microsoft™ Project. In this software we refer to the upper level activities as summary tasks and the lower level activities as sub-tasks.
Project 1 – the new building: Gantt charts and cash flow
The higher level activities involved in this project are shown in Table 4.2.1. The times and costs are just for demonstration purposes. For the present, let us ignore the resources required, assume that the durations and costs are fixed and that all preceding activities must be complete before the following activities can start.
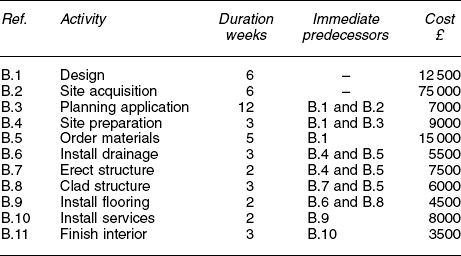
If we needed to know when the building will be completed, we do not just add up the weeks required for each activity – this would come to 46 weeks. Some activities may be able to be undertaken simultaneously and reduce the overall time needed.
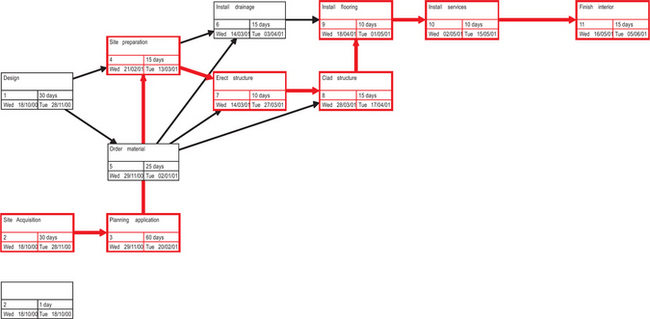
We need to calculate the dependency effect. First we shall manually work this out and then produce a graphic illustration of the plan. The first stage is to draw a network diagram as in Figure 4.2.2. This shows the linkage between activities which eases preparation of the schedule.
We could try to schedule in a longhand layout working through each activity in turn, but it is easier to carry it out using a matrix as in Table 4.2.2. The column headings we are initially concerned with are:
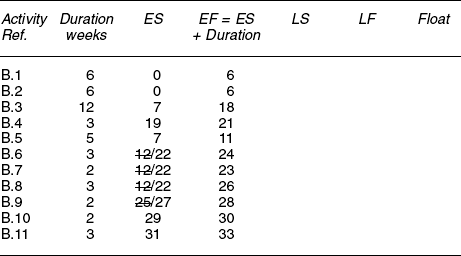
We start with identifying which activities can start at any time, i.e. they have no predecessors. In this case this only applies to activities B.1 and B.2, the design and site acquisition activities, and they therefore have an ES of zero. We then proceed to start any follow-on activities when its predecessor ends, i.e. the week following their EF.
Where there is more than one predecessor, we take the latest EF value by which all the predecessors finish. This is shown in the matrix by scoring out the ES values which are not selected.
By looking for the highest EF time we can see how long the project will take to complete. In this case it is the EF for activity B.11, i.e. 33 weeks, assuming all the activities are completed on time. However, do we need to start every activity at its earliest start time? The way to determine this is to complete the next two columns in the matrix as in Table 4.2.3. These are:
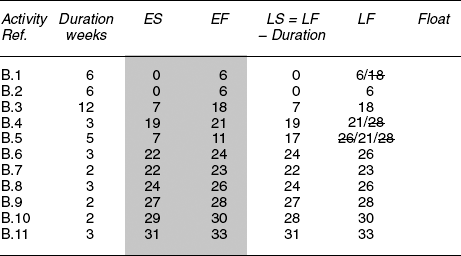
LF = Latest Finish, i.e. the latest time an activity can finish to prevent extending the overall project completion time
This time we take the final activity, i.e. B.11, and put its EF value into its LF box and then work backwards to see when all predecessors have to be completed by. This is found by transferring the LS value less one week into all immediate predecessors’ LF boxes. If an activity has no follow-on activities, it would share the LF time with the final activity.
Where an activity is directly preceded by more than one activity, we use the earliest LS value by which all the follow-on activities start. This is shown in the matrix by scoring out the LF values which are not selected.
The float, or slack as it is also called, value is the time that an activity’s EF time can be delayed without affecting the end date of the project. It is shown in Table 4.2.4 and calculated from:
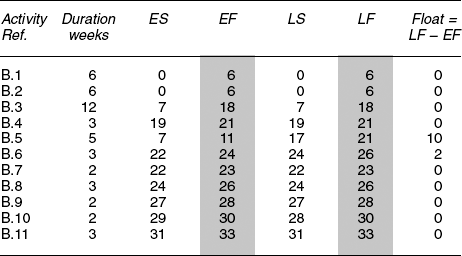
The only activities with a float are B.5 and B.6. This means that activity B.5 could either start up to ten weeks after its ES time, or take ten weeks longer than estimated, and not affect the overall project time. Similarly activity B.6 has two weeks’ float available.
The other activities are critical to the project finishing in 33 weeks, i.e. they must be started at their ES time and take no longer than their estimated duration. These lie along what is termed the critical path, i.e. the path along which all activities must adhere to their expected time so that the project is completed in the minimum possible time. This critical path is indicated as a heavy line in the network diagram in Figure 4.2.2. Any activity that takes longer than its estimated duration plus any associated float will increase the overall project completion time.
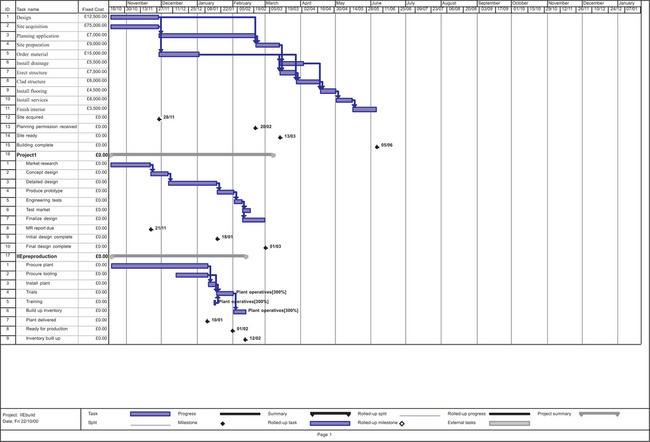
To ease communication of the sequence in which the tasks require completion, tasks can be portrayed in a Gantt, or bar, chart as shown in Figure 4.2.3. The Gantt chart shows the activities on a timescale and therefore is easy to understand. The linkages and floats also stand out. This chart shows the ES values of each activity and certain key events, e.g. planning permission received, have been selected as milestones, i.e. important points during the project’s life.
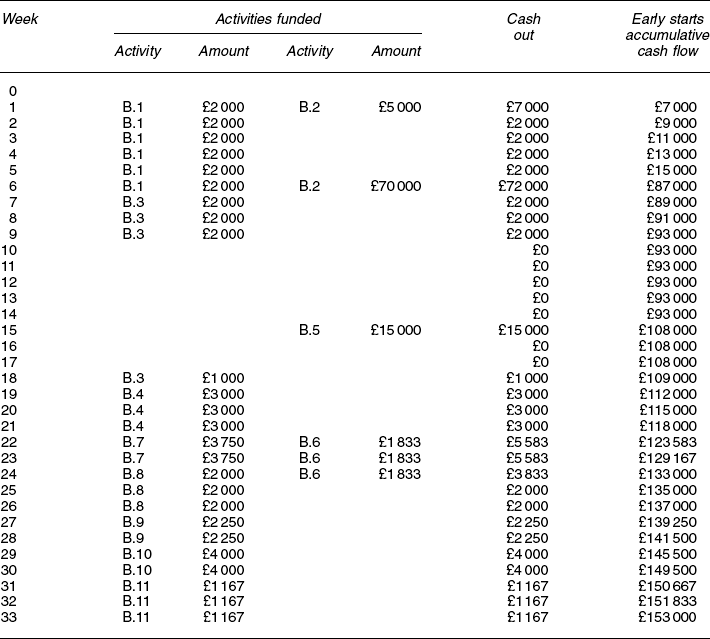
Having scheduled the activities, we now need a schedule of cash flow so that the accounting department can ensure money is available when required. To do this, we need to determine the cash flow for each activity as in Table 4.2.5.
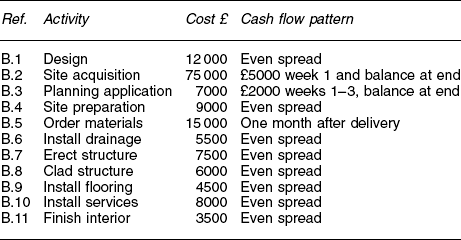
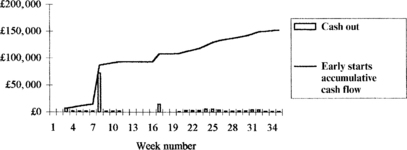
Using this and the information on the activity’s ES and EF times from Table 4.2.3, we can complete a spreadsheet showing the cash outflow on each week, as in Table 4.2.6. From this we can show a graph of weekly and accumulated cash flow as in Figure 4.2.4.
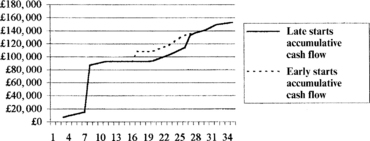
However, if we go back to Table 4.2.4, we see that activities B.5 and B.6 have float associated with them. If we delay these two activities’ start dates to the LS times, we also delay when their costs need to be incurred. This delay can earn interest on that money for this time. The difference in cash flow is shown in Figure 4.2.5.
Project 2 – new product design: variable estimates
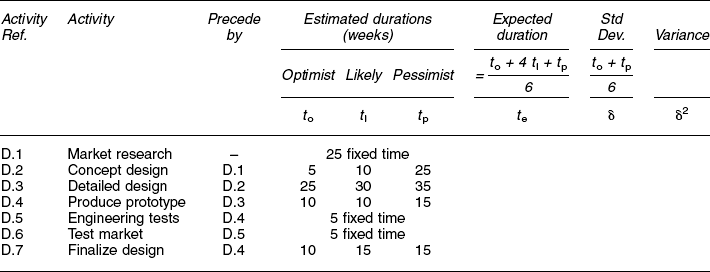
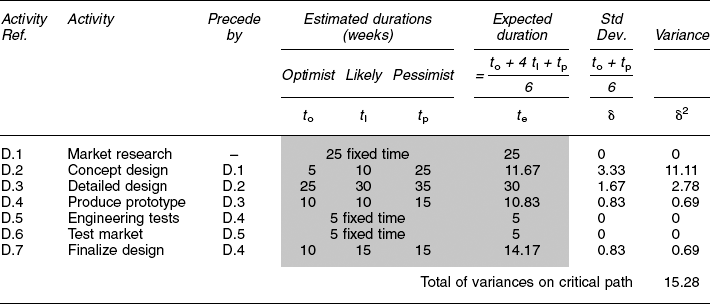
In the previous project, we assumed that all the activity durations were fixed. However, in practice, we do not always know exactly in advance how long an activity will take – especially if we have not done that exact task before. What we often have to do in that situation is seek a range of possible estimates and use these to calculate an expected duration.
Let us assume the second project is such a case and we have three estimates for the durations for some activities as shown in Table 4.2.7. The others still have a fixed estimate for their duration. The three estimated durations are based on:
• Optimist: Everything goes exactly right – no problems.
Where we have a fixed duration activity, this will become the expected duration. However, to calculate an expected duration for the variable activities, we apply the formula:
i.e. te = (t0 + (4 × t1) + tp) ÷ 6
If we take as an example the estimated durations for D.2, the concept design activity, then the formula fills out to:
You can also have software calculate the expected time, e.g. Microsoft™ Project using its PA_PERT Entry Sheet view, but this does not calculate out a standard deviation for the activity (see later). Once we have all expected durations calculated, we can complete the matrix as in Table 4.2.8.
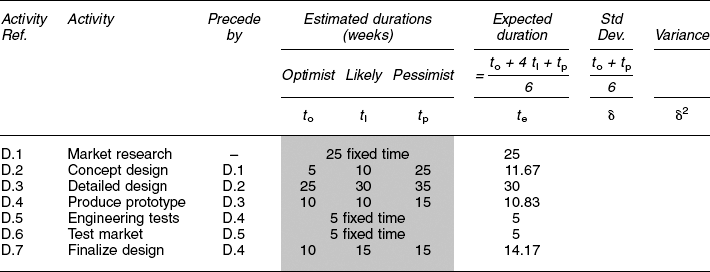
Note that the expected durations are not the same as the likely durations, but are altered by expectations about how the activity may vary.
We can now schedule this project using the expected durations and a network diagram as per Figure 4.2.6 to produce the project Gantt chart as per Figure 4.2.7.
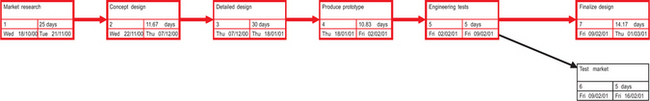
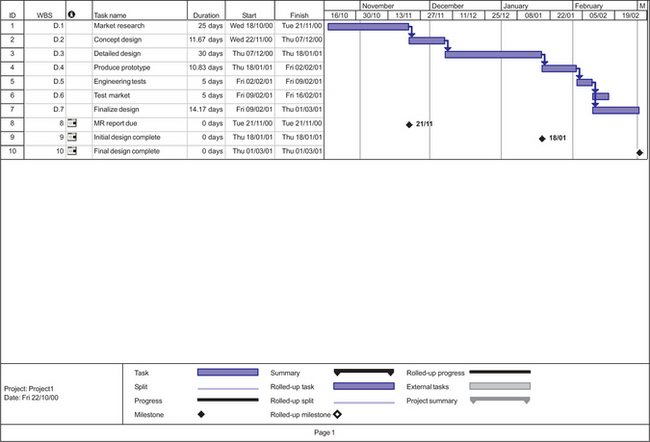
Figure 4.2.6 shows the critical activities to be D.1, D.2, D.3, D.4 D.5 then D.7. These total to 96.17 weeks based on the expected times. Activity D.6 alone has a float – equal to 9.17 weeks.
Patterns in an activity’s duration
If we drew graphs of the possible durations for each of the variable activities, we would get distinctly different patterns as shown in Figure 4.2.8. These show:
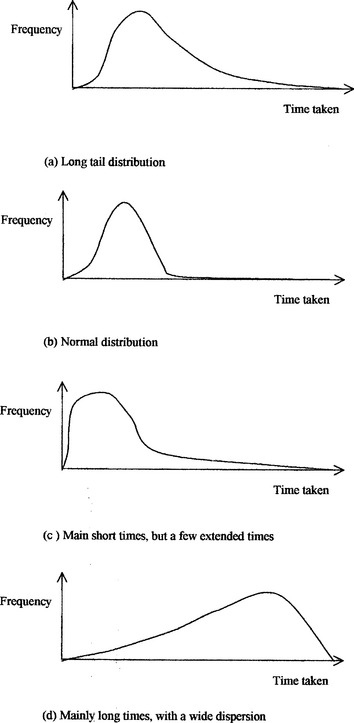
(a) Long tail, e.g. activity D.2. On occasions may possibly suffer a major problem, or need an extended examination and therefore take a much longer time.
(b) Normal bell-shaped distribution, e.g. activity D.3.
(c) Most likely to be short, a few may have problems and take longer, e.g. activity D.4.
(d) Most likely to be long, a few may go well and take shorter, e.g. activity D.7.
The expected duration is only a calculated value – this means that 50% of the time it will be less than this, and 50% of the time it will be more. Many organizations are unhappy with scheduling a project with only a 50% probability that some activities’ duration will be within that used for planning. They may wish to schedule a longer duration than that calculated as expected to ensure a higher probability of the scheduled duration being met.
The extra time added will depend on the desired probability and the distribution pattern of the activity. In a normal distribution, a good value to take is that of the standard deviation (SD). Unfortunately we do not have sufficient values to calculate out a true SD – the practice in project planning is to calculate an approximate SD, as follows:
If we take activity D.2 as an example, this works out to:
Note: use this approximation with care as it assumes a normal distribution which is often not the case, e.g. the pattern for D.2 shows a long tail rather than the normal bell shape.
Putting the approximate standard deviations into the matrix, we have Table 4.2.9. We enter the variations and then sum these variations on the critical path activities.
In any situation where we have a range of variables, we normally expect a completely random variation created by repeating common causes. A histogram of the measurement of the output would then create a normal distribution curve, as shown in Figure 4.2.9.
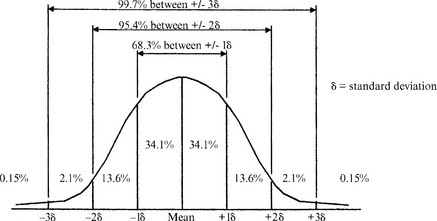
Figure 4.2.9 Normal distribution curve showing percentage values within multiples of the standard deviation
With a normal distribution an indicator for the probability of being within a set value from the mean value is the standard deviation. Table 4.2.10 gives a sample of these probabilities:

This means that if we wish activity D.2 to be met on 90% of occasions, then we take the expected duration and add to it (1.28 times the SD), viz:
This is quite a large increase – imagine what it would do if we had to apply the same calculation to each activity on the critical path to arrive at a value by which we have a 90% probability of completing the whole project. Fortunately we do not.
As the critical path is formed from a string of activities, we can assume that some of these activities will take longer and some will take less than their expected values. These ups and downs will offset each other to some degree and we can allow for that by calculating the overall SD for the project using the variation values for each activity on the critical path. We then find the overall SD by summing the critical path variances and finding the square root of this sum. Note: only these on the critical path are used.
Therefore, for this project,
If we wish to calculate for the project a new overall completion time with a set probability, we use the overall expected completion time and add to it a multiple of the project’s SD value. For example, if we wish to find the overall completion time with a 90% probability of being met, we have:
We can set the project end date in Microsoft™ Project based to this new value and it will show up an overall project float of 6.53 weeks. We can then use this overall float as a buffer in managing the project. Microsoft™ Project cannot accommodate variable activities except in this way. In Section 4.3, however, we introduce add-in software which does allow variable activities to be coped with and makes use of buffers throughout the project.
Project 3 – new plant installation: changing the overall time
The activities for this project are given in Table 4.2.11. and the network in Figure 4.2.10. Let us assume that the durations are fixed for these activities. Resources will be needed for all the activities, but this time we will look only at the plant operatives which are required on activities P.4, P.5 and P.6.
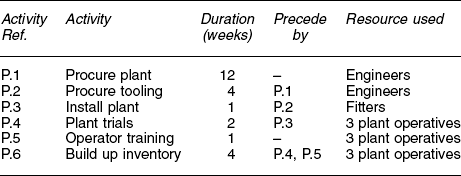
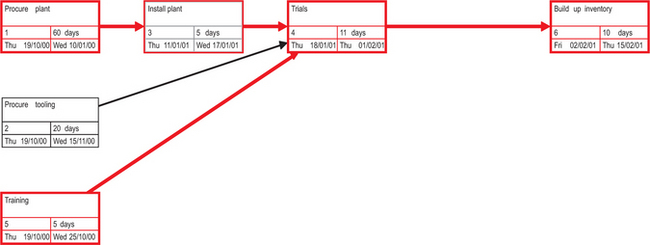
The Gantt chart for the project is shown in Figure 4.2.11. This has been prepared using the latest start times for activities P.2 and P.5 as both have a considerable degree of float available.
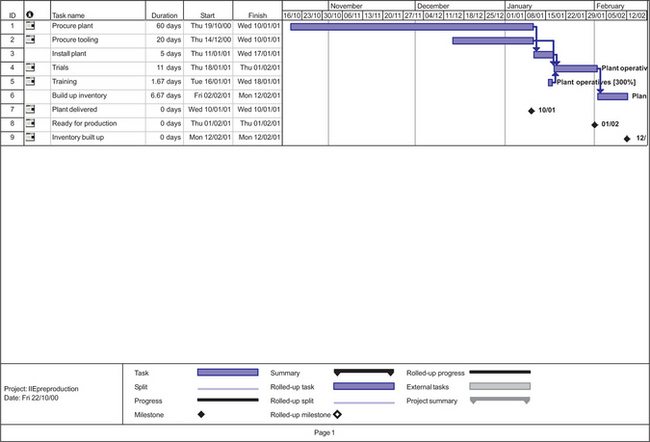
The resource information for the plant operatives is shown in Figure 4.2.12. In here the details entered are:
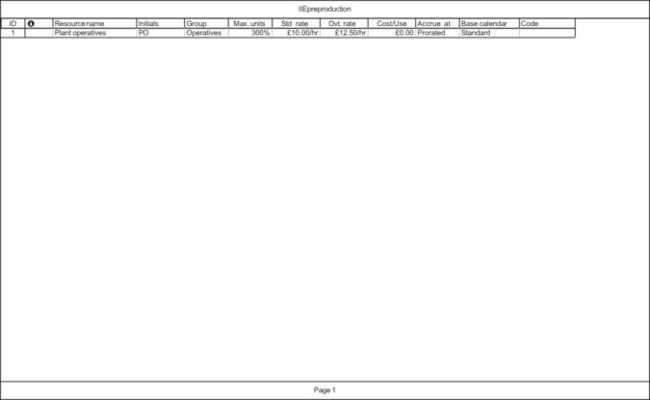
• Max. units – express as 100% = 1 unit, i.e. 300% = 3 operatives.
• Std rate – enter full cost rate (see pages xxx–xxx).
• Ovt. rate – enter overtime full cost rate. Unfortunately only one rate can be entered in Microsoft™ Project which will need consideration if several different rates are paid, e.g. different rates at different times of the week.
• Cost/use – this is accumulated during project running based on hours and associated rate that have been used.
• Accrued – indicating basis of adding up the cost as the resource is actually used during the project.
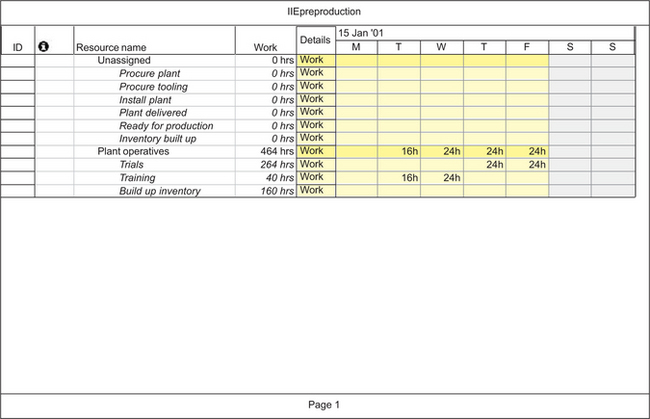
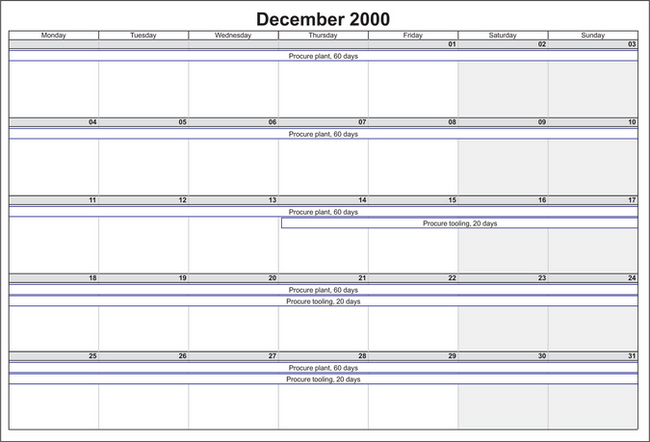
When we tie the resource used to the activities, we can see on a resource usage calendar the total hours planned against each activity and the hours planned on any particular day (see Figure 4.2.13). We can also see on the overall project calendar which activities are planned for any day in any month (see Figure 4.2.14).
Changing the completion date
Having worked out a project’s completion date, we may find that this date is not acceptable.
To move the completion to a later date is easily achieved by simply delaying the start of the project, or one of the activities along the critical path. But how do we proceed if we need an earlier completion date?
To shorten, or crash as it is often referred to, the overall duration of a project we have to shorten some of the critical path activities within the project. There are various ways of doing this, for example:
• Changing the specification so that less is achieved, e.g. in this project reducing the weeks scheduled to build up the inventory and ending up with a smaller inventory to support the product launch.
• Working extra hours on the project:
– Using overtime, e.g. having the plant operatives working more than 40 hours per week.
– Using more people. This may help some activities but we do not necessarily get a proportional reduction in time. Extra work time may be needed due to extra communication problems, using people without the required skill level or who are unfamiliar with the project who need to be brought up to speed.
– Working extra shifts, e.g. having the new machine put onto two, three or even four shifts.
Most of these will cost extra and the management skill is finding the balance between them that will deliver the needed completion date at the minimum cost. We have not applied any of the above to this project.
Combining projects
One of the main problems when organizations are undertaking many interconnected projects is the cross-scheduling of resources that are required on several projects. Microsoft™ Project allows this to be done.
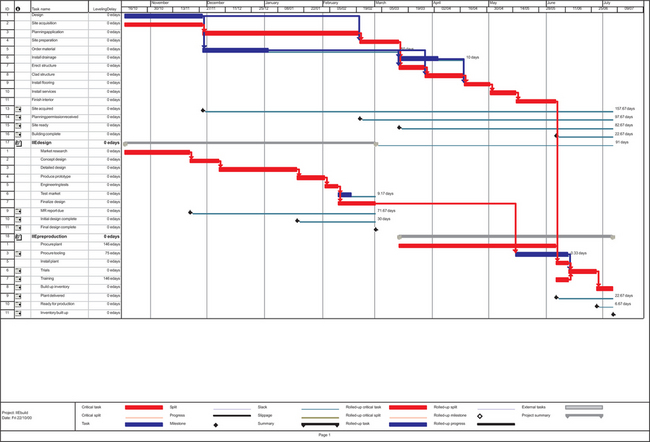
Figure 4.2.15 shows the Gantt chart for three projects combined, but without any links established between them. This shows that the new plant is scheduled to be producing before the site preparation activity for the new factory will be started! If projects are connected we need the links established to determine when the combined project will be complete.
There are a few possible links that could be made, some of which may be based on using the same people resources at key times. If this happens we would need to reschedule to level usage or increase resources.
The two links that we will use are:
• We cannot install the new plant (P.3) until the new building is complete (B.11).
• Procure tooling (P.2) relies on the final product design (D.7) being done.
By establishing these links on the Gantt we arrive at a revised Gantt chart as shown in Figure 4.2.16. This took out some excess float by using the start delay function on the following activities within the new plant project to make use of the large amount of float they carried:
• Procure plant (P.1 and training (P.7) activities – start delay of 146 days from start of combined project, i.e. 20.8 weeks (7 day week).
• Procure tooling (P.2) – start delay of 75 days from end of the expected completion of final design activity (D.7), i.e. 10.7 weeks.
The design project has just been left in its original schedule which means there is a long float before the procure tooling needs to start. This gives a completion time for the combined project as 37.5 weeks. If this date was unsuitable, then we would need to adjust some of the activity durations on the critical path. Unfortunately most software packages do not show a PERT view of a combined project – only of the milestones on it.
Network diagrams are made up using branches and nodes. There are different conventions for placing and identifying activities using these branches and nodes.
This method puts the description of the activity along the branch and the node represents an event as in Figure 4.2.17(a). This convention requires the use of dummy activities, e.g. activity D in Figure 4.2.17(a), as two activities cannot use the same two nodes.
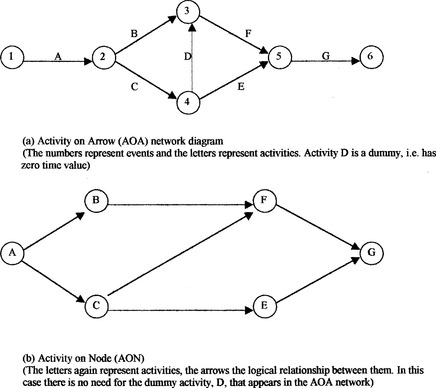
Here the activity information is placed at the node, and the branches represent the logical connection between the modes (activities) as in Figure 4.2.17(b). Many people prefer the use of AON because:
AON has tended to become the norm in computer-based packages such as Microsoft™ Project, which uses a modified (i.e. reduced) AON format.
Some people find that the use of AON networks reduces the need to complete the matrices we have been using as in Table 4.2.2.
4.2.1 Problems
(1) If activity B.6 started two weeks later than its ES time, how much extra time could it then use before it affected the overall project time?
(2) What is the difference in completion time for the design project between the optimistic times and the pessimistic times?
(3) Under what circumstances would you accept a project based on the optimistic times?
(4) How difficult is it to estimate any time for a task you have done only once before?
(5) Draw your own network diagram to show all the activities on the critical path for the combined projects.
4.3 Dealing with uncertainty
This section looks in detail at why so many projects are partial, or complete, failures. The main problem appears to be uncertainties and how we cope with them. Eliyahu Goldratt’s Critical Chain methodology is examined in detail as a possible solution.
As mentioned in Section 4.1, it is common for projects to end in partial, or complete, failure, i.e. having one, or more, of the following serious discrepancies:
This state of affairs has led participants to believe and even expect that large projects cannot succeed fully, mainly because of the many uncertainties involved in them. The American Production and Inventory Control Society has even postulated a set of ‘laws’ that reflect these expectations:
(1) No major project is ever installed on time, within budget and with the same staff that started it.
(2) Projects progress quickly until they are 90% complete, then they remain at 90% complete forever.
(3) One advantage of fuzzy project objectives is that they let you avoid the embarrassment of estimating the corresponding costs.
(4) When things are going well, something will go wrong:
• When things cannot get any worse, they will.
• When things appear to be going better, you have overlooked something.
(5) If project content is allowed to change freely, the rate of change will exceed the rate of progress.
(6) No system is ever completely debugged. Attempts to debug a system inevitably introduce new bugs that are even harder to find.
(7) A carelessly planned project will take three times longer to complete than expected, a carefully planned project will only take twice as long.
(8) Project teams detest progress reporting because it vividly manifests their lack of progress.
It would appear that it is the uncertainties that lead to the disappointing outcomes. However, as mentioned in Section 4.1, there are many factors that can contribute to the failure. If the following factors are present, then failure is almost certainly guaranteed:
• Unobtainable objectives, usually changing as the project moves along.
• Lack of top management support.
• Lack of resources or skills, especially in project management.
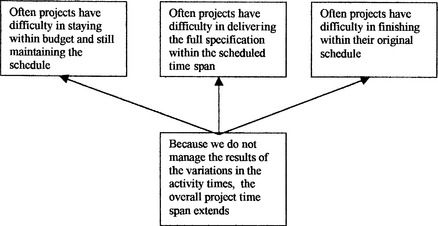
Yet even with projects that do not suffer from these – failures are common. Does that mean that where there are uncertainties, failure is a natural consequence, as shown in the abbreviated cause–effect diagram in Figure 4.3.1?
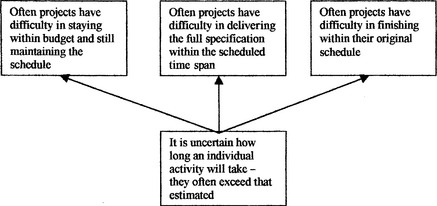
Figure 4.3.1 Cause–effect diagram used to explain why projects often fail in meeting original time span specification and/or budget
Eliyahu Goldratt, author of The Critical Chain, argues that although uncertainties can play a part – it is the way we manage these uncertainties that is the major reason for the failures. Goldratt states we should look at four points:
• How the estimate for the duration of an activity is derived.
• How activities are linked at the scheduling stage.
Why times extend
Estimating an activity’s duration
You probably found it very difficult to answer a question on how long it would take you to build a house using your own labour, as there was no laid down specification (Law 3 on page 178) and you probably have never personally carried out all the tasks involved in such an undertaking. It is understandable that people find it difficult to estimate how long it will take them to complete an operation when what is involved in it is unknown to some degree.
In Section 4.2 (page 163), we made reference to the three-time-estimate method, but even this is mainly speculative guesswork, which may be better than a single time – or it may not. How then is an estimated time really arrived at?
Even with tasks that are fairly repetitive, there are variations in the time to complete them. This variation does not follow the normal distribution, but instead follows a pattern as shown in Figure 4.3.2(a). This is because there are two patterns superimposed on each other:
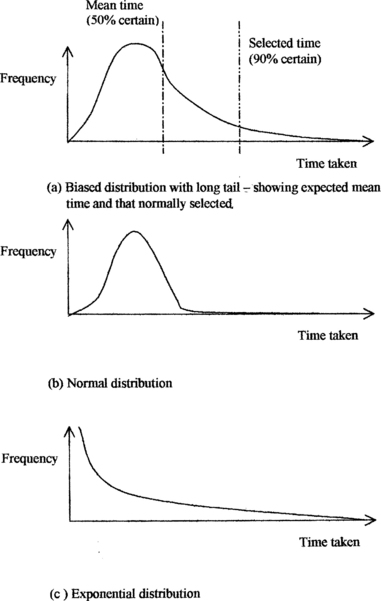
• One pattern is the normal distribution where the variations are limited and spread evenly around a mean, forming the bell-shaped curve as seen in Figure 4.3.2(b).
• The other pattern is a negative exponential one as shown in Figure 4.3.2(c). This distribution is made up of times which have a wide variance – often quite longer than the mean time under the normal distribution. This is due to spasmodic events occurring – for example, a crash will slow traffic flow which will then delay other drivers.
When we are asked to consider the probability of catastrophic events occurring, we tend to overestimate that probability because these events are easy to recall as having happened. Therefore we tend to not commit ourselves to a simple normal mean time, but want to make allowances for the possible happenings – even if it is highly improbable that they will.
In addition there is the natural tendency not to accept a target time when there is a 50% probability of it being exceeded. We would find a lower probability more acceptable – say only a 10% probability of being exceeded as shown in Figure 4.3.2(a). We prefer to have a good factor of safety, especially if we are being judged on the result.
If this is so, then the overall project timescale should be made up from a series of activities most of which have a high degree of being met. This should then, in turn, give the overall completion time a high degree of certainty in being met. Why then are so many projects late?
Preparing the schedule
The project schedule is prepared as in Section 4.2. As everyone has added safety time to the individual activities, the project completion date is extended – normally more than acceptable. It therefore must be reduced, but how?
Management knows about the tendency to add safety time to estimates of activity duration, therefore the first thing that happens is that everyone is requested to accept a reduced time target. As the estimate is already padded, the request is accepted if not too severe.
The net result is that the completion date for the project is reduced which earns kudos for the project manager. However, the reduction process lays the ground for an excuse if an activity is late – after all the revised date was not the original estimate!
Note that if you are a manager who has put in a tight estimate, you will find accepting a tighter target difficult. However, as other managers involved are likely to be accepting the new target, you will probably have to go along, or be seen as ‘not being a team player’. Having learned this lesson, you won’t make the same mistake again – especially if you fail to meet the revised target. The next time you will add a safety allowance. The system punishes you otherwise.
Operating to the schedule
When an activity is being completed in your area, there are three contact points with the schedule:
• Incoming, i.e. when the previous activity is completed.
• Operations, i.e. when the activity is being carried out.
• Outgoing, i.e. when the work is passed onto the next department.
At each of these points, the way we manage things can increase the probability of extending the time taken.
Incoming phase
There is uncertainty about when the previous activity will complete and the work will be passed on. This means that the department is probably not ready to start on the activity when it arrives. The people concerned will be working on other tasks and the incoming work will then queue until they become available. If they did stop what they were doing, they would lose time on that task and are therefore reluctant to do so.
A delay therefore enters the system, shortening the available time.
Operational phase
There will also be little urgency in starting the new activity as it is known that less time is normally needed than allowed for. Note that the estimation of time at the planning stage tended to be pessimistic, now the opposite occurs and an optimistic view is taken – often over-optimistic by making little, or no, allowance for things to go wrong. Yet, if we go by ‘Law 3’ – things will go wrong.
The student syndrome as shown in Figure 4.3.3 is an example of this. The syndrome demonstrates the work pattern of a student when completing an assignment:
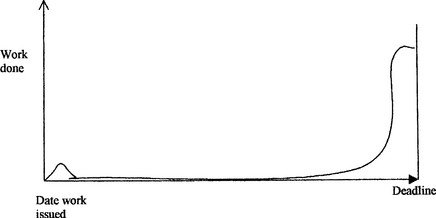
Figure 4.3.3 Student centre syndrome. Demonstrates when students tend to put work into completing their project, i.e. at the last moment. They decide to start work using an optimistic time to schedule back from the deadline – the only thing is that it takes longer than they thought, therefore the work is hurried, incomplete and has errors in it
• The assignment brief is given out at time T out.
• The student has a brief look at it and estimates the work involved.
• The student then uses that estimate to schedule back from the due date, Tin, to determine when to start working on the assignment, T start.
• Sometimes the student forgets and starts later than planned.
• Once the student starts, it is found that there is more involved in completing the assignment than originally estimated.
• Net result is that as the due date approaches, the input has to steeply grow.
• Often time runs out and the report is late, or has to be handed in incomplete.
This means that the activity is started late in the available time and the probability is that the remaining time will not be sufficient to complete it. The activity therefore will extend beyond the scheduled finish time, or the job will have to be passed on incomplete.
The latter just adds to the following department’s tendency not to start work right away, because the job is not in a complete stage and may be altered during the completion phase. If altered this means that work done could be wasted – therefore rather than start an incomplete job, the follow-on department will await the full job. Therefore the next activity will not be started.
With pressure on to complete in time, extra resources are demanded, i.e. costs rise, or a request for a change in the specification is made.
Outgoing phase
The above shows that there is a high probability that this happens late – but what happens if the work is completed before the due date? Is it passed on? Two things conspire against an early pass-on:
• The next department is probably not ready to receive the work, and is reluctant to accept it early because this means a change in their internal schedule and probably a change to their scheduled finish date.
• If the work is passed on early, you may think praise is due. However, the reward is usually a forced reduction in your next estimate because ‘last time you over estimated’.
Therefore even when completed early, the job will not be passed on. Instead it will be retained and polished or embellished. Therefore an opportunity to save costs will be lost – in fact the extra input may actually increase the costs which were budgeted for.
Net result
Any lateness in one, or more, activity is passed on throughout the project and does not get offset by occasions when an activity is completed early as early happenings do not get passed on.
It is therefore no wonder that major projects often have problems in holding their completion date, budgets or specification – even when the estimates of activity durations are quite slack. These symptoms are especially apparent in an organization with a blame culture where risks are normally avoided.
The problem has been analysed by applying Goldratt’s theory of constraints which resulted in the identification of the core problem as depicted in Figure 4.3.4. Goldratt claims it is not the uncertainties in activity times that cause projects to fail, but how that uncertainty is managed.
Goldratt’s core problem resolution
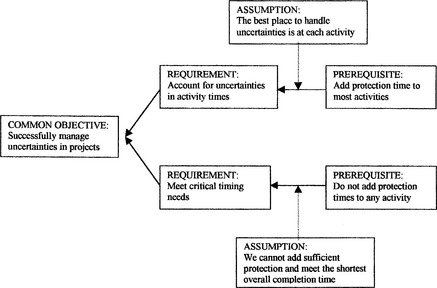
In Goldratt’s theory of constraints all the present system is expressed in a linked cause–effect diagram (not shown). This is then analysed to identify the underlying core problems.
A core problem is defined as one where there are two requirements towards a common objective but these rest on different assumptions which appear to be in complete conflict. The result is expressed in a cloud diagram (as in Figure 4.3.5) and the intention is to inject a solution that breaks both assumptions and hence enables both requirements and the common objective to be met.
The solution
Now that we have identified many of the reasons for projects failing – is there anything we can do as managers to overcome them?
Goldratt states that there is – how we handle the fact that there will be variations in durations. This he recommends is looked at in two ways:
Scheduling
The first aspect is that a time is selected that represents a fair, non-inflated duration, i.e. around the median value of that expected under normal circumstances. This may be based on the PERT three-time estimate initially. The schedule is made up from these values as in Section 4.2 (pages 163–169).
Next a value is calculated representing possible variations for the duration of each activity. Again the PERT three-time estimate method could be used to calculate individual variances and an overall variance along the critical path. The key comes in where these variances are applied. They are not applied to each activity, but are retained as a project buffer for the whole project. The difference can be seen in Figure 4.3.6.
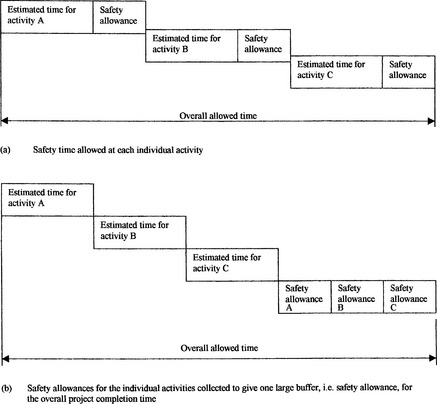
Figure 4.3.6 Formation of project buffer from the individual safety allowances for the individual activities
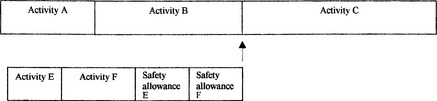
Where we have activities not on the critical path, a feeding buffer can be calculated from the variances on their path and inserted into the schedule by working backwards from the point where they enter the critical path as in Figure 4.3.7.
We now have a schedule with some allowance for variations, but that by itself is little different from what we had after Section 4.2.
Managing the project
Goldratt states we should not do this from an overview viewpoint, but in detail. This is not quite as difficult as it sounds because at any one time, only a small number of the activities will be operational, or about to be so. It is these we need to focus on.
• Operational activities: These need to be closely monitored to determine progress, especially how soon they will be completed.
• Follow-on activities: These need to know exactly when the preceding activity will complete so that they are ready to start immediately on their activity. In effect we use a resource time buffer (see Figure 4.3.8) before each activity so that as the preceding activity nears completion the buffer reduces through stages of:
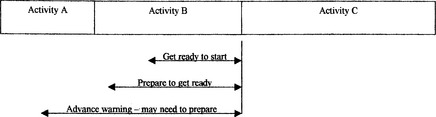
The overall buffer is there to be used when difficulties arise, (Law 4 on page 178). The use of the resource time buffer means that jobs are handed over complete and can be worked on immediately with full commitment.
We now have a tight schedule and a method of managing it that will aid successful project completion. Have we covered everything – or can something still go wrong? Problems could still arise from multi-tasking and changes in the project specification.
Multi-tasking
Multi-tasking arises when a resource is committed at the same time to more than one task, or project. This normally arises because of the problems in scheduling and managing many projects at the same time.
One obvious solution is to reduce the number of projects alive at any one time. This may appear unacceptable at first glance, but one of the reasons that so many projects are alive at the same time is that they take a long time to go through the system and people could have a lot of waiting time on their hands if they are not kept fully loaded with work. Goldratt is very clear – the main results of having many things to do are:
• None gets the attention it really needs.
• Switching back and forward between tasks loses time and focus.
• Queues develop because only one task can be done at a time – the others wait.
The first two apply especially to managers – so having fewer projects can result in them getting completed more effectively and efficiently.
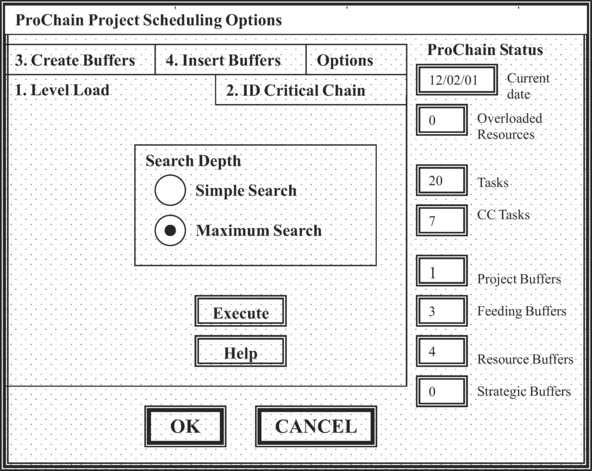
The other solution is to automate scheduling when there are many projects. Software such as ProChain™, from Creative Technology Labs, has been developed that makes use of Goldratt’s methodology in using buffers (see screen in Figure 4.3.9) and this can identify clashes caused by different projects needing a resource at the same time. This software allows us to reschedule tasks to level demand on these resources and their interconnected activities across projects.
That leaves two problems – the alteration of the specification, and persuading managers to transfer ownership of their safety time to the project leader.
We know that the objective should be set before the project begins (see page 153), but even when the proper procedure is carried out there will always be a few occasions when specifications must be changed. The main advantage in this aspect that Goldratt’s methodology gives is that if projects are completed quickly – there will be less opportunity to change the specification.
The problem of getting managers to let go of their safety factors is more problematic and needs the development of trust over time. This depends very much on the culture within the organization.
4.3.1 Problems
(1) How long would it take you to build a house using only your own labour?
(2) Draw a rough histogram of the times taken for your journeys from your home to your place of work, or study. What pattern does it show?
(3) Do you always start a task immediately it is given to you?
(4) When do you start a task when there is a set date for completion?
(5) If you were a manager, would you be happy about accepting an activity time without any safety factor built in?
4.4 Controlling projects
Once the scheduling has been done, the project gets underway. Even when the initial stages have been carefully carried out, the progress needs to be monitored and reported on. Corrective action may need to be taken if the uncertainties which were identified, along with those not foreseen, cause major disruptions beyond the contingency plans and buffers built in. Finally a review needs to be carried out to determine future plans and ensure that lessons learnt are retained.
Having set up the project schedule, it then requires careful management to turn the plan into reality, some of which we have dealt with in Section 4.3. There are two main aspects involved in managing projects:
Managing change to project aims
If we have carried out well the initial stages of initiation and feasibility study, we should have an achievable project with aims that fit into the overall business plan for the organization. The detailed planning and scheduling that follows details the steps towards attaining the desired aims within the laid down constraints.
However, although it is an ideal that we should not change the aims of an ongoing project, on a few occasions this does become necessary. These exceptional occasions must be initiated and authorized by top management to match changes in the business plan. These should be mainly due to changes in the marketplace or the organization’s circumstances, but may arise from the project itself as it progresses – or fails to.
There will always be occasions when the assumptions on which the project was authorized are found to be wrong, perhaps because of misjudgement or a mistake made. The important thing here is not to discover who to blame, but as quickly as possible reassess the situation and determine what needs to be done.
If a project is continually changing then perhaps the initial stages have been rushed, or incorrectly carried out. In this case, we need to stop and reassess the true situation. This may be difficult to do politically.
Alternatively it may be that the organization is going through a period of extreme turbulence. It may be better in the latter circumstance to suspend the project until that turbulence clears as otherwise there is a high probability of wasted effort and cost.
The change(s) that may have to be accommodated are:
• Change in requirements, perhaps because of new information, or that the original aims have been found to be unobtainable.
• Change in deadline, perhaps to meet competition’s launch of a new product or to catch up lost time.
• Change in budget, perhaps because of significant changes in cash flow or spending in some areas exceeding that budgeted for.
• Change in priority, this may be on a time base of which phase to complete first, or even between projects.
In these cases the whole project plan has to be re-examined and will almost certainly have to be rescheduled and resourced to meet the new targets and constraints. In effect it means returning to the first stage of concept and going through the same processes as a new project albeit perhaps in less time. It may be, in extreme cases, that the project will need to be postponed or abandoned.
When top management decides upon changes to the project, it is important that these changes are controlled and the new aims and targets are conveyed to all concerned. This will mean a revision to the terms of reference and all the schedules, and should be handled in a similar manner to the organization’s document control procedure:
Reporting on project progress
We need to monitor, and hence report on, the project’s progress against the planned completion time, the cost budgeted for and the specification. We need to do this not only to ensure we are on target but that resources are available to maintain the momentum as we move towards completion.
To do this, we need to continually update the following for each ongoing activity:
• Has the specification been, or does it need to be, changed?
• What overall time has elapsed so far?
• How much time is required to complete the activity and the project?
• What portion of each activity has been completed and what remains to be completed?
• Any future problems apparent?
• What cost has been incurred so far?
• How much cost is required to complete the activity and the project?
• Has the overall cost of the project already changed or is it now anticipated to change?
Most project management software incorporates reports and some allow customized reports to be designed. For example, Microsoft™ Project has the following in-built reports, only two of which are illustrated herein:
• Project summary (see Figure 4.4.1): Shows overall start/finish information and variances of the overall project such as dates, duration, work, cost and activity status.
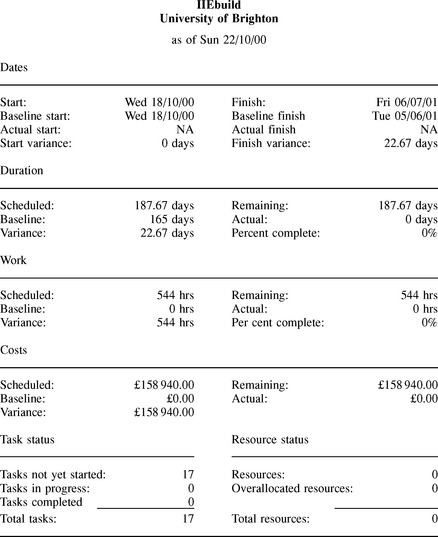
• Top level tasks: Shows all main activities, i.e. no sub-activities, and planned start/finish times and percentage complete.
• Critical tasks: As for top level task report plus preceding and follow-on activities.
• Milestones: Similar to top level task report, but for milestones only.
• Working days: Shows normal weekly pattern of available hours.
Current activities reports
• Unstarted tasks: Shows all activities which have not started.
• Tasks starting soon: Shows activities due to start between user-set dates.
• Tasks in progress: Shows all activities which have started, but not finished yet.
• Completed tasks: Shows all activities which have finished.
• Should have started tasks: Shows all activities which have not started, but that should have.
• Slipping tasks: Shows all activities which have not finished, but that should have.
Cost
• Cash flow: Shows total budget broken down into a weekly basis of the activity budget costs.
• Budget: Shows against each activity the budget cost, that spent and the amount still to spend (of the budget).
• Overbudget tasks: Shows how much should have been spent according to percentage of each activity completed against what was actually spent.
• Overbudget resources: Similar to overbudget task report, but based on actual cost of the resource as it is being used.
• Earned value: Compares activity costs for variance on the following:
Assignments reports
• Who does what: Shows by resource the number of hours budgeted against each activity.
• Who does what when: Shows on a calendar of the project the weekly resource budgeted for against each activity.
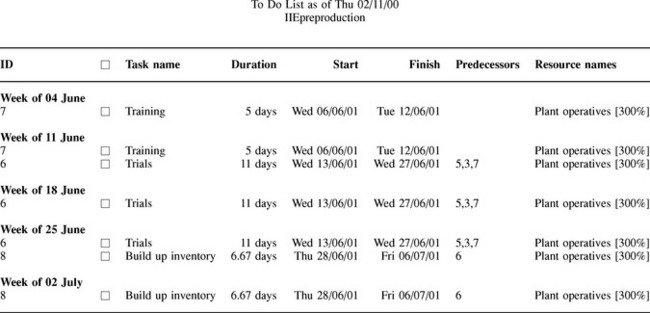
• To do list (see Figure 4.4.2): Produces a week-by-week list of any activities scheduled and the resource to be used.
• Overallocated resources: Shows any resource where the time for scheduled activities exceeds that available.
Workload
• Task usage: Shows on a week-by-week basis the scheduled activities planned and the resources required.
• Resource usage: Shows on a week-by-week basis each resources’ scheduled activities planned.
• These can be designed by the user, but this requires skill to know where to pick up information from, etc.
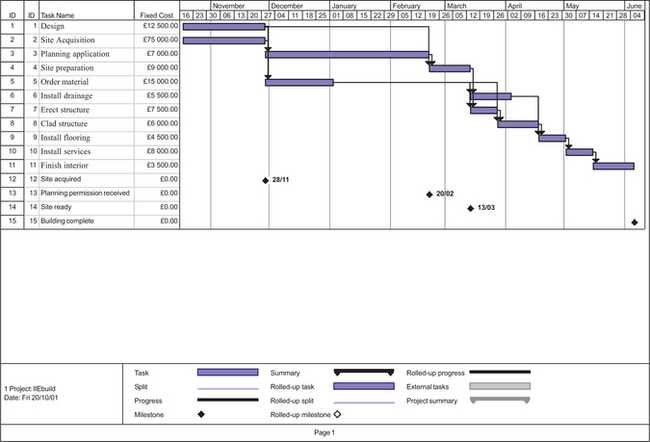
In addition the Gantt chart can be used to visually demonstrate project progress on an activity level (see Figure 4.4.3). On the chart for the build project, the current date is the dotted vertical line at the start of December.
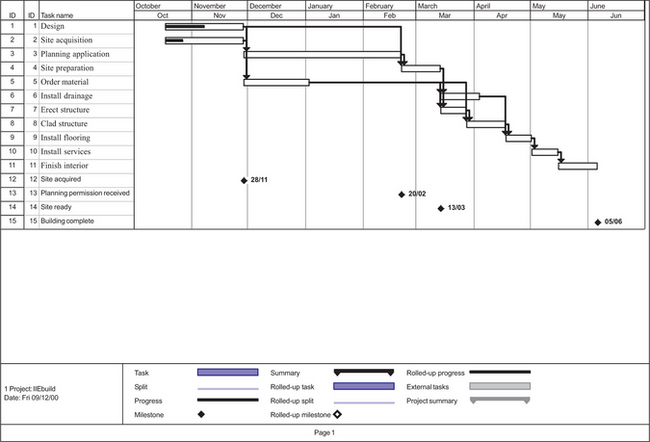
The planned activity duration is shown by a clear box and the actual completion by a horizontal line within the box. In this case, activities are behind schedule – the design activity is only 50% complete and the site acquisition activity is only 20% complete. The planning application and order material activities cannot start as they are tied to the others.
This report enables the managers of the activities to adjust ongoing input, including perhaps some rescheduling. For example:
• The site acquisition activity is critical for the follow-on planning permission activity and this needs checking to see why the finish date has slipped.
• If there is a chance of the finish date being delayed then the start dates of all other activities may have to be changed, or special changes will need to be made to some activities to catch up on the slippage to ensure that the overall completion date is held.
• As the design activity is behind schedule, it may be possible to switch staff to help some other activity, perhaps on a different project, within that section.
Some software packages have built-in graphic assistance to visually present progress information, but often the project manager designs his own. These can be on an activity level or for the project as a whole.
One main variance analysis is the earned value analysis. A chart of this using the data in Table 4.4.1 is shown in Figure 4.4.4:
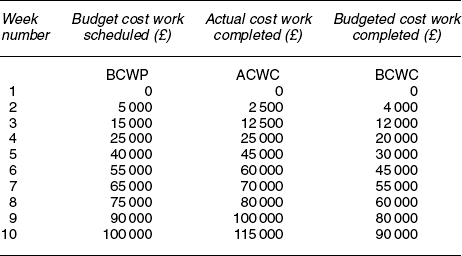
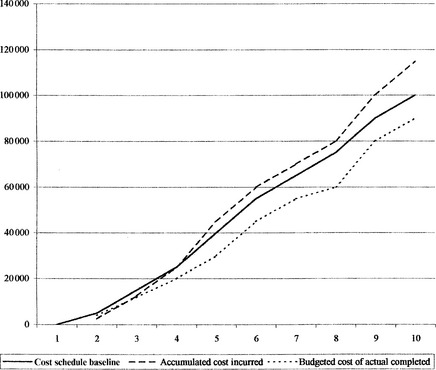
From the table, we can see four variances:
• Time variance: One week, i.e. the value for that portion of the project completed by week ten, is that which should have been completed by week nine in the original cost estimate, i.e. £90 000.
• Schedule variance (SV) of £10000 being the difference between what was budgeted to have been completed by week ten and what was actually completed, i.e. SV = BCWS – BCWC.
• Cost variance of £15 000 over what should have been spent by week ten, i.e. CV = BCWS – ACWC.
• Total variance of £25 000 over the budgeted cost of what has actually been completed, i.e. TV = BCWC – ACWC.
These should all be analysed as to why they have occurred (see Chapter 5) and action taken to redress the variance, if possible. If the variance is not recoverable, the overall schedule and budget will need reforming to show new attainable targets. These must be communicated to senior management and other interested parties for agreement.
Progress meetings need to be held regularly with those involved in ongoing activities and advise those who are next to work on the project. These need not all be formal meetings, in fact most information should continually be gathered whilst visiting sections.
Taking action
– Note the effect on cost and time of present activity.
– Work out what, if any, correction can be made to remainder of activity.
– Find out the reason for the occurrence – not to pin the blame onto people, but to prevent recurrence.
• Impact analysis is required where the recovery cannot be achieved within the ongoing activity. This requires wide consultation with all concerned to reschedule if necessary the remainder of the project.
• Often the project manager will have to resolve issues between sections. This needs creativity in contingency usage, making available more resources, changing dates, or reducing scope.
• The main causes which normally need to be addressed are estimating skills, training, recruitment, and motivation, although often the problems are based in the organization’s culture.
Completion
Almost as important as the initiation phases, the completion phases lay the ground for successful operation thereafter.
The final stage is the final commissioning of the new process, then the formal handover and acceptance of the same. This must be formally recorded to denote the full operational extent, and any problems remaining, of the new process.
Once the project has been handed over, then a careful review and measure of the project success can be made. This is not just to decide if all aims have been achieved but to:
• Determine further needs to bring the new process up to full operational requirements and to maintain it there.
• Identify lessons learnt from the project operation for future projects.
Although the project team will play a major part in the post-project review, it is best if this is conducted by a different person than the project manager.
4.4.1 Problems
(1) Find out what you can about any major project that failed and determine the root causes.
(2) Why is it difficult to change a project that has already been agreed?
(3) Can you think of several projects you have been involved with where the same mistake has been made?
(4) Why do you think many organizations fail to carry out a proper project audit?
(5) What problems could arise when the project review is carried out by someone other than the project manager?