5 Analyze Risk
Knowing our risks provides opportunities to manage and improve our chances of success.
—Roger VanScoy
The techniques of risk analysis are powerful tools to help people manage uncertainty. You can use risk analysis to make and obtain support for your decisions. Using automated tools for risk analysis, you can store, organize, and process data into meaningful knowledge. Any risky situation, from business to science and engineering, can be modeled. Risk analysis tools incorporate uncertainty in your estimates to generate results that show all possible outcomes. The result is a more intelligent decision.
In this chapter, I discuss the process definition steps for analyzing risk. I describe the risk analysis process, which defines the activities and methods to estimate and evaluate risk. Estimation is the appraisal of the risk probability and consequence. Evaluation is an assessment of the options using defined criteria. I explain the tools and techniques used to understand and prioritize software risk effectively.
This chapter answers the following questions:
![]() What are the activities of the risk analysis process?
What are the activities of the risk analysis process?
![]() How can you estimate risk exposure?
How can you estimate risk exposure?
![]() What automated analysis tools are available to evaluate risk?
What automated analysis tools are available to evaluate risk?
5.1 Define the Risk Analysis Process
I define risk analysis success criteria in terms of the process goals, the results that we expect to achieve by using the process. We can view the risk analysis process from two perspectives: external and internal. The external view specifies the process controls, inputs, outputs, and mechanisms. The internal view specifies the process activities that transform inputs to outputs using the mechanisms.
5.1.1 Process Goals
The risk analysis process is sufficient when it satisfies these goals:
![]() Analyze risk in a cost-efficient manner.
Analyze risk in a cost-efficient manner.
![]() Refine the risk context.
Refine the risk context.
![]() Determine the source of risk.
Determine the source of risk.
![]() Determine the risk exposure.
Determine the risk exposure.
![]() Determine the time frame for action.
Determine the time frame for action.
![]() Determine the highest-severity risks.
Determine the highest-severity risks.
These goals can be used as a checklist to ensure the process quality.
5.1.2 Process Definition
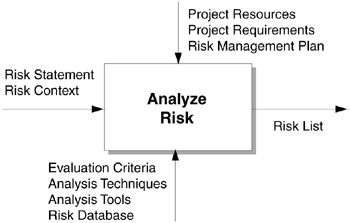
The risk analysis process definition is shown as an IDEF0 diagram in Figure 5.1. IDEF0 is a standard process definition notation used to describe a reusable process component for predictable risk analysis. The diagram describes the top-level process by its controls, inputs, outputs, and mechanisms [AirForce81].
Process Controls. Project resources, project requirements, and the risk management plan regulate the risk analysis process similar to the way they control the risk identification process (see Chapter 4).
Process Inputs. A risk statement and its associated risk context are input to the risk analysis process.
A risk statement is a concise declaration of risk in a standard notation: Issue • probability • consequence. On input, the statement is a subjective and sometimes even vague description of the risk. Through risk analysis activities, you can improve the risk statement by clarifying the issue. Restate the risk by refining the context, and by merging or decomposing risk statements. You can also improve the risk statement by stating the probability and consequence more quantitatively. The value of a quantitative risk exposure can be used to prioritize the risks. Risk communication is more powerful through the simplicity of using numbers (instead of words) to convey the risk exposure.
Figure 5.1 Risk analysis process definition. Analyze Risk encapsulates the activities of the process that transform inputs to outputs. Controls (at the top) regulate the process. Inputs (on the left) enter the process. Outputs (on the right) exit the process. Mechanisms (at the bottom) support the process.
The risk context provides the collateral information surrounding the risk statement (events, conditions, constraints, assumptions, circumstances, contributing factors, and related issues). A cursory risk identification will not provide sufficient risk context. You can either modify or determine the risk category through risk analysis. Refining the risk context is part of the risk analysis process.
Process Outputs. A prioritized risk list and refined risk context are output from the risk analysis process.
A prioritized risk list is an inventory of risks that contains the relative ranking of all identified risks. The risk context provides the collateral information surrounding the risk statement (events, conditions, constraints, assumptions, circumstances, contributing factors, and related issues). The refined risk context adds information obtained from risk analysis, such as the risk category and the source of risk, which is captured in the database.
Process Mechanisms. Evaluation criteria, analysis techniques, analysis tools, and a risk database are mechanisms of the risk analysis process. Mechanisms can be methods, techniques, tools, or other instruments that provide structure to the process activities.
Evaluation criteria for probability, consequence, and time frame for action help to measure risk exposure and to rank risks relative to one another. Analysis techniques help in structuring decisions and determining the bounds for acceptable outcomes. Automated analysis tools help to organize information, show relationships graphically, and make calculations efficiently. A risk database contains the evaluated risk information and the refined risk context. Responsible individuals update the risk database with the current and previous priority. The risk database maintains the total number of weeks on the risk list.
5.1.3 Process Activities
The activities of the risk analysis process are the tasks necessary to transform statements of risk into a prioritized risk list. The activities of the risk analysis process are as follows:
1. Group similar and related risks.
2. Determine risk drivers.
3. Determine source of risk.
4. Use risk analysis techniques and tools.
5. Estimate the risk exposure.
6. Evaluate risk against criteria.
7. Rank risks relative to other risks.
I discuss the risk analysis process activities as sequential steps, but they can be iterative or parallel in execution.
Group Similar and Related Risks. You can group similar risks by sorting the risk database based on risk category. A redundant risk should be tagged as a duplicate and closed. You should note the number of redundant risks that are closed as duplicates—the fact that the same risk was identified more than once may affect its perceived importance. Related risks can be combined when it makes sense to work the risks together. Dependent risks can be linked together when the outcome of one should be considered when prioritizing the other.
Determine Risk Drivers. Risk drivers are the variables that cause the probability and consequence of software risk to fluctuate significantly. (Risk drivers for performance, support, cost, and schedule are described in [AirForce88].) Performance drivers can be found in technical specifications. Additional cost drivers are factors found in software cost-estimation models [Horowitz97]. Schedule drivers include the items on your critical path. Determining the risk drivers refines the risk context and helps to evaluate the risk.
Determine Source of Risk. Sources of risk are the root causes of the risk, determined by asking the same question—“Why?”—five times for each risk. Although the question remains the same, the response will differ until the root cause is determined. Here, for example, are the responses to why the vendor poses a schedule risk:
1. Why: Vendor cannot ensure delivery of the ABC subsystem to meet our integration schedule.
2. Why: The ABC subsystem is a development item for vendor.
3. Why: The ABC subsystem design requires component XYZ.
4. Why: Component XYZ requires the application of advanced technology.
5. Why: Vendor does not have engineers experienced in this technology.
Use Risk Analysis Techniques and Tools. Risk analysis techniques deal with conflicting cost and performance goals, uncertainty, and risk preference. They can be used to conduct trade studies, make decisions, decide whether to make or buy, and select system designs [Buede96]. We use risk analysis techniques to structure, analyze, evaluate, and communicate difficult problems:
![]() Structure states the decision, alternatives, uncertainties, and value of outcomes and specifies their relationships. Influence diagrams and decision trees are useful in structuring a decision model and describing possible scenarios. (An example of an influence diagram is found in section 5.2.)
Structure states the decision, alternatives, uncertainties, and value of outcomes and specifies their relationships. Influence diagrams and decision trees are useful in structuring a decision model and describing possible scenarios. (An example of an influence diagram is found in section 5.2.)
![]() Analyze the decision model to determine the important variables and define their probabilistic relationships. (I describe several techniques for risk analysis in section 5.2.)
Analyze the decision model to determine the important variables and define their probabilistic relationships. (I describe several techniques for risk analysis in section 5.2.)
![]() Evaluate the decision model by calculating possible outcomes to determine risk profiles and the optimal decision policy. (I describe evaluation criteria for risk analysis in section 5.3.)
Evaluate the decision model by calculating possible outcomes to determine risk profiles and the optimal decision policy. (I describe evaluation criteria for risk analysis in section 5.3.)
![]() Communicate risk analysis results by sharing understanding and insights to facilitate decision making. Results of risk analysis can be made accessible by storage in a centralized risk database.
Communicate risk analysis results by sharing understanding and insights to facilitate decision making. Results of risk analysis can be made accessible by storage in a centralized risk database.
Since the 1980s, techniques for risk analysis have become automated in risk analysis tools that range in both price and complexity [Horner97]. These tools use different decision algorithms and can arrive at different conclusions. Automated risk analysis tools can be grouped into the following categories [Buede96]:
![]() Multiattribute utility. To create a hierarchy of objectives and criteria for evaluating the options using a weighted score. Multiattribute utility models measure the performance of alternatives against competing objectives. These tools support sophisticated preference models to evaluate situations where the outcomes are difficult to compare (e.g., profit and customer satisfaction or costs and environmental considerations) [Saaty87].
Multiattribute utility. To create a hierarchy of objectives and criteria for evaluating the options using a weighted score. Multiattribute utility models measure the performance of alternatives against competing objectives. These tools support sophisticated preference models to evaluate situations where the outcomes are difficult to compare (e.g., profit and customer satisfaction or costs and environmental considerations) [Saaty87].
![]() Multicriteria optimization. To provide a framework for finding an optimal solution by weighting or sorting multiple criteria.
Multicriteria optimization. To provide a framework for finding an optimal solution by weighting or sorting multiple criteria.
![]() Multicriteria partial ordering. To accept limited weighting information to separate the dominated options from those that should remain candidates given the information provided.
Multicriteria partial ordering. To accept limited weighting information to separate the dominated options from those that should remain candidates given the information provided.
![]() Inference. To support the probabilistic analysis of nested or sequential events.
Inference. To support the probabilistic analysis of nested or sequential events.
![]() Decision tree or influence diagram. To evaluate risky decisions that incorporate both uncertainties and conflicting objectives.
Decision tree or influence diagram. To evaluate risky decisions that incorporate both uncertainties and conflicting objectives.
![]() Group process. To support decision making in a group or team environment. Decision makers provide inputs and see the results as part of a group session.
Group process. To support decision making in a group or team environment. Decision makers provide inputs and see the results as part of a group session.
Estimate the Risk Exposure. Risk exposure is calculated by multiplying the probability and consequence if the risk occurred (the equation is shown in Figure 5.2) [Boehm89]. Probability is defined as greater than zero but less than 100. Consequence is typically determined in relation to cost, schedule, and technical goals. Quantifying risks by risk exposure provides a relative priority order to all the identified risks—for example:
![]() Product: Functionality XYZ will not likely be ready for the next release. (RE = .35 x Cost of missing functionality)
Product: Functionality XYZ will not likely be ready for the next release. (RE = .35 x Cost of missing functionality)
![]() Time: Very likely that testing will continue for three more months. (RE = .80 x Cost of 3 months testing)
Time: Very likely that testing will continue for three more months. (RE = .80 x Cost of 3 months testing)
![]() Ballpark: Independent verification and validation will likely cost about $15,000. (RE = .70 x $15,000)
Ballpark: Independent verification and validation will likely cost about $15,000. (RE = .70 x $15,000)
![]() Range: Testing will likely cost between $10,000 and $20,000. (RE = (.70 x $10,000) to (.70 x $20,000))
Range: Testing will likely cost between $10,000 and $20,000. (RE = (.70 x $10,000) to (.70 x $20,000))
![]() Cost: The regression test will almost certainly take one month with three senior engineers working on it. (RE = .95 x Cost of regression test)
Cost: The regression test will almost certainly take one month with three senior engineers working on it. (RE = .95 x Cost of regression test)
Figure 5.2 Risk exposure equation. Risk exposure is the product of the primary risk attributes of likelihood and loss. Likelihood P is the probability of an unsatisfactory outcome. Loss C is the consequence if an unsatisfactory outcome occurs.
![]()
Figure 5.3 Risk severity. Risk exposure and the time frame for action determine the relative risk severity. Risk severity helps to distinguish the current risk priority. Over time, risk severity will change to help provide focus for the issues currently facing the project.
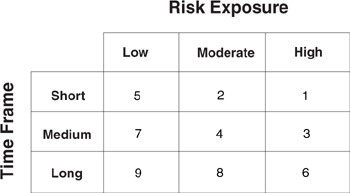
Evaluate Risk Against Criteria. Predefined criteria for evaluating risk ensure that all risks will be judged against the same standard. Risk severity determines relative priority by mapping categories of risk exposure against the criteria of time. Time frame is how soon action is required to prevent the risk from occurring. Figure 5.3 shows how risk severity incorporates the time frame for action to arrive at a final, prioritized list of assessed risks. Risk severity groups risks such that the highest priority risks have a risk severity equal to 1.
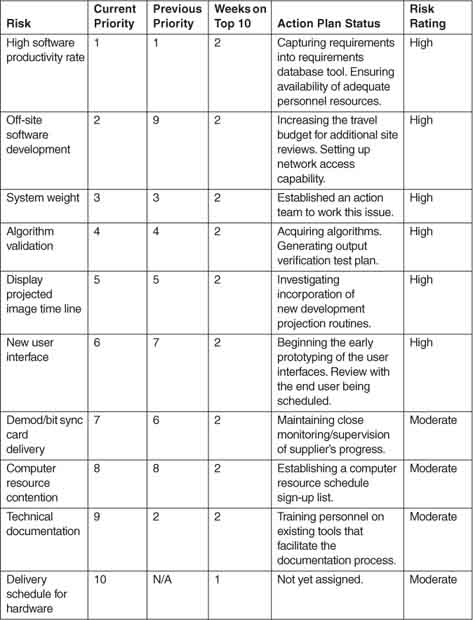
Rank Risks Relative to Other Risks. Risks can be sorted by evaluation criteria, so that the risks with the highest risk exposure and a short time frame for action are reviewed first. Rank the risks to focus project resources effectively and efficiently, and consider the time frame to arrive at a final, prioritized list of assessed risks. The prioritized risks are used to support the Top-N Risk List, a report of the most significant risks. A sample risk list is shown in Figure 5.4.
5.2 Define Risk Analysis Techniques
The risk statement and risk context can be refined through the use of risk analysis techniques. In this section, we look at several of these techniques.
5.2.1 Causal Analysis
Causal analysis shows the relation between an effect and its possible causes to get to the root cause of risk. Its purpose is to prevent problems by determining the problem’s root cause. Among the techniques for causal analysis are the fishbone diagram and the five whys. The philosophy of causal analysis is that if an error has occurred, it will happen again unless something is done to stop it. Future errors are prevented by learning from past errors. Thus, people should evaluate their own errors as part of the process of producing software systems. Causal analysis is a simple three-step process:
1. Determine the cause of the error.
2. Determine the actions that will prevent the error in the future.
3. Implement these corrective actions.
Say that an error has been discovered: the control block field was not initialized, and four test errors were found. Some probing found that the cause was an oversight. Then a search tool was used to find additional occurrences. Finally, to prevent the error from occurring again, action was taken by enhancing the macro to set the field and adding the macro to the module checker tool.
5.2.2 Decision Analysis
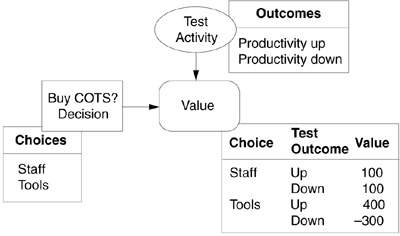
Decision analysis is used to structure decisions and to represent real-world problems by models that can be analyzed to gain insight and understanding [Clemen91] [Baird89] [Raiffa68]. The elements of a decision model are the decisions, uncertain events, and values of outcomes. Once you have identified the elements of your decision, you can use two popular techniques for structuring your decision model: the influence diagram and the decision tree.
An influence diagram provides a graphical representation of the elements of a decision model. A common notation is used:
![]() Squares represent decisions nodes.
Squares represent decisions nodes.
![]() Circles represent chance events.
Circles represent chance events.
![]() Rectangles with rounded corners represent values.
Rectangles with rounded corners represent values.
![]() Double circles represent outcomes known when the inputs are given.
Double circles represent outcomes known when the inputs are given.
Nodes are connected by arrows (called arcs) to show the relationship between the elements of a decision model. Arcs show precedence relationships; the node at the beginning of an arc is called a predecessor, and the node at the end is called a successor. There are two types of arrows: solid arrows pointing to chance and value nodes and dashed arrows pointing to decision nodes. (The influence diagram shown in Figure 5.5 illustrates the relationship of the elements of a basic decision model.) Details can be added to a basic model until all relevant aspects of the decision are modeled. Influence diagrams form a graph without cycles. Cycles are not allowed to account for information (known or unknown) at each decision. Influence diagrams contain the same information as decision trees, but they have the additional capability to hide the details.
Figure 5.5 Influence diagram. The major components of a decision model are represented in this influence diagram: the decision to buy commercial off-the-shelf (COTS), the chance test activity outcome, and the value of the possible outcomes.
A decision tree provides a graphical representation of the elements of a decision model. (An example decision tree was shown in Chapter 2.) A common notation is used:
![]() Squares represent decisions.
Squares represent decisions.
![]() Branches emanating from a square represent choices.
Branches emanating from a square represent choices.
![]() Circles represent chance events.
Circles represent chance events.
![]() Branches emanating from a circle represent possible outcomes.
Branches emanating from a circle represent possible outcomes.
![]() The ends of the branches specify values of outcomes.
The ends of the branches specify values of outcomes.
5.2.3 Gap Analysis
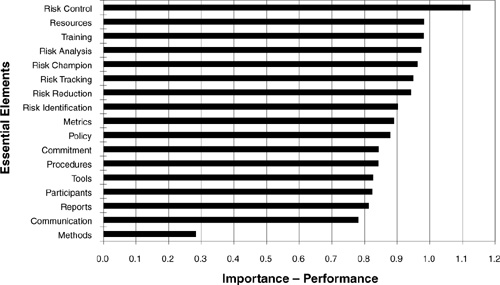
Gap analysis determines the difference between two variables. The gap analysis in Figure 5.6 shows the difference between perceptions of importance and performance of risk management practices [Hall95]. The practices have been sorted by magnitude of the difference. The large gap for risk control illustrates the deficiency in this area. The smaller gap in risk identification shows that survey respondents believed they were performing risk identification better than risk control. Gap analysis shows that the organization is not performing at the level of importance in all areas.
Figure 5.6 Gap analysis. In a risk management practices survey, gap analysis is used to determine the need for improvement of risk management practices. For each practice, survey respondents rated their perceived importance and performance. The difference between these two variables shows the need for improvement in risk management practices.
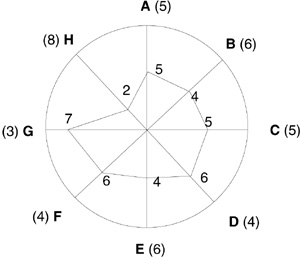
Radar charts show gaps among a number of current and ideal performance areas [Brassard94]. The chart displays the important categories of performance (typically four to eight on a chart) and defines full performance in each category. Figure 5.7 shows process goals and current performance, and the progress made since the previous survey. Strengths and weaknesses are visible in the size of the gaps among current and ideal performance areas. This gap score can be added to each category by subtracting the team rating score from the highest number on the rating scale. For example, on a scale of 1 to 10, a team rating of 4 produces a gap score of 6 in categories B and E.
5.2.4 Pareto Analysis
Pareto analysis determines the order to address the issues. The basis of it is the 80/20 rule, or the Pareto principle: 20 percent of the sources cause 80 percent of the problems. Pareto analysis is used to focus on the risks that have the greatest potential for reducing problems.
Figure 5.7 Radar chart. Progress in performance over time is easy to visualize using a radar chart. Prioritize the rating categories and write them clockwise on the chart. Zero at the center denotes no performance; the highest number on the scale denotes full performance. The goal for performance should be clearly marked. Work on the largest gap in the most critical category.
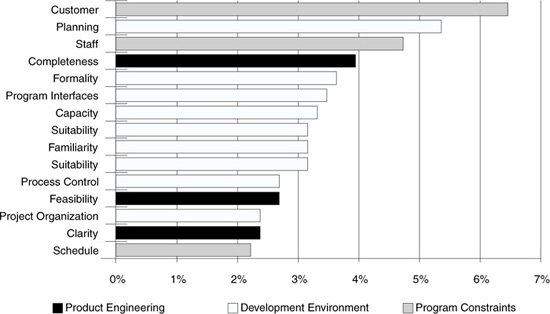
A Pareto chart displays the relative importance of the risks in a quickly interpreted visual format. A Pareto chart can display the number of identified risks (frequency) or the risk exposure (cost). In Figure 5.8, a Pareto chart is used to display the distribution of identified risks by SEI taxonomy element [Hall95]. The frequency of each risk category shows the highest number of risks identified. Knowing the most frequent risks and the greatest cost helps you to determine the most important issues with respect to your goals.
5.2.5 Sensitivity Analysis
Sensitivity analysis helps to determine the sensitivity of the model to variations in input variables by setting each variable to its extreme points (holding all other variables at nominal values). Variables with the ability to affect the decision are important; the others are relatively less important. Variables that are not sensitive to variation can be set to their nominal values and treated as known variables rather than uncertain variables. Sensitivity analysis focuses attention on the variables that have the greatest significance and helps to prioritize data collection. Two useful techniques for sensitivity analysis are tornado diagrams and utility functions.
Figure 5.8 Pareto chart. The relative frequency of risks identified during risk assessments shows the top 20 percent that offer the greatest potential for improvement.
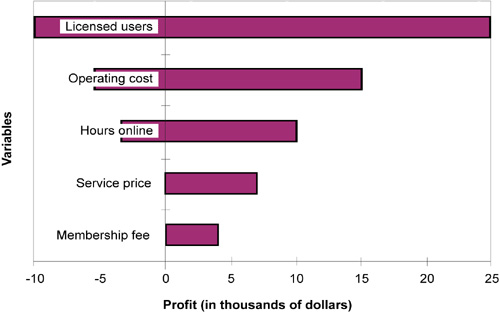
Tornado diagrams allow you to see the most sensitive variables first. As shown in Figure 5.9, the graphic created by plotting a range for each variable does indeed resemble a tornado. The most sensitive variable is found at the top, and the least sensitive variable is at the bottom. The data required to plot a tornado diagram are a list of variables and their range of possible values. The high and low values of each variable determine how much effect the variable might have. The length of the bar for any given variable represents the extent to which (in this diagram) profit is sensitive to this variable.
Utility functions incorporate the decision maker’s risk attitude to maximize expected utility rather than expected value. Utility functions represent an individual’s feelings about risk. Different people have different risk attitudes and are willing to accept different levels of risk. Some are more prone to taking risks, while others are more conservative and avoid risk.
An exponential utility function uses a parameter known as the risk tolerance that determines how risk averse the utility function is. Larger values of risk tolerance mean that an individual is less risk averse. To perform sensitivity analysis to understand risk preference, you can vary risk tolerance to determine at what point the decision changes.
Figure 5.9 Tornado diagram. The profit of an Internet service provider is largely determined by the number of licensed users.
5.3 Define Risk Evaluation Criteria
Evaluation criteria serve as a first cut at ordering risks according to their importance. Evaluation criteria are defined to measure each risk against a known yardstick. Criteria to measure are probability, consequence, and time frame for action.
5.3.1 Probability
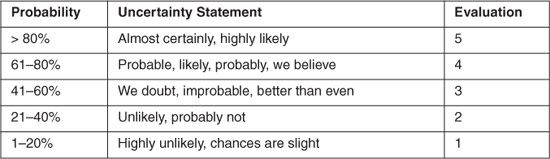
The likelihood of risk occurrence can be evaluated qualitatively or quantitatively. As shown in Table 5.1, probability can be defined as a percentage, a phrase, or a relative number.
Table 5.1 Probability Evaluation Criteria
5.3.2 Consequence
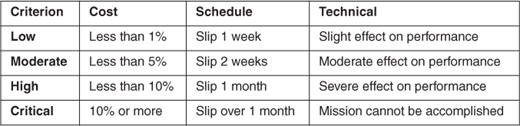
The effect of a risk occurrence should be tailored to a specific project. Project goals can help to refine the evaluation criteria. Table 5.2 shows sample consequence criteria for cost, schedule, and technical goals.
Table 5.2 Consequence Evaluation Criteria
5.3.3 Time Frame
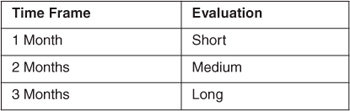
The time frame for action to prevent risk occurrence should be tailored to a specific project. As shown in Table 5.3, the time frame for action can be short, medium, or long.
Table 5.3 Time Frame Evaluation Criteria
5.4 Establish the Risk Prioritization Scheme
Prioritization is necessary to provide focus for important risks. The nominal group technique and weighted multivoting are generally useful in planning, quality management, and process improvement [Brassard94].
5.4.1 Nominal Group Technique
Nominal group technique is a prioritization scheme that allows a team to come to a consensus quickly on the relative importance of risks by combining individual priorities into team priorities. Individuals rank the risks from one to the total number of risks. The summation of all rankings is the risk score. The lowest score is the most important risk.
5.4.2 Weighted Multivoting
Weighted multivoting is a consensus-based prioritization scheme used to rate risks. Team members rate (not rank) the relative importance of risks. Each team member is given the same number of tokens to distribute among the risks. Tokens may be a value (e.g., 100 points) or a number of stickers (e.g., 10 stars). Team members distribute the tokens among as many or as few risks as they desire.
5.5 Summary
In this chapter, I described the process definition steps for analyzing risk:
1. Define the risk analysis process.
2. Define risk analysis techniques.
3. Define risk evaluation criteria.
4. Establish the risk prioritization scheme.
I described the risk analysis process, which defines the activities and methods to estimate and evaluate risk. The activities of the risk analysis process are as follows:
1. Group similar and related risks.
2. Determine risk drivers.
3. Determine source of risk.
4. Use risk analysis techniques and tools.
5. Estimate the risk exposure.
6. Evaluate risk against criteria.
7. Rank risks relative to other risks.
I described several ways to describe an estimate of risk exposure:
![]() Product: Missing functionality in a software system.
Product: Missing functionality in a software system.
![]() Time: Delay of days, weeks, months, or years.
Time: Delay of days, weeks, months, or years.
![]() Ballpark: A rough estimate that includes a margin for error.
Ballpark: A rough estimate that includes a margin for error.
![]() Range: Two estimates spread to include the uncertainty.
Range: Two estimates spread to include the uncertainty.
![]() Cost: Quantification of resources over time.
Cost: Quantification of resources over time.
I described several techniques for risk analysis:
![]() Causal analysis
Causal analysis
![]() Decision analysis
Decision analysis
![]() Gap analysis
Gap analysis
![]() Pareto analysis
Pareto analysis
![]() Sensitivity analysis
Sensitivity analysis
I described the categories of automated analysis tools that are available to evaluate risk:
![]() Multiattribute utility
Multiattribute utility
![]() Multicriteria optimization
Multicriteria optimization
![]() Multicriteria partial ordering
Multicriteria partial ordering
![]() Inference
Inference
![]() Influence diagram or decision tree
Influence diagram or decision tree
![]() Group process
Group process
5.6 Questions for Discussion
1. Describe the risk analysis process goals. Why is each goal important? Define quantitative success criteria for each goal.
2. List five ways that a risk database can assist the risk analysis process. How would you ensure that the risk database is maintained?
3. What are risk drivers? Describe the known software project risk drivers for both cost and schedule. Develop a matrix to show how these risk drivers relate to each other.
4. Why is it important to determine the source of risk? Describe the techniques that are available to understand the root cause of risk.
5. Unrealistic schedule and budget has been identified as a risk. Perform a causal analysis to prevent this problem on your next assignment. What are the chances that your corrective actions will be implemented successfully? Why do you think so?
6. You are the technical leader of a project that is on the cutting edge of wireless communication technology. Time to market is critical to your project’s success, but there is a shortage of people with domain expertise. Use the risk analysis technique of your choice to structure, analyze, evaluate, and communicate this risk.
7. How can you define time frame for action to help prioritize risks? What is the value of using time to evaluate risk? Give an example that uses time to evaluate risk.
8. When should risk analysis be qualitative? When should risk analysis be quantitative? Explain your answer.
9. Many risks are interrelated. Analyze the following compound risk: Unstable requirements with a tight budget will likely cancel the project. Discuss the dependencies that exist between the two risks.
10. Why are consensus-based prioritization schemes useful on software projects? In general, would you expect individuals to agree on risk priorities? Discuss why you would or would not expect agreement.
5.7 References
[AirForce88] Air Force. Software Risk Abatement. AFSC/AFLC pamphlet 800-45. Wright-Patterson Air Force Base, OH: Air Force Systems Command, Air Force Logistics Command, 1988.
[AirForce81] Integrated Computer Aided Manufacturing Architecture, Part II, Vol. IV: Function Modeling Manual (IDEF0). AFWAL-TR-81-4023, Wright-Patterson Air Force Base, OH: Air Force Systems Command, June 1981.
[Baird89] Baird B. Managerial Decisions Under Uncertainty: An Introduction to the Analysis of Decision Making. New York: Wiley, 1989.
[Boehm89] Boehm B. IEEE Tutorial on Software Risk Management. New York: IEEE Computer Society Press, 1989.
[Brassard94] Brassard M, Ritter D. The Memory Jogger II. Methuen, MA: GOAL/QPC, 1994.
[Buede96] Buede D. Decision/risk analysis software: Survey for trade studies. Proc. 7th INCOSE Symposium, Boston, July 1996.
[Clemen91] Clemen R. Making Hard Decisions: An Introduction to Decision Analysis. Boston: Wadsworth, 1991.
[Hall95] Hall E, Natwick G, Ulrich F, Engle C. Streamlining the risk assessment process. Proc. Seventh Software Technology Conference, Salt Lake City, UT, April 1995.
[Horner97] Horner P. (editor) Spreadsheet Add-Ins Survey. ORMS Today, Vol. 24, pp. 46– 48, Atlanta: Institute for Operations Research and the Management Sciences (INFORMS), February 1997. [Note: This is a bimonthly journal]
[Horowitz97] Horowitz E, et al. USC COCOMOII.1997 Reference Manual. Los Angeles: University of Southern California, 1997.
[Raiffa68] Raiffa H. Decision Analysis: Introductory Lectures on Choices Under Uncertainty. New York: Random House, 1968.
[Saaty87] Saaty R. The analytical hierarchy process: What it is and how it is used. Mathematical Modelling, 9 (3–5): 161–176, 1987.
[VanScoy92] VanScoy R. Software development risk: Problem or opportunity. Technical report CMU/SEI-92-TR-30. Pittsburgh, PA: Software Engineering Institute, Carnegie Mellon University, 1992.