
![]()
CHAPTER FIVE
E-PUBLIC HEALTH INFORMATION SYSTEMS
E-Technologies for Public Health Preparedness and Surveillance
Joseph Tan, Francisco G. Soto Mas, C. Ed Hsu
B. E-Public Health Informatics
III. Legacy Health Systems Versus E-Public Health Information Systems
A. Key Features of E-Public Health Information Systems
IV. E-Technologies for Public Health Surveillance and Preparedness
B. Epidemiological Surveillance and Public Health Preparedness
C. GIS-Related Technologies for Emergency Preparedness and Bioterrorism
D. GIS-Related Data Management for Emergency Preparedness
E. A GIS-Enabled System for Health Surveillance and Epidemiological Rapid Assessment
VIII. E-Profiling of Community Performance Indicators Case
Learning Objectives
- Define public health and public health informatics in the context of the evolving e-health care system and environment
- Understand the basic functions of e-public health information systems
- Identify key features of e-public health information systems
- Recognize the differences between legacy and e-public health technologies in practice
- Understand the application of e-technologies such as geographical information systems (GIS), data warehousing, and data mining methodology in the context of public health preparedness and surveillance
- Understand the application of GIS-based technology in public health surveillance and rapid epidemiological assessment
Introduction
In this era of knowledge diffusion, rapid advances in quantum sciences and developments in e-technologies promise to revamp every aspect of health and medicine. History documents that in 1793, over five thousand people in a Philadelphia neighborhood—about 10 percent of the city's population—lost their lives within just three months following an outbreak of yellow fever. Had computers been in place two centuries ago, the software would have been able to monitor population health, alert public health officials at an early stage to a possible outbreak, and permit epidemiologists to assess the event rapidly and respond by quarantining the ill, preventing the deaths of a significant number of people.
Present-day applications of information and communication technology (ICT), through the use of tools such as health decision support systems, geographical information systems, and data mining methodologies, can now automatically track and monitor significant health threats and other related events both locally and across the globe (Tan with Sheps, 1998). For example, one surveillance system used by Health Canada searches the Internet for information on potential outbreaks and epidemics. The information collected is then sent to the World Health Organization (WHO) for verification and analysis. This information, in turn, can be used to alert public health officials worldwide to take preventive measures. The WHO's ability to monitor and assist in controlling the spread of recent outbreaks of severe acute respiratory syndrome (SARS), avian flu, and other infectious diseases (for example, chicken pox and monkey pox) worldwide testify to the effectiveness of current public health information systems.
Access to well-documented, timely, and useful information is the key to preventing disease and promoting health. The collection, analysis, use, and communication of health-related information has been called a “quintessential public health service,” because all public health work depends on the availability of accurate, comparable, relevant, and timely information (Seldon, Humphreys, Yasnoff, and Ryan, 2001–2002). Public health, then, is a natural venue for the use and application of advanced information technology. E-health technologies may be considered the hub of health care delivery at the macro level, because these technologies link communities to public health practitioners; provide government with information on population health status and changing statistics; allow greater quality improvement; enhance learning about effective methods for responding to outbreaks and other related threats; and channel epidemiologists and public health researchers to concentrate on the health and wellbeing of the population, on future public health care delivery, and on more effective decision making and policymaking at the community, public health, and governmental levels (Riegelman and Persily, 2001).
The ability to monitor, store, and track e-health information changes the way health care is provided. The preceding chapters discussed the vision and goals of e-health; in this chapter, we argue that the vision of e-health is to promote the health and well-being not only of individuals but also of groups, communities, and entire populations. Earlier chapters showed how e-technologies, in the form of e-health records and other e-technologies (for example, e-prescription systems, e-clinical care, and e-medicine), can assist in realizing such a vision and goals. This chapter focuses on the application of e-technologies in the field of public health—that is, e-health surveillance systems and geographical information systems (GIS).
We begin the chapter by defining public health and e-public health informatics. We then highlight the potential benefits of a convergence of public health and technology, discussing GIS, public health preparedness, and surveillance. We describe the basic terminology and examine how emerging e-technologies such as GIS, data warehousing, and data mining methodology can support public health readiness, response, and ongoing surveillance in relation to epidemiological and biodefense activities. Tan's model of health information processing functions (Tan, 1995) is adopted to illustrate the potential of various e-technologies and to show how technology such as GIS might enhance preparedness for bioterrorism. An application of GIS in epidemiological rapid assessment is used to illustrate how the scope of traditional public health surveillance can be extended by e-health applications.
The Field of Public Health
The term public health conveys different meanings to different people. For new parents, it might mean a vaccination shot to protect their child from Hepatitis B. For tourists in a foreign country, it might mean the comfort of knowing that the restaurants they will be dining in are regularly inspected. For public health students, residents, and practitioners, it might mean the investigation of food or waterborne epidemics in a community. But public health should not only mean preventing disease, injury, and disability. It should mean improving population health and health status and dealing with the most risky and prevailing health issues facing our society. In its early years, public health focused on preventing and dealing with infectious diseases such as yellow fever and tuberculosis. During the Industrial Revolution, public health shifted its attention to chronic disease management, focusing on diabetes, cancer, and heart disease. Today, new and more difficult challenges await us as we deal with newly emerged infections, bioterrorism, and antibiotic-resistant organisms (Yasnoff, Overhage, Humphreys, and LaVenture, 2001). Indeed, a key request expressed urgently by the U.S. government to scientists and researchers is for them to take up the challenge of preparing the nation against bioterrorism and biohazards.
Generally speaking, the science of public health studies the distribution and determinants of health-related states or events in a specific population and works to understand how the acquired information can be applied to control health problems. In differentiating between individual and public health, we may say that a clinician, whose focus is on individual health, will try to determine the disease that an individual has contracted, while a public health practitioner will try to identify the individuals most susceptible to a specific disease or condition. Koo, O'Carroll, and LaVenture (2001) suggest a four-step approach to public health problem solving:
- Surveillance, or asking what the problem may be
- Risk factor identification, or asking what the underlying cause of the problem may be
- Intervention evaluation, or asking what works and what doesn't
- Implementation, or asking how to go about applying what we have learned
They also propose that the three primary roles of public health practitioners are (1) assessing and monitoring the health of communities and populations at risk to identify health problems and priorities; (2) developing public policy designed to solve these identified health problems; and (3) ensuring that all populations have access to appropriate care, from health promotion to disease prevention services. In an e-public health environment, public health practitioners who can employ the most advanced information technologies will capture the most reliable and current information about disease trends and know the best practices and most effective methods for dealing with public health problems.
The players in the field of public health range from nurses, physicians, and epidemiologists to engineers, social workers, laboratory workers, sanitarians, lawyers, government legislators, and academics. Public health involves all these players because it covers wide-ranging issues from toxic waste disposal to water treatment, from school safety to promoting healthy lifestyles. The large number of players and the variety of issues make the adequate processing of information central to the core functions of public health programs. This leads us to ask, what is e-public health informatics?
E-Public Health Informatics
According to Yasnoff, Overhage, Humphreys, and LaVenture (2001), public health informatics may be conceived as “the systematic application of information and computer sciences to public health practice, research and learning…. The development of this field and dissemination of informatics knowledge and expertise to public health professionals is the key to unlocking the potential of information systems to improve the health of the nation” (p. 537). While this definition focuses on the role of ICT as a tool for public health professionals to engage individuals, groups, and communities in the process of behavioral and environmental change (Seldon, Humphreys, Yasnoff, and Ryan, 2001–2002), we surmise that in the context of the evolving e-health system and environment, the participation of all stakeholders—including public health professionals and workers, the public, the WHO, hospital physicians, clinicians, leaders in governmental and nongovernmental organizations, health authorities, first responders in emergencies (such as police and firefighters), policymakers, and academic re-searchers—is critical to the expanding field of e-public health informatics. Based on an expanded view of these earlier definitions, we therefore conceptualize e-public health informatics as networks of interconnected e-stakeholders working together through the systematic application of information and communication technologies and e-technologies to achieve timely, high-quality, and cost-effective public health surveillance, preparedness, and care services. E-public health informatics therefore integrates public health with ICT and e-health technologies. In other words, it is the systematic use and application of ICT and e-technologies as tools to support a large network of interconnected e-stakeholders, particularly e-public health professionals and the government, in their goal of protecting and promoting the health and well-being of the public. The discipline covers a gamut of specialties, from e-disease surveillance and e-disease registries to on-line injury and trauma tracking and occupational and environmental health risks monitoring. E-public health informatics also deals with the complicated relationships of ICT and e-technologies in community health services; population screening programs; immunization programs; emergency, disaster, and bioterrorism preparedness and response; and genetics programs. In fact, when e-public health informatics is used to its full advantage, e-public health systems can determine and describe the magnitude of health problems and their sources, analyze risk factors, identify community strengths and particular areas of weaknesses, continually evaluate, refine, and implement what works and promote the health and well-being of entire populations.
Because public health and e-health technologies seem so inextricably linked, it is easy to presume that e-public health informatics would be a well-defined and active discipline. However, just the opposite is true. While the public health community was among the very first in the health discipline to adopt computer technology, the technology was applied in pursuit of narrow, categorical applications rather than applications that would be easily integrated into functional systems for monitoring the health and well-being of communities. Until the last few years, there were only a very limited number of successful e-public health informatics applications. This is due, in part, to lack of resources, poor public health education, inadequate support for population-based public health programs, low-level use of advancing e-technologies and the complexity of e-public health information management problems. The basic computer and telecommunications infrastructure necessary for the implementation of effective e-public health information systems has been slow to develop, because data systems not only require a large front-end investment but are also difficult to change quickly in response to new decision-making trends.
Another problem that has hindered the development of e-public health ICT infrastructure is that public health officials typically do not have the training, necessary experience, or knowledge about the effective implementation of e-public health information systems to make strategic investment decisions about ICT. Although public health staff recognize the immense importance of integrated, computerized information systems as critical tools, the key components of public health ICT infrastructure have not historically been funded by large grants or endowments. This is true even in countries such as Canada and the United States that are known for heavy investment in health care research. For example, Koo, O'Carroll, and LaVenture (2001) state that the U.S. Congress will fund public health programs for disease prevention and control, but there is little or no incentive to fund program-specific ICT-related public health projects, such as development of integrated e-public health information systems that would benefit multiple community and public health programs. The result of this targeted funding approach is that local and state health departments in the United States use distinct, incompatible applications for the entry and analysis of public health data, resulting in data that cannot be easily exchanged, linked, or merged by different programs or used by public health personnel across geographical areas.
Nevertheless, in recent years, the field of e-public health informatics has exploded. The number of academic papers addressing the application of advanced ICT in public health has more than tripled, from only about twenty scientific papers between 1980 and 1984 to over nine hundred between 1996 and 2000 (Seldon, Humphreys, Yasnoff, and Ryan, 2001–2002). Recognition of this newly emerging field is also occurring in universities across the United States and Canada. Schools of public health and health informatics programs at North American universities are introducing new courses to teach the importance of health information systems to the success of public health programs. For instance, Dr. Richard Riegelman, a professor and administrator at the School of Public Health and Health Services at The George Washington University, insists that students of public health need core skills in health information systems, including basic concepts of information management in public health practice and the use of health data (Riegelman and Persily, 2001). E-public health information systems and health communications are the ties that bind the disciplines of public health, health services, and clinical medicine, and thus it is vital for public health practitioners to understand the applications of emerging e-public health technologies.
The linchpin of e-public health information systems is electronic surveillance, which is generally defined as automatic and systematic collection, analysis, and interpretation of health data for use in planning, implementing, and evaluating public health programs and practices. E-surveillance is a crucial element in the detection and description of emerging health problems. A critical point in e-public health informatics is that e-surveillance is not only intensively data-driven but also heavily resource-dependent. No single data source or system contains information for all diseases or conditions of interest. Therefore, an e-public health information system that coordinates the tracking and monitoring of all of these data would be an expensive solution. The data must be derived from various sources, including individual family physicians, laboratories, and birth and death certificates. Thus, e-public health informatics is frequently challenged to manage a variety of inconsistent data. A well-designed e-public health information system would create a networked system strong enough to reduce or eliminate these inconsistencies, translate the data into discernible trends and patterns, and discover or identify key population health problems before they become serious.
At this time, we turn to some specific examples and applications of legacy systems and e-public health information systems.
Legacy Health Systems Versus E-Public Health Information Systems
Several applications of legacy (traditional public health information and recording) systems and more current e-public health information systems have recently been put into practice with varying degrees of success. Given the complexity of these systems and the size of the public health field, it is no surprise that creating e-public health technology that catches, tracks, and appropriately assesses the necessary data to determine public health status is an extremely challenging task.
Emerging e-public health technologies include geographical information systems (GIS), data warehousing, and data mining methodology. These e-technologies, which have matured over the years, are now being applied to e-public health information systems. Before focusing our discussion on specifics, we will survey the essential features of an e-public health information system and compare some legacy systems with some Internet-based public health information systems.
Key Features of E-Public Health Information Systems
An e-public health information system must support the public health mandate of improving the health status of the community and the population at large. The information system must measure the health of the population against potential determinants of health. Community health assessment, for example, requires the collection, analysis, interpretation, and communication of key health statistics, data, and information.
Data-driven e-public health information systems must be comprehensive and take a broad, strategic view of the community or population health status. These systems should be feasible and sustainable. Data should come from existing available sources and must have community-level granularity that can be aggregated to census tracts, among other geographical identifiers, to address issues of regional variability. Data from a variety of medical and nonmedical databases should be integrated to provide the necessary information. Timely information is central to informed development of public health policy. The output presentation should be easy to read and interpret so that public health care workers and professionals can easily understand and use the system.
Population health requires long-term strategies, so the indicators measured and monitored should include both process (for example, number of hospital visits) and outcome (for example, infant mortality) indicators. The tracked indicators must be integrated operationally and related to existing public health services. Quantitative indicators that form the community health profile must describe various sociodemographic characteristics, health status, and quality of life such as morbidity measures. Specifically, in developing an e-public health statistical system to measure the health status of a region—say, metropolitan Detroit—we must be able to generally state the life expectancy (in number of years) and the infant mortality rates (infant deaths per 1,000 live births), as moderated by such variables as gender, age, race, and location, for residents of the city and its various suburbs.
It is important also to know where and how public health data are collected. Data are collected in a variety of sites, including hospitals, laboratories, clinics, and workplaces. Several administrative jurisdictions influence the timing of data entry, which is also influenced by workload and hardware and software access. For example, the Centers for Disease Control and Prevention (CDC) mandate the registration of birth in the United States for disease control purposes, but variations in this registration process occur due to state regulatory requirements and individual hospital regulations. The initial birth information is recorded locally within a week and sent to the state department within one to four weeks. The information is then sent to the CDC, and it can take up to a full calendar year for the birth to be recorded in the national registry. In other words, there is a one-year time lag in national data resulting in delayed public health policy implementation and effective key decisions.
In practical terms, timely availability of information is required for effective public health policymaking and decision making; national and even international standards for the registration of information that is significant to population health are essential. Because different health care professionals will use the e-public health information system for different purposes, terminology must also be understandable across professions (Hardiker, Hoy, and Casey, 2000). Other areas of concerns include ease of data retrieval, quality of the data presentation interface, and data sharing among public health authorities and health care providers.
Data are filed by a variety of users, including police, doctors, community health nurses, and paramedics; not everyone who enters data will be aware of how the information is used for public health policy development. Although data from death certificates are used for morbidity and mortality statistics, physicians often complete death certificates quickly and inaccurately. The literature reports different levels of detail of information reported in active public health–initiated surveillance (for example, number of cases of influenza) and in passive surveillance (for example, number of flu shots administered). Other differences have also been found, especially when public health departments rely on different providers for data. Wide differences in terminology prevent the comparison and exchange of public health information. For effective data sharing and communications, efforts must be made to develop controlled vocabularies, classifications, nomenclatures, and thesauri. Ongoing national and international initiatives are striving to develop standard terminology (Hardiker, Hoy, and Casey, 2000).
Public health data about specific individuals must be accurately combined and aggregated at the population level. This information must also be provided to legislators, the community, and e-health care providers. Several nonmedical data sets can be used to monitor community health, including crime, housing, socioeconomic environment, lifestyle, transportation, education, and accidents, all of which should be monitored and reported. Much of this information is collected routinely and can be disaggregated to regional or community levels (Saunders, Mathers, Parry, and Stevens, 2001). Unique identifiers to link health outcomes with specific communities or areas are essential to the functioning of an e-public health information system.
More important, the information collected for public health is very personal, and the risk of harm to patients if information is incorrectly released is high. Safeguards must be implemented to protect the individual and ensure that the community has confidence in the data's security, privacy, and confidentiality.
The creation of a standardized vocabulary is necessary, but even a long-standing standardized classification system is not immune to interpretation errors. The international classification of diseases (ICD) was developed to allow international comparability of mortality and morbidity and has been in place for several decades. Nonetheless, current literature indicates problems with the accuracy of the system. Error rates appear to be related to medical complexity: a low error rate has been found in ophthalmology, and a high number of errors has been found in cardiovascular disease. Errors may also occur because coders, usually health records technicians, are not well trained. In addition, physicians may not specify the discharge diagnosis in the discharge report, or specialists may simply overlook the primary diagnosis.
Following are some specific examples of e-public health information systems that have been put into practice. We hope that the discussion of these examples will illustrate the need for further development of e-technologies for public health surveillance and preparedness.
CATCH
The Comprehensive Assessment for Tracking Community Health (CATCH) is a systematic framework that was developed in southern Florida by the Association of Schools of Public Health in collaboration with the CDC to measure community-level health status. CATCH links health status to resource allocation and policy formulation. CATCH is multidimensional and comprehensive and monitors over two hundred indicators organized into ten major categories, including socioeconomic status, maternal and child health, infectious diseases, and behavioral risk. These indicators are taken from multiple sources that are uniformly collected, available at a county level, and reside in an existing public database. Indicators reported are also comparable to state and national values.
CATCH allows communities to identify health needs of the community groups and to set priorities through the tracking of many indicators. Information collected over a five-year period also allows trend comparisons. CATCH supports displays of the aggregated information in numeric and graphical forms. County indicators that fall below average are listed and evaluated in terms of several key criteria, including the number of people affected, the economic impact, the availability of efficacious treatment or prevention strategies, the trend direction, and the magnitude of the difference between the county values and the average values. Results from using CATCH include achievement of a community focus on high-priority health problems and increased coordination across sectors and across the broad spectrum of community health partners.
CATCH can be considered a legacy public health information system because of the traditional ways in which data are collected within the program. Unfortunately, the program is labor-intensive, and information is collected via telephone, hard-copy documents, or faxes. Data collected must be verified; typically, the time lag between an event and registration of the information into CATCH is three to four months. This time-consuming labor, as well as delays, makes CATCH a very expensive tracking system. Studnicki et al. (2002) note that longitudinal trend analysis may not even be possible with CATCH. Hence, reengineering the data collection methods and building data warehouses to enhance CATCH may increase its process efficiency. The vision for the future is a state-of-the-art relational data warehouse, which must include the use of open network architecture, integrated and robust hardware, and an intelligent interface. Developing dataware to focus on capturing data from the various sources electronically, so that these data can be used to develop a set of CATCH indicators, is a critical next step. The intent is to use the information to establish and maintain a broad strategic view of the community's health status and the various factors that influence that status.
PAPNET
Cervical cytology has been advanced through the development of PAPNET, a computer-assisted screening program to assess cervical smears (PRISMATIC Project Management Team, 1999). The PAPNET system uses neural network–based artificial intelligence to present images of the cells that have the most abnormal appearance to public health screeners in a convenient and interactive fashion. PAPNET software has huge potential; the aim is to decrease screening errors and improve overall screening productivity. This is a clear example of how e-public health technologies can not only improve but also speed up needed interventions.
PAPNET is a health decision support system (Tan with Sheps, 1998) that moves away from legacy public health systems. Since the advent of mass screening programs in the 1960s, pap smear screening has remained unchanged. Screeners must examine countless normal smears just to identify a few abnormal ones. The use of microscopic slides makes the task an even more difficult, highly skilled, and time-consuming process, prone to both false negative and false positive results. The introduction of PAPNET changes the entire process. The system is first used as a primary screening method, in which the neural networks classify routine cervical smears either as negative or needing further screening. Human screeners can then focus on a much smaller set of smears to pick out the abnormal ones.
In a multicenter trial conducted in the United Kingdom to evaluate the screening of cervical smears on PAPNET compared with conventional primary screening, PAPNET-assisted screening showed significantly better specificity, identifying 77 percent of negative smears, while conventional screening identified 42 percent of negative smears. Not only was PAPNET more effective in identifying negative smears, but the system did so at almost three times the speed of conventional screening methods. Specifically, the study demonstrated that PAPNET's total mean time for screening and reporting was 3.9 minutes per smear, as opposed to 10.4 minutes per smear with conventional screening methods.
FluNet
Because our physical environments are constantly being attacked by an increasing number of hazardous and infectious viruses, it is important that we remain aware of virus activity in different parts of the world. FluNet, an Internet-based global surveillance system, is a critically valuable e-public health information system. The WHO developed the application to link its global network of influenza centers. The purpose of FluNet is to serve as an early alert system and to provide real-time epidemiological and virological information. Designated users enter data via secured access; the information is made available to the public through the Internet and thus must be easy to read and use. FluNet's displays are very flexible; information can be presented in a variety of formats, including graphs, maps, tables, and text. Information can also be downloaded and printed.
FluNet demonstrates the power of a global e-surveillance tool. Eighty-three countries work with the WHO through a network of over one hundred national influenza centers. to detect any new virus with pandemic potential—for example, the HIV/AIDS virus. Designated users can submit data, such as influenza activity and viral laboratory results, electronically via secured access; others can send information by e-mail or by fax to ensure up-to-date reporting from networks without FluNet access rights. FluNet then aggregates the data and provides summary statistics based on the analysis. Epidemiological activity and virological results are reported by geographical area for different periods of time. The information gathered by FluNet is also used to determine vaccine composition (Flahault and others, 1998).
Travelers moving from one major city to another may carry influenza viruses without knowing it—that is, even if they do not develop the familiar flu symptoms. Hence, it is easy for contagious viruses to spread from one country to another. It is obvious that FluNet cannot include data that are not available or simply not reported because the effects are not apparent until a breakout occurs. Thus, underreporting of influenza is a limitation of FluNet.
The FluNet system needs to establish some form of standard reporting of incidents and effects of contagious virus infections. Unfortunately, data are reported differently in North America than in Europe or Asia. There are no harmonizing links between the different systems, although FluNet's real-time feedback, which shows patterns of influenza, especially if it is linked with other information such as weather patterns, might provide researchers with clues to the mechanisms of outbreaks. To ensure the speed of reporting and access to FluNet, a mirror application duplicates all reported developments on a separate computer, which reduces waiting time during epidemics.
E-TECHNOLOGIES FOR PUBLIC HEALTH SURVEILLANCE AND PREPAREDNESS
In this section, we introduce the key e-technologies that are currently being applied to aid public health preparedness and surveillance.
GIS-Related Technologies
In recent years, geographical information systems (GIS) and associated technologies have been touted as transformational technologies that will facilitate beneficial changes in public health care and improve the speed, quality, cost, and accessibility of public health information and services. Like telemedicine, GIS-related technologies promise to conquer the challenges of space and place (Ricketts, 2003). These computer-based systems integrate and analyze geographically referenced data and comprise a set of tools that enable the collection, storage, manipulation, representation, and modeling of geographically referenced information (Cromley and McLafferty, 2002).
With GIS-related technologies, the physical locations of data items can be identified and presented in relation to various spatial references—for example, coordinates and elevation, geographical boundaries, or transportation arteries. GIS data sets can pertain to population health statistics and trends, community health immunization programs, and emergency or non-emergency health events or incidents. Coordinates (for example, longitude and latitude positioning) and elevation may be coded by means of geographical positioning technology via satellite or other means. Geographical boundaries may be defined by ZIP codes, school districts, census tracts, block groups, or counties, among others. Transportation arteries, of course, may be mapped by specific highways and roads. This mapping information will be crucial in readiness assessment, preparedness planning, and communication with the public.
Among the significant GIS-related technologies for public health preparedness and surveillance are data warehousing and data mining as they are computer-based and reference massive spatial data that need to manipulated, mined, and analyzed. A data warehouse can be of enormous benefit in clinical research, quality improvement, and decision support by enabling quick and efficient access to information from legacy systems and departmental databases. Covvey (2001) distinguishes an administrative data warehouse (ADW) from a clinical data repository (CDR) by the difference in the use of the two: the ADW is used for management decision making and the CDR for clinical decision making. While these systems both collect, retrieve, analyze, and present health data, the ADW may include clinical, operational, and financial data. Some authors and vendors use these terms interchangeably.
Education of public health students and researchers in e-technologies plays an important role, but other factors also lead to the successful implementation of a data warehouse system. Schubart and Einbinder (2000) specify what “successful usage” means, using concepts such as productivity, user acceptance, usability, and technical adequacy or system flexibility. Interviewing staff and end users, they found a difference between initial and continued use of the data warehouse. Initial use, as predicted, is affected by users' proficiency in computer applications, standard coding, and data retrieval, but continued use requires more: the availability of new information not available elsewhere. It is also important to distinguish between different types of users. For example, physicians and administrators may want and need different classes and types of information, while analysts, who might shape the question, retrieve the data, and clean them up or change the reporting format, may need a totally different set of data. Ultimately, an organizational culture must support the use of a data warehouse to make it effective at producing rich information for a wide variety of users.
Unfortunately, about 40 percent of e-health data warehouse implementation projects fail outright, and up to 85 percent fail to satisfy their owner's objectives. The underlying reason appears to be that data are often collected without a clear understanding of how they are to be applied. Prior to the data gathering and mining process, key questions to be answered include which population cohorts are to be studied, what the specific characteristics are of these cohorts, and what population-related analytic patterns are to be investigated. As well, many components are required, with specific interfaces needed for different queries; the questions that each user poses are varied and often complex. Covvey (2001) describes the creation of an ADW as a project to be approached “with some trepidation.” He suggests two options for organizations planning to develop an ADW. One is to design their own components, starting by addressing the needs of the end user; primary considerations in the initial design would include indicators, processing and display of information, data organization, and how to get clean, consistent data from the feeder system. A second option is to acquire a preset, generic ADW and make customized modifications.
Data mining is the main reason for acquiring a data warehouse. Data mining involves identifying valid, novel, potentially useful, and ultimately understandable patterns in data; it is a knowledge discovery methodology for working with large databases. A variety of technologies, including neural networks, decision trees, and rule induction, are used to predict and to explain the rationale underlying unusual temporal patterns in the data. When the data are incomplete, imprecise, or redundant, they can be improved by using “rough set analysis” to find underlying relationships among data elements (Tan with Sheps, 1998).
Brossette and others (1998) report the use of data mining techniques to develop a public health surveillance system that was able to identify the occurrence of an infection and anti-microbial resistance in a hospital in Birmingham, Alabama. For instance, epidemiologists are often interested to find out if there may be some socioeconomic, cultural, or environmental factors affecting or causing the emergence of specific diseases in a particular neighborhood, such as a high rate of cancer due to poverty, unhealthy lifestyle practices such as smoking, or the presence of radioactive substances nearby. Such relationships are often hard to detect and require careful studies of correlations among massive amount of data and uncovering of interrelationships among seemingly unrelated variables. In many cases, such investigations could be performed efficiently using data mining techniques such as clustering methods to search for hidden patterns that are yet to be discovered. Epidemiologists may find this technique useful in identifying unusual disease clusters. The e-health records (EHRs) discussed in the previous chapter are an important component of data mining—for example, when integrated by a master patient index to allow record sharing across different settings or regions (Maheu, Whitten, and Allen, 2001). The applicability of data warehousing, EHRs, and data mining techniques to the field of public health lies in their combined ability to track the global spread of disease, to aid in the development of targeted prevention programs, and to examine the efficacy of ongoing public health research by exploring relationships among a large number of seemingly unrelated variables to discover hidden patterns and knowledge.
Figure 5.1 depicts a simplified model of the infrastructure of an e-public health information system.
FIGURE 5.1. MODEL OF AN E-PUBLIC HEALTH INFORMATION SYSTEM
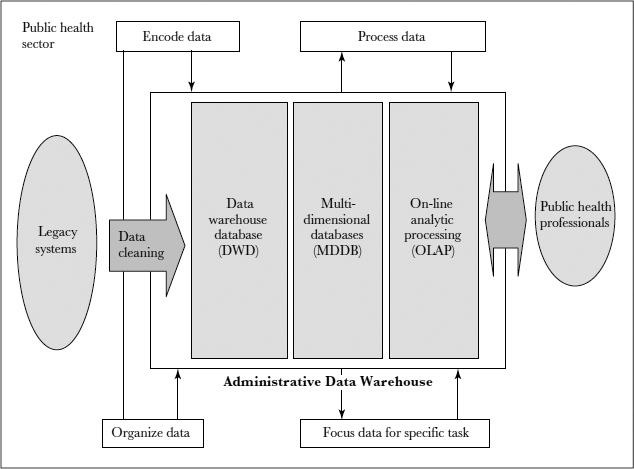
Figure 5.1 provides a model of an e-public health information system that combines the concepts of data warehousing, data mining, and on-line analytic processing (multidimensional data aggregation and data analysis for online queries) of the collected data into trends and patterns, information that is used to alert the public on epidemics or other threats. Data mining techniques have also been used to understand provider behavior, to explain why clinicians choose one treatment over another, and to uncover patient choice patterns related to compliance with medications. Pharmaceutical companies and other vendors also see data mining as a tool for marketing specialty products by detecting patterns of Web use behavior among online purchases and determining product mix.
Epidemiological Surveillance and Public Health Preparedness
Epidemiological surveillance is concerned with the determinants, distribution, and control of potential health hazards, while public health preparedness surveillance encompasses a series of biosecurity measures that can be taken before an emergency, and the subsequent routine collection of potential risk or hazard information. Biodefense efforts can be strengthened by the combined use of emerging GIS-related technologies and health resources repositories including various sources of health related databases (such as EMRs, MEDLINE, epidemiological databases) as well as those pertaining to health facilities and workforces. These e-technologies can also be used to plan and monitor ongoing syndromic or epidemiological surveillance. During biosecurity emergencies, prompt response and deployment of first responders including police, firemen, and public health providers are vital tasks. E-public health information systems that combine GIS-related and data management technologies can identify critical community assets, potential impacts that warrant heightened alert or evacuation, and risks and hazards that require timely mediation.
Preparedness activities, as defined by the Centers for Disease Control and Prevention, include identification of suspected acts of bioterrorism, planning emergency activities in advance to ensure a coordinated response, building response capabilities, identifying the type or nature of an event when it happens, implementing the planned response quickly and efficiently, and recovering from the incident (Centers for Disease Control and Prevention, 2001). GIS-related technologies have been employed for years in response to natural disasters, including earthquakes, tornadoes, wildfires, and hurricanes. Only recently has the potential of these technologies been realized in addressing public health preparedness.
In preparation for emergency response efforts, the federal government created the National Spatial Data Infrastructure by executive order in 1994, in order to encourage geospatial data acquisition and access. The initiative provides an unprecedented mechanism to support GIS-related applications in public health preparedness and response. Applying GIS-related technologies in biodefense may also help fulfill the CDC's objectives of upgrading state and local public health jurisdictions' preparedness for and response capabilities in case of bioterrorism, outbreaks of infectious disease, or other public health threats and emergencies. Use of GIS-related technologies will enable preparedness efforts in the CDC's “Healthy People 2010” priority areas, which focus on immunization and infectious diseases, environmental health, public health infrastructure, and surveillance and data systems (Centers for Disease Control and Prevention, 2001). Objective 23–3 of Healthy People 2010 seeks to increase the proportion of major national, state, and local health data systems that use geocoding. The current baseline indicates that in 2000, 45 percent of major national, state, and local health data operations had records geocoded to street address or latitude and longitude. The CDC set a target of 90 percent geocoded health data by 2010.
GIS-Related Technologies for Emergency Preparedness and Bioterrorism
Among university researchers, GIS-related technologies have been widely used for years in understanding disaster management. In two recent publications addressing the application of GIS-related technologies to preparedness for and responses to bioterrorism, a committee of the National Research Council advocated the integration of GIS into disaster preparedness infrastructure. The committee recommended further research into development of digital floor plans and maps of other physical structures (Science and Technology for Countering Terrorism: Panel on Information Technology, National Research Council, 2003). It was suggested that the resulting data could be stored in geospatial information systems, which would allow responders to focus on high-probability locations of missing people (such as lunchrooms) and avoid dangerous searches of low-probability locations (such as storage areas). The committee recommended research in wearable computers for search-and-rescue operations, so that responders could update GIS software in real time as they discovered victims and encountered structural damage (Committee on Science and Technology for Countering Terrorism, National Research Council, 2002). In practice, the past few years have also seen personal digital assistants and remote sensing technologies used in disaster relief.
Consider this example of how GIS-based equipment can help in an emergency. In the first four days of the rescue attempts in New York City after the World Trade Center attacks on September 11, 2001, no GIS equipment was available. Rescue workers had to create maps on cardboard or use shopping guides to draw maps of unstable buildings. Once GIS equipment and related software arrived, people from the Federal Emergency Management Agency were able to create maps of the World Trade Center site and lower Manhattan that ranged from simple maps showing locations of command posts, first aid centers, and food stations to others depicting hazards such as lingering fires and debris hanging from buildings (“Mapping the Hazards to Keep Rescuers Safe,” 2001). GIS-related techniques that are usually used to determine structural soundness after earthquakes were applied to the World Trade Center area for rapid assessment of the surrounding structures (Nishenko, 2002). Having participated in the search and rescue effort in New York City, one specialist reported that GIS and location-based technologies were used extensively and proved extremely valuable (Kevany, 2003).
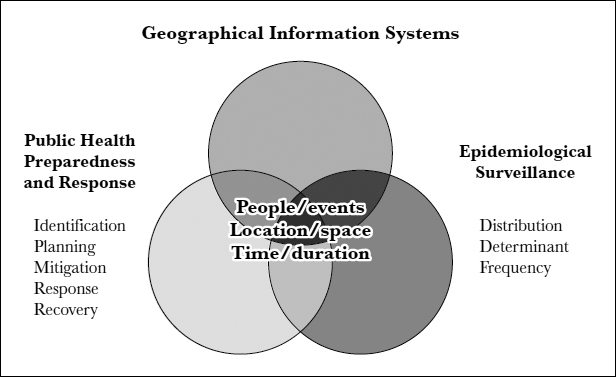
Both GIS-related technologies and public health surveillance are concerned with the spatial and temporal dimensions of public health problems. What is important is how human beings are represented in both dimensions when events unfold. Figure 5.2 illustrates these convergent interests. For example, in an event that raises biosecurity concerns, mission-critical challenges would be to identify the epicenter and boundaries of the event, understand the available resources, identify the affected populations and characteristics of the communities, and, of course, avoid potential hazards in a timely manner. Transportation intelligence, such as knowledge of major arteries and roads surrounding the event, would afford valuable information on how to reach vulnerable populations. Providing authorities with this critical information gives them the intelligent decision support they need in order to make informed actions and choices.
Although many recent experiences have indicated that GIS-related technologies will prove useful in disaster preparedness and relief, there is still a lack of literature examining their functional components and their application to public health surveillance and bioterrorism preparedness. The next sections show how GIS-related technologies can meet the needs of public health surveillance and illustrate how GIS-related technologies can be applied to support public health emergency preparedness, particularly biodefense preparedness efforts in specific targeted areas.
FIGURE 5.2. THE CONVERGENCE OF GEOGRAPHICAL INFORMATION SYSTEMS, PUBLIC HEALTH PREPAREDNESS AND RESPONSE, AND EPIDEMIOLOGICAL SURVEILLANCE
GIS-Related Data Management for Emergency Preparedness
According to an informatics model suggested in Tan (1995, p. 12), a basic health information processing system includes at least the following components: data acquisition and verification (data input); data storage, classification, computations, and update (data management); and data retrieval and presentation (data output). GIS-related technologies can meet these requirements and are well positioned to transform data into meaningfully stratified information, making the transition from aggregated information to valuable and strategically organized knowledge.
As part of an e-public health information system or application, GIS-related technologies can support direct or indirect (data extracted from available secondary sources) data input and verification from either a desktop computer or a Web-based browser that interfaces with a data storage system, which may be a data warehouse or a suite of databases. At least four data categories may warrant inclusion in a GIS-related application for use in biodefense preparedness.
- Assets data
- Data on hazard sites
- Data on transportation routes and utility networks
- Data on free space
Assets data are data groupings that identify priority areas to be protected or used—for example, population attributes, locations, repositories, facilities, and response teams. Some important population attributes include density of residents; subpopulations by age, race, and ethnicity; and vulnerable populations or their locations—for example, senior citizens, nursing homes, school districts, and non–English-speaking ethnic communities. Specific location data would include locations of health facilities, beds, and surge capacity; laboratories, pharmacies, and veterinarians; National Pharmaceutical Stockpile locations; emergency vaccine and drug administration locations; predesignated vaccine repositories; and waterways, including boundaries, flood plains, treatment plants, pumping stations, well locations, emergency water supplies, water towers, and reservoirs; public facilities; emergency management supplies; and community services and response teams, including fire departments and command centers. Data on hazard sites identify the priority areas to mediate or avoid, such as radiological sites. Data on transportation routes and utility networks can identify, for example, areas in service, restricted areas, or areas under construction. These data would be used for response actions, such as triage, relief, or evacuation. Finally, free space data would be critical in specifying locations for loading and unloading of emergency supplies, parking space, and temporary setup of safe and secured shelters.
For data management, GIS-related technologies will allow various users to manipulate data, perform data processing functions such as inserting data, updating entered data, appending new data to original data sets, or deleting stored data. Data mining methodology has powerful abilities to rotate, dice, and cluster “cleaned” data sets to reveal new knowledge, discover hidden patterns, or unveil general trends. Many sophisticated analytical methods and statistical techniques can be applied in data mining. As long as the captured data can be properly cleaned and verified, organized information can be managed and transformed into valuable knowledge for emergency response teams, including police, firefighters, and community leaders.
GIS output data can be aggregated, reformatted, mapped, and disseminated. The classes of output data specific to GIS-related representations and analysis include at least five major categories:
- Geocoded events
- Choropleth maps
- Buffer zones
- Network analysis
- Overlay analysis
Geocoded events refer to “pinned” maps (think of a map display with a pin indicating the location of each event) that indicate hot spots or display spatial patterns of affected areas or regions. This can be used to present thematic maps such as geo-coding the most intensely affected areas that describe a geographically referenced event. A choropleth map shows areas or regions that have the same characteristics, using color coding or shading to represent the magnitude of measures or indicators. Answers to spatial queries about specific affected locations, such as schools, nursing homes, and other public or community facilities, can be represented with spatially color coded or geographically referenced information. Buffer zones are represented by concentric circles or polygons that define the anticipated or actual scope of impact (exposure) and associated or corresponding response time. Network analysis can provide useful information to help determine travel time and the shortest routes available for rescue, evacuation, or other purposes. Overlay analysis can result in two forms of displays: point-in-polygon maps, which display whether data with specific attributes (such as incidence of a disease) fall within a certain circumference, and polygon-overlaid maps, which can be used to create a new map layer encompassing two or more existing layers.
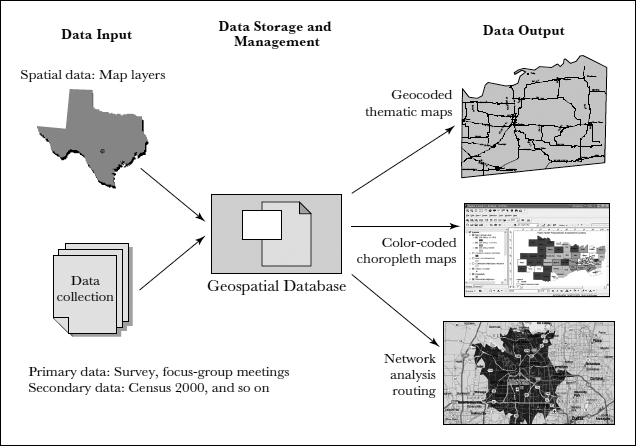
Figure 5.3 presents an expanded GIS-enabled e-health technology framework, including data input, data management, and data output functions.
FIGURE 5.3. AN INTEGRATED GIS-BASED PUBLIC HEALTH PREPAREDNESS SYSTEM
In generating guidelines for the application of ICT to biosecurity in 2001, the CDC produced a report describing the ICT functions and specifications for public health emergency preparedness and bioterrorism (Centers for Disease Control and Prevention, 2001). A GIS-enabled public health information system has substantial potential to fulfill all the functions and specifications provided by the CDC. For example, GIS-related technologies can use electronic clinical data for event detection, use data mining methodology to investigate possible hazard diffusion patterns, and manage and process electronic data from care systems at clinical care sites and laboratories.
For data analysis and visualization, GIS-related technologies can analyze, display, report, and map accumulated data from other public health partners and share data and technologies for analysis and visualization. A detailed list of GIS-related technology's ability to fulfill the CDC requirements is presented in Table 5.1.
The application of GIS-related technologies to public health preparedness is a classic example of how an e-public health information system could transform the future of public health preparedness and surveillance: in data acquisition, GIS-related technologies could enhance traditional data collection efforts, allowing rapid needs assessment; in data storage and output, the use of a geospatial metadatabase will permit both primary data (such as needs assessment data collected from the field) and secondary data (such as census data) to be stored in a central relational database repository or, more likely, a data warehouse, either of which would allow the data to be mined and displayed in various ways.
TABLE 5.1. TAN'S HEALTH INFORMATION PROCESSING SYSTEM AND CDC-PROVIDED INFORMATION TECHNOLOGY SPECIFICATIONS FOR EMERGENCY AND BIOTERRORISM PREPAREDNESS
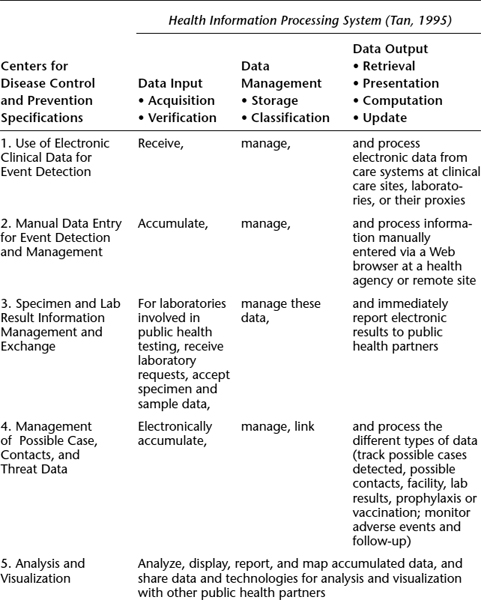
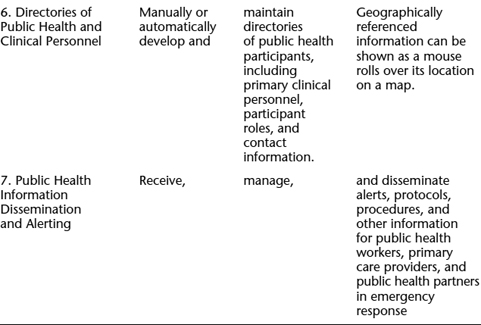
Sources: Adapted from Centers for Disease Control and Prevention, 2001, and Tan, 1995.
A metadatabase (data about data), describes the content, quality, condition, and other characteristics of data. It refers to the federally mandated open geographical data structure that was approved by the Federal Geographic Data Committee. The open data warehouse structure will allow authorized agencies to query, present, and analyze the data for public health preparedness and response purposes.
A GIS-Enabled System for Health Surveillance and Epidemiological Rapid Assessment
Rapid public health assessment quickly determines public health needs in affected areas after disasters such as floods, bioterrorism, or toxic exposures. It can help determine the boundaries of affected areas; the duration and intensities of exposures; water and food supply disruptions; risks for various subpopulations; zoonotic disease risks; and the need for short-term health measures or quarantines. Rapid public health assessment can also be a point of departure for communicating public health advice and investigating longer-term health effects. A rapid assessment may be undertaken immediately after or even during an event, or it may be done as a preparedness or preventive measure. The assessment usually consists of identification of the area that is affected or could be affected, followed by a sampling scheme, and then the rapid assessment coordination. In this sense, GIS mapping technology can coordinate the communications among multiple first responders of where and how the affected area would be optimally secured for managing and containing the hazards.
GIS is central to providing maps of factors affecting the event area in response to emergencies. The CDC has identified seven key components, or focus areas, that are necessary for a comprehensive public health response:
- Focus Area A: Preparedness planning and readiness assessment
- Focus Area B: Surveillance and epidemiological capacity
- Focus Areas C and D: Laboratory capacity—specifically, biological and chemical agents
- Focus Areas E and F: Risk communication and health information dissemination
- Focus Area G: Training and education
How a GIS-enabled rapid assessment system can address CDC public health preparedness focus areas is discussed next.
A GIS-supported preparedness plan could assess preparedness by either geographical area or jurisdiction and provide logistical support for program planning, implementation, and quality assurance. As described earlier, GIS-related technologies can produce preparedness data inventories and thematic maps to assist in assessing the level of preparedness and offering strategic recommendations for coordination and resource allocation. The system can provide enhanced mapping and visualization of complex and changing data, coupled with spatial analysis that affords heads-up, nextstep information for preparedness and response planning.
Obviously, such an e-public preparedness system can be used for ongoing surveillance of community health. The geographical characteristics of such data systems make it useful for
- Disease surveillance and reporting
- Sentinel measures: data from doctors, hospitals, pharmacies
- Early location of syndromes in space and time: detection of symptom and case clusters; identification of exposure sources; early detection of biological, chemical, or radioactive events
- Aiding issuance of health warnings and precautions
- Disease outbreak mapping; rapid assessment mapping
- Incidence and prevalence mapping in relation to health care locations or special populations; exposures and risk factors
In preparedness planning, GIS-related technologies can link databases containing updated data from various sources, as discussed previously. Having this repository of data at the preparedness stage makes a rapid assessment possible. In turn, this facilitates accurate forecasting of casualties and other public health needs for various scenarios. GIS-enabled activities can provide logistical support in reviewing surveillance systems, enhancing syndromic early alert capacity, contributing to regional efforts in training of health care providers and in developing an emergency decision support system (EDSS).
The EDSS can be supported by the GIS data collection and rapid assessment activities. Data collection includes geocoded, systematic syndromic surveillance data, which can be saved in GIS-compatible metadatabase format. Geographically coded metadata can be shared and used to conduct data analysis and produce maps across multiple platforms and agencies. In short, the health data saved in such a structure will be readable by most GIS software including the CDC's EpiInfo 2002 and EpiMap, the mapping component of EpiInfo 2002. Metadata products can include preparedness-related relational databases, thematic maps, and educational components for regional training activities.
Rapid assessment can be conducted by using geospatial analysis and epidemiological surveillance. Indeed, a rapid assessment may merely be an accelerated and focused step in routine disease surveillance. Using GIS in routine disease surveillance can facilitate the fine-tuning of geographical health analysis in an epidemiological surveillance activity. GIS-related technologies facilitate rapid identification of high-risk areas and populations; staff can develop expertise in this activity for risk identification and mitigation.
GIS-enabled activities can maintain geographically referenced databases of laboratories, including staffing personnel, capacity of internal and external proficiency testing, and other preparedness data. First, mapping changing capabilities and contact information will be extremely important to monitoring overall laboratory readiness. Second, in an emergency such as the anthrax attacks of 2001, a system that can locate where samples have been sent and where they are being processed will be extremely important. As well, GIS-related technologies can identify the populations in the catchment areas of hospitals, assessing the hospital's bioterrorism response capabilities (for example, isolation wards, decontamination units, personnel) and combining these data with information on the populations the hospital serves. GIS-related technologies work effectively in locating resources for use in cases of environmental exposure—for example, mapping where chemical assays are being conducted within the state and where advanced biomonitoring and testing can be obtained in a crisis. The databases will support health authorities in implementing triage procedures to prioritize intake and testing of specimens (samples) before analysis.
The combination of health information and geographical data in one analytical tool is still new for much of public health. In a public health emergency, geography assumes more importance because of limited mobility and the physical immediacy of health threats. The strength of GIS-related technologies in these situations is exemplified by rapid assessment—for example, determining which hospitals have both isolation units and certain kinds of laboratories, or determining from age distributions in census tracts the best school locations from which to administer vaccinations for vulnerable age groups. Where information is lacking on, for example, the prevalence of acute disease symptoms, GIS-facilitated rapid assessment can help professionals design a logical sampling scheme based on population density and proximity to an event.
In an emergency, risk communication is particularly important for communities with predominantly non–English-speaking populations. For this purpose, geographically referenced (mapped) information holds promise for helping to bridge language and semantic barriers in communications. Several schools of public health, the CDC, and large metropolitan areas and health departments have developed risk communication pre-messaging programs, in which messages in different languages are created in advance for use in case of emergency. As programs are developed, a repository can be created. A geographically referenced repository of risk communication tools will be critical to the preparedness effort. A GIS-enabled inventory can provide information on where these programs are and where they are needed and monitor the process of dissemination.
Finally training and education is critical if GIS-related technologies are to be used successfully. Currently, there is an apparent lack of expertise among organizational users including governmental agencies and first responders on the use and applications of GIS-related technologies to real world problem solving. These technologies provide useful insights into spatial data relationships and allow massive amount of data to be mined simultaneously. Many universities conduct courses and research in geographical information systems. Most of these courses are either offered by the geography department in collaboration with computer science, library science, or information systems. Public health scientists and professionals alike will therefore benefit significantly from acquiring expertise and skills in GIS-related technologies.
Conclusion
In a field exploding with possibilities, there are many challenges to conquer before the vision of an integrated, accessible, and accurate e-public health information system becomes a reality. Three areas represent major challenges to e-public health informatics: (1) developing coherent and integrated national and international e-public health information systems; (2) developing a closer integration of public health and clinical care; and (3) addressing pervasive concerns about the effects of information and communication technology on confidentiality and privacy, as discussed in Chapter Four. Beyond this, the hope is that we can apply e-technologies in unanticipated ways to remake public health and create new ways to protect and promote community health. In particular, aside from the promotion of health and the prevention of unnecessary disease, injury, and disability, there are unexplored and unimagined ways of harnessing the power of ICT to transform the way we as members of society take care of one another—for example, in public preparedness against bioterrorism and biohazards.
More than anything, the future of e-public health informatics is about globalization and a safer environment for all populations. The World Health Organization is committed to the measurement of health outcomes, using internationally agreed-on indicators at the level of populations (for example, community level), so comparisons of the value of specific strategies can be made. The U.S. government is focusing its public health efforts primarily on preparedness and surveillance for bioterrorism and other similar threats. Meeting the decentralized information needs of all stake-holders demands an excellent e-public health information system. Health needs, not the market, should drive the acquisition of technology. Given the difference in health care budgets among various stakeholders, collaboration among stakeholders is essential. As a group, they can take advantage of economies of scale to demand compatibility, open architecture, competitive prices, and pilot applications. The applications of e-public technologies may provide an interesting model for public health informaticians to watch and learn from in the future.
Chapter Questions
- How can public health benefit from e-health informatics concepts? What are the barriers in introducing e-health informatics concepts in public health?
- Differentiate legacy systems from e-public health information systems. Compare CATCH, PAPNET, and FluNet.
- How can GIS technologies help with public health preparedness and surveillance?
- Imagine that you are planning to visit a country that is experiencing an epidemic of avian flu. Travelers returning from affected countries are being screened, and you don't want to be stopped at customs or to be quarantined. What steps can you take to ensure that you are safe and that you will be able to get through customs quickly on your return trip? Where would you look for information?
References
Adams, M. (2000). Validity of birth certificate data for the outcome of the previous pregnancy, Georgia 1980–1995. American Journal of Epidemiology, 154(10), 883.
Brossette, S. E., Hardin, J. M., Jones, W. T, Moser, S. A., Sprague, A. P., & Waites, K. B. (1998). Association rules and data mining in hospital infection control and public health surveillance. Journal of the American Informatics Association, 5(4), 373.
Centers for Disease Control and Prevention, U.S. Department of Health and Human Services. (2001). Public health response to biological and chemical terrorism. Atlanta, GA.
Committee on Science and Technology for Countering Terrorism, National Research Council. (2002). Making the nation safer: The role of science and technology in countering terrorism. Retrieved from http://search.nap.edu/terror
Covvey, H. D. (2001). What's a data warehouse? Health Care Information Management and Communication, 15(3), 36.
Cromley, E. K., & McLafferty S. L. (2002). Geographic information systems: GIS and public health. New York: Guilford Press.
Flahault, A., Dias-Ferrao, V, Chaberty, P., Esteves, K., Valleron, A., & Lavanchy, D. (1998). FluNet as a tool for global monitoring of influenza on the Web. Journal of the American Medical Association, 280, 1330–1332.
Hardiker, N., Hoy, D., & Casey, A. (2000). Standards for nursing terminology. Journal of the American Medical Informatics Association, 7(6), 523–528.
Kevany M. J. (2003). GIS in the World Trade Center attack: Trial by fire. Computers, Environment and Urban Systems, 27(6), 571–583.
Kirby, R. (2001). Using vital statistics databases for perinatal epidemiology: Does the quality go in before the name goes on? American Journal of Epidemiology, 154(10) 889.
Koo, D., O'Carroll, P., & LaVenture, M. (2001). Public Health 101 for informaticians. Journal of the American Medical Informatics Association, 8(6), 585–597.
Maheu, M., Whitten, P., & Allen, A. (2001). E-health, telehealth, and telemedicine: A guide to start-up and success. San Francisco: Jossey-Bass.
Mapping the hazards to keep rescuers safe. (2001, October 4). New York Times Retrieved from http://www.nytimes.com/2001/10/04/technology/circuits/04MAPS.html?ex=100315>%201502&ei=1&en=204ee22d59ff49ea
Nishenko, S. (2002). Critical infrastructure. Presentation at the Natural Disasters Roundtable Forum on Countering Terrorism: Lessons Learned From Natural and Technological Disasters, Washington, DC.
Pinner, R. (1998, July–September). Public health surveillance and information technology. Emerging Infectious Diseases, 4, 462–465.
PRISMATIC Project Management Team. (1999, April 24). Assessment of automated primary screening on PAPNET of cervical smears in the PRISMATIC trial. Lancet, 353, 1381–1385.
Ricketts, T. C. (2003). Geographic information systems and public health. Annual Review of Public Health, 24, 1–6.
Riegelman, R., & Persily, N. (2001). Health information systems and health communications: Narrowband and broadband technologies as core public health competencies. American Journal of Public Health, 91(8), 1179–1183.
Saunders, P., Mathers, J., Parry, J., & Stevens, A. (2001). Identifying non-medial datasets to monitor community health and well-being. Journal of Public Health Medicine, 23, 103–108.
Schubart, J., and Einbinder, J. (2000). Evaluation of a data warehouse in an academic health sciences centre. International Journal of Medical Informatics, 60, 319.
Science and Technology for Countering Terrorism: Panel on Information Technology, National Research Council (2003). Information technology for counterterrorism: Immediate actions and future possibilities. Retrieved from http://www7.nationalacademies.org/cstb/project_counteringterrorism.html
Seldon, C., Humphreys, B., Yasnoff, W., & Ryan, M. (2001–2002). Public health informatics. Current Bibliographies in Medicine, National Library of Medicine.
Studnicki, J., Murphy, F., Malvey, D., Costello, R., et al. (2002, Winter). Toward a population health delivery system: First steps in performance measurement. Health Care Management Review, 27, 76–95.
Studnicki, J., Steverson, B., Myers, B., Hevner, A., & Berndt, D. (1997, September/October). Comprehensive assessment for tracking community health (CATCH). Best Practices and Benchmarking in Healthcare, 2, 197–207.
Tan, J. (1995). Health management information systems: Theories, methods and applications. (1st ed.). Sudbury, MA: Jones & Bartlett.
Tan, J., with Sheps, S. (1998). Health decision support systems. Sudbury, MA: Jones & Bartlett.
Yasnoff, W., Overhage, J. M., Humphreys, B., & LaVenture, M. (2001). A national agenda for public health informatics: Summarized recommendations from the 2001 AMIA spring congress. Journal of the American Medical Informatics Association, 8(6), 535–545.
E-Profiling of Community Health Performance Indicators Case
Lee Kallenbach, Joseph Tan
During times of increasing uncertainty, gathering massive amounts of data is insufficient without the ability to transform the data into critical information and organized knowledge to support intelligent decision making and policymaking at all levels. Information technology (IT) can play a significant role in that transformation. For example, a technologically driven program for public and community health that applies software tools and analytical methods such as intelligent software, data mining, expert systems which are domain-specific health decision support systems, complex simulation and mathematical models, and geographical information systems as well as Internet and wireless technologies can contribute significantly to individual and community health and performance as measured by specific indicators, promote community health and wellness such as healthy lifestyle and group behavioral patterns, and advance our understanding of critical steps needed to improve health for all.
The field of public and community health is growing and expanding. There is great potential to combine the fields of health and medical informatics, community health care, epidemiology, biostatistics, health management, and policy research. This confluence of disciplines could improve our understanding of how best to prepare the public, particularly at the community level, to deal with everyday threats, including HIV/AIDS, obesity, cancer, congestive heart failure, diabetes, and other chronic and infectious diseases, as well as potential threats from bioterrorism and other emerging challenges, including new or mutated contagious diseases. The first step is learning how to track and monitor community health performance data electronically, which is the focus of the case example discussed here.
The goal of the Community Health Institutes (CHI) at Wayne State University, in collaboration with the Detroit Medical Center, is to produce a set of indicators for community health performance monitoring (for example, health status) based on several key criteria. These include tracking data that have the following characteristics:
- Small geographic areas (smaller than counties)
- Annual measures
- Readily available indicators
- Data available for the entire tricounty Detroit area
Background on Community Health
In communities, health is a product of many factors, and many segments of the community can contribute to and share responsibility for health protection and improvement. Changes in public policy, in public-sector and private-sector roles and accountability in health and health care, and in public expectations present both opportunities and challenges.
Performance monitoring offers a tool to assess activities in the many sectors that can influence health and wellness at the community level. Assessing performance indicators at this level via the use of available and advancing e-technologies is also an effective means of promoting both collaboration and accountability among practitioners, researchers, and policymakers in working toward better health for the entire community, especially within the framework of a community-based health improvement process. Performance monitoring relies on selection of a set of meaningful and measurable indicators to determine community health.
As a starting point in measuring the health of its community, CHI has adopted the twenty-five indexes proposed by the Institute of Medicine (IOM) in their publication Improving Health in the Community: A Role for Performance Monitoring (1997). These twenty-five indexes (see Exhibit 5.1) represent six domains of health and community information: demographic characteristics (such as age, ethnicity, education, and employment status), health status (such as infant mortality and death rates), health risk behavior (such as prevalence of smoking and obesity), health care resource consumption (such as per capita Medicare spending), functional status (such as self-reported health status), and quality of life (such as satisfaction with existing health care systems). The six domains were chosen to present a broad and inclusive picture of health and emphasize the context of community health improvement.
EXHIBIT 5.1. INDEXES FOR COMMUNITY HEALTH PROFILE
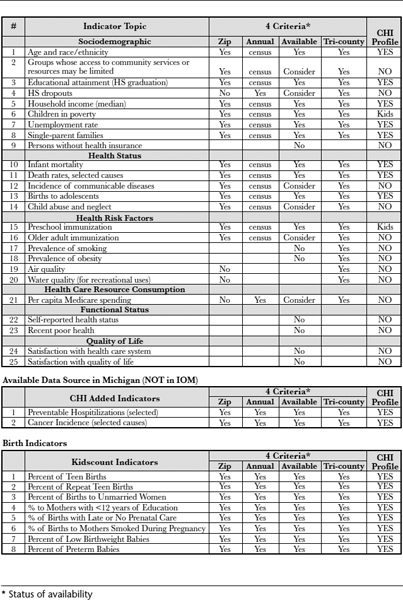
Source: Durch, Bailey, and Stoto, 1997.
In addition, other available measures (for example, cancer incidence, birth indicators, and hospitalizations) were used as CHI community health profile indicators.
Community Diagnosis
Just as a physician or other health care practitioner makes a diagnosis based on an individual's signs and symptoms, so too can a community diagnose its own signs and symptoms. The community can make sense of the collected data, using information technology to transform the data into meaningful information in order to provide a diagnosis and develop a treatment plan involving interventions at the community level.
For example, we can track the life expectancy of various population samples in different counties, townships, or communities within metropolitan Detroit, gathering data on the various indicators to see how different counties or townships perform in terms of life expectancy, infant mortality, and other measures as moderated by the variables (for example, age, ethnicity). This information can be further analyzed and aggregated in different ways to provide us with a picture of the health status and the health needs of the different counties, townships, or communities. A plan for health intervention can then be developed to improve the health status (for example, life expectancy or infant mortality) of specific counties, townships, or communities.
Selection of Profile Indicators
The indicators reported in the CHI Profile include those recommended by the IOM based on data that are readily available for the tricounty metropolitan Detroit area from existing computerized data sources. The CHI Profile also includes detail related to births that is similar to that presented by kidscount.org, which is more detailed than the IOM recommendations. In addition, the CHI Profile includes a number of measures based on data available in Michigan (cancer incidence and hospitalizations) that are not part of the IOM recommendation. Many of the indicators recommended by the IOM depend on primary data collection through household survey. These types of data are not readily available, and so such indicators are not currently included in the CHI Profile.
Geographic Areas
The intention of CHI-Mart, as of any community database, is to be flexible and to provide information aggregated into a number of different geographic representations. This is best accomplished by building larger areas from information available for smaller areas, which serve as building blocks.
Generally, while we may not be interested in units as small as census tracts, we are interested in units that have been defined as aggregates of census tracts. Unfortunately, this means that the source information is coded to census tract, which requires street address–level information. Street address information, like names, is considered to be confidential because it can be used to identify individuals. Obtaining permission to acquire confidential data can be difficult without a specific research protocol.
The population that resides in each geographic area is related to the size of that area. The validity of the health indexes presented in the CHI Profile is affected by the number of events counted in relation to the size of the population in each geographic area. The discipline of epidemiology deals with the calculation of rates of disease or events in a population. Calculating a statistically stable rate requires a population of adequate size. For common events, this can be small, but when the event is rare, the population size required can become quite large. Counts of people or major events (such as births and deaths) can be presented for areas with small populations. However, when presenting numbers for detailed subgroups (white females aged 40–44) or when examining less common events (HIV infection), larger populations are desirable. Therefore, population size affects the determination of which geographic area is best for a particular information or data characterization purpose. For these reasons, we have initially chosen to aggregate information by zip codes or groups of zip codes with populations of at least 25,000. However, some of the indexes recommended by the IOM may not have information readily available for zip codes.
Timeliness
Timeliness refers to two aspects of data collection: frequency and time from collection to report. Some of the information required to develop the IOM indexes is collected yearly; some information is collected at longer intervals; and some information is not routinely collected at all. In addition, while some information may be collected on an ongoing basis, reporting of the information might be done a number of years later. This raises issues of how meaningful the information may be, which in turn affects the value of the reporting.
Data collected every year and reported before the end of the following year are considered to be very timely. Timeliness coupled with a need for geographic specificity presents a further challenge to producing a profile that contains useful information for real-time program planning and evaluation.
Exhibit 5.2 illustrates the community health data profiling for a single geographic area covered by the CHI Profile.
The CHI Profile was produced to provide members of a community and those that offer service to a community with information to help them improve their community's health. The CHI Profile can be used by many individuals, groups, and organizations to learn something new, make decisions, or solve problems related to their community's health. Thus, there will be many different uses of “report cards,” a concept analogous to that of scoreboards. Likely users of the CHI Profile include the following:
EXHIBIT 5.2. COMMUNITY HEALTH PROFILE
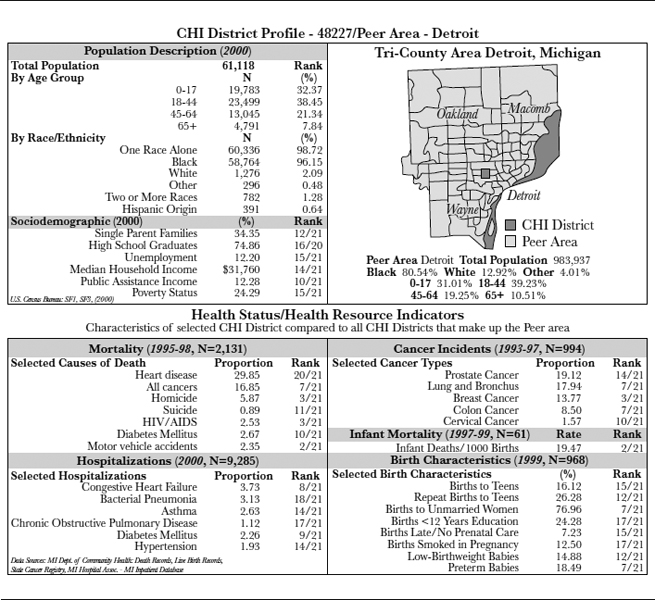
Source: Copyright © 2004 by Lee Kallenbach.
- Community members or consumers of health care: individuals, families, and representatives of neighborhoods and of larger geographical areas
- Professionals in public health, clinical care, and social services
- Professionals in fields other than health: clergy, educators, attorneys, business professionals, press and media representatives
- Community advocates and organizers
The CHI Profile provides users with measures presented as both numbers and rankings, which can aid in understanding potential problems and associations in a particular community or set of communities. The numbers and rankings presented in the CHI Profile can be used in several ways:
- To determine the health level in the area—for example, by examining beneficial social qualities and characteristics or significant diseases, injuries, disabilities, and causes of death
- To discover health strengths, problems, or needs that were not previously understood or fully appreciated, including identification of populations at risk for adverse health effects, detection of an unexpected problem or health need, and identification of unforeseen determinants of health problems
- To make comparisons, for example, among zip code areas, with the state or nation, or with an objective standard
- To establish priorities among health problems or interventions
- To bring community members together to explore, investigate, discuss, or take action on issues of interest; to build coalitions; to empower users to resolve or improve the health of individuals or the community; or to educate the community
- To influence public or private policy
Conclusion
Based on the foregoing analysis, e-profiling community health indicators can yield significant benefits to the community, although key challenges must be overcome. Stakeholders in community health profiles can make more informed choices as to health interventions needed at the community level, deciding where community resources should best be applied to significantly improve community health services, as well as uncovering particular strengths or weaknesses in order to prepare the community as a whole for potential future hazards. Timeliness of data is an issue, along with security, privacy, and confidentiality of data. Availability, accessibility, reliability, and integrity of the data to be gathered, as well as validity and meaningfulness of our reported aggregates are all challenges that continually need to be addressed. While advances in information technology promise to make data gathering and analysis less error-prone and somewhat quicker, as well as make data easier to interpret and easier to access with emerging multimedia interface technologies, ultimately, the support and acceptance and leadership of community leaders and users will be needed to move e-profiling of community health care indicators forward.
Case Questions
- What is meant by public and community health care?
- Why is e-profiling community performance indicators analogous to the concept of the scoreboards?
- What are the benefits and challenges of e-profiling community performance indicators?
- Imagine that you are asked to e-profile indicators relating to the health status and preparedness of your community for future hazards. Where and how would you begin? What criteria and indexes would you use to move the project forward?
Reference
Durch, J. S., Bailey, L. A., & Stoto, M. A. (eds.). (1997). Improving health in the community: A role for performance monitoring. Washington, DC: Institute of Medicine.