
Chapter 2
Stress Effect on Thin Films 1
2.1. Introduction
Thin films of ferroelectric materials may exhibit properties drastically different from those of massive materials. This is due to the strong structure property coupling of perovskite oxides. Indeed, the deposition of a material on a different one generates 2D stresses at the interface. These stresses make it necessary to change the modeling developed for massive materials and require the development of predictive tools dedicated to the problem of ferroelectric thin films.
To guide the synthesis of thin films and the optimization of their properties, a priori knowledge of the structure is desirable. The temperature–misfit strain phase diagrams indicate what is the most stable phase depending on the temperature and the strain imposed on the material. These diagrams have been developed for monodomain and polydomain thin films. Furthermore, the domain stability maps enable us to predict whether a thin film will be polydomain or monodomain. Together, they form a theoretical framework allowing an engineering of stresses in ferroelectric thin films.
2.2. Modeling the system under consideration
The theoretical modeling of the behavior of ferroelectric thin films follows three main pathways:
1) A phenomenological, thermodynamic description of the system in the vicinity of the phase transition through a polynomial expansion of the ferroelectric order parameter (the polarization), that is to say through the Landau Ginzburg Devonshire (LGD) theory. The macroscopic properties (in particular dielectric and piezoelectric) are considered as well.
2) Ab initio or first-principles calculations carried out at the electronic level at 0 K. These calculations are usually applied to ultrathin films as computational time increases very fast with the size of the supercell considered. It should be noted that methods based on ab initio calculations allow us to overcome some of the limitations. For example, the influence of temperature is taken into account in Monte-Carlo-type calculations.
3) Calculations based on phase-field models. These models may be used to describe the domain wall motion in a matrix with a velocity proportional to the gradient of a field. These models transcribe these problems of steep wall motion in a system of differential equations. Their numerical resolution is thus facilitated. The name “phase field” comes from the fact that a scalar-order parameter (or phase field, often noted φ) is introduced in these models. This phase field is continuous but takes different values in each phase. The domain wall is therefore represented by the range of values in which φ changes its value. It thus acquires a finite thickness.
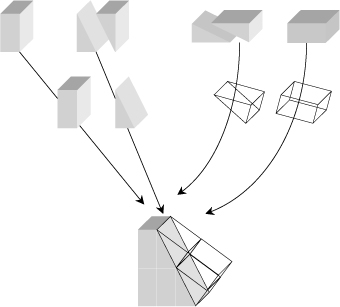
These methods are complementary and provide comparable results when they are applicable to the same system. The temperature–misfit strain phase diagram of BaTiO3 was calculated by LGD and ab initio based calculations. Both the methods give very similar results (see Figure 2.1).
We will preferentially discuss the LGD theory in this chapter. This choice is based on two reasons: (i) the thicknesses considered for the applications (100 nm and more) require prohibitive computation times for ab initio(-based) calculations and (ii) the (relative) simplicity of the expressions allows a good understanding of the specificity of the thin layers compared to the thermodynamic modeling of the bulk material.
An outline of three tools used to predict or analyze experimental results are presented in this chapter: (i) the temperature–misfit strain phase diagram for monodomain films, (ii) the domain stability map for multidomain thin films, and (iii) the temperature–misfit strain phase diagram for polydomain films.
2.3. Temperature–misfit strain phase diagrams for monodomain films
Stresses in epitaxial ferroelectric films lead to drastic changes in properties of the deposited material compared to those of its bulk counterpart. Notably, phase transition temperatures, the phases sequence as a function of temperature as well as the transitions order may be modified. To predict the properties of the film from those of the massive material, temperature–misfit strain1 phase diagrams were derived for several materials, through the LGD’s theory or from first principles. This is the case for PbTiO3 [PER 98], BaTiO3 [PER 98, DIE 04a, DIE 04b, CHO 04, LAI 05, LI 06], SrTiO3 [PER 00, PER 02], [HAE 04, HE 05], (Ba,Sr)TiO3 [BAN 02], and Pb(Zr,Ti)O3 [PER 03]. All these phase diagrams consider monodomain films. However, such phase diagrams exist for polydomain structures in which the periodicity of the domains is large compared to the thickness. The cases of PbTiO3 [KOU 01] and Pb(Zr,Ti)O3 [KUK 06] have been assessed in this manner (see p. 48).
Figure 2.1. Comparison between the temperature–misfit strain phase diagrams of BaTiO3 calculated by LGD [PER 98] (a) and by ab initio-based calculations [DIE 04a, DIE 04b] (b). The symbols used to describe the phases are defined on p. 33
Pertsev, Zembilgotov, and Tagantsev were the first, in 1998, to establish a temperature–misfit strain phase diagram [PER 98]. As their methodology is fully described in their article, we will only mention its main lines.
2.3.1. Phase diagram construction from the Landau Ginzburg Devonshire theory
The phenomenological description of ferroelectric materials is based on Gibbs free energy (i.e. free enthalpy: G = H — T S, where H denotes enthalpy, T, temperature, and S, entropy) of the massive material. Its expression2 was given by Haun et al. for an elastic cubic ferroelectric material (that is to say for small strains) [HAU 87]:
[2.1] 
where the coefficients ai are intrinsic to the material and only a1 depends on temperature. The coefficients sij are the elastic compliances of the material, σi the stresses tensor components, Qij the electrostrictive coefficients, and Pi the polarization components.
In the thin films case, strains are imposed. Therefore, a thermodynamic potential involving strains and not stresses should be selected. This is classically done by considering the following Legendre transform:
[2.2] ![]()
with ![]() , the stress tensor, and
, the stress tensor, and ![]() , the strain tensor, imposed on the thin film. The term
, the strain tensor, imposed on the thin film. The term ![]() therefore reflects the mechanical boundary conditions imposed by the substrate onthe deposited material.
therefore reflects the mechanical boundary conditions imposed by the substrate onthe deposited material.
Let us recall that we consider here the case of a monodomain thin film, orientated along the [00l] direction, deposited on a very thick substrate that is also oriented along the [00l] direction, and presenting a fourfold axis on the surface (indicating therefore a cubic or tetragonal symmetry for the substrate). The important consequence of this is that both in-plane directions are equivalent. The simplifications that follow from the system under consideration are as follows:
– the thin film surface is free, which means that no stress is applied on it (σ3,4,5 = 0);
– the strains in the plane of the interface (u1, u2 and u6) are imposed by the substrate. More specifically, the substrate imposes that the strains are equal along the directions 1 and 2 (u1 = u2) and that shear stress between these two directions is zero (u6 = 0) since the directions 1 and 2 are perpendicular.
The mechanical boundary conditions are thus written as follows:
[2.3a] ![]()
[2.3b] ![]()
where as denotes the lattice parameter of the substrate and ![]() the pseudocubic lattice parameter of the massive material defined below.
the pseudocubic lattice parameter of the massive material defined below.
The misfit strain, noted um, is then defined as the strain imposed on the lattice parameter of the material in its thermodynamic reference state:
[2.4] ![]()
where as denotes the lattice parameter that is imposed on the thin layer (here, it is one of the substrate since coherent epitaxy is considered) and ![]() the pseudocubic lattice parameter of the massive material, which is the lattice parameter of the material in its thermodynamic reference state.
the pseudocubic lattice parameter of the massive material, which is the lattice parameter of the material in its thermodynamic reference state.
For ferroelectric materials, this reference state corresponds to the paraelectric cubic state. In the paraelectric phase, the pseudocubic lattice parameter is thus simply equal to the lattice parameter of the real material. In the ferroelectric phase, this state is calculated by extrapolating the evolution of the cubic paraelectric lattice parameter in the ferroelectric phase.
It is important to note that this pseudocubic lattice parameter corresponds to that of the “parent” phase, in which the order parameter (here the polarization) is zero. It is therefore a purely thermodynamic quantity, and so is the misfit strain. The latter reflects neither the difference in lattice parameter between the massive material and the substrate (the mismatch), nor the difference in lattice parameter between the thin film and the massive material. For a more complete discussion on the misfit strain concept, see section 2.6.
These boundary conditions enable a renormalization of the thermodynamic potential, that is to say to express all the stress tensor components as a function of the other parameters and to rewrite the thermodynamic potential ![]() in a form similar to the expression of the Gibbs free energy of the massive material, that is to say:
in a form similar to the expression of the Gibbs free energy of the massive material, that is to say:
[2.5] 
The expressions of the coefficients ![]() can be obtained by identification and were given by Pertsev et al. [PER 98]:
can be obtained by identification and were given by Pertsev et al. [PER 98]:
[2.6] 
where Qij and sij denote the electrostrictive coefficients and the elastic compliances of the material, respectively.
Thus, there exists a thermodynamic potential adapted to the thin films study ![]() and its expression has been simplified by the boundary conditions particular to the symmetry of the system. In terms of the accessible ferroelectric phases the stress field reduces the symmetry of the paraelectric phase from cubic
and its expression has been simplified by the boundary conditions particular to the symmetry of the system. In terms of the accessible ferroelectric phases the stress field reduces the symmetry of the paraelectric phase from cubic ![]() to tetragonal (P4/mmm). This leads to two order parameters: a 2D one (P1, P2) and a 1D one (P3). The equilibrium states correspond to the minimum of
to tetragonal (P4/mmm). This leads to two order parameters: a 2D one (P1, P2) and a 1D one (P3). The equilibrium states correspond to the minimum of ![]() with respect to these two-order parameters. This requires that:
with respect to these two-order parameters. This requires that:
[2.7] 
It also requires that the Hessian matrix of ![]() exists and is positive so that the considered critical point corresponds to a minimum.
exists and is positive so that the considered critical point corresponds to a minimum.
This study allows consideration of the five phases that may be stable and are defined as follows:
1) the phase c, for which P3 ≠ 0 and P1 = P2 = 0;
2) the phase a3, where P1 ≠ 0, and P2 = P3 = 0;
3) the phase ac, where P1 ≠ 0, P2 = 0, and P3 ≠ 0;
4) the phase aa, where P1=P2 ≠ 0 and P3 = 0;
5) the phase r, where P1= P2 ≠ 0 and P3 ≠ 0.
It should be noted that these phases are defined by the polarization’s components; and the correspondence with the crystal systems is to be considered carefully:
– The phase c is tetragonal (P4/mm) as the ioinic displacements along the c-axis remove the inversion center.
– The phase a is orthorhombic, the polarization lies in the plane of the interface. Because of the epitaxial relation with the substrate, the in-plane lattice parameters of the film remain equal to the one of the substrate. The spontaneous strain that is induced by the phase transition affects only the out-of-plane lattice parameter, since the latter is the only one that is “free” to vary. Therefore, the lattice presents a tetragonal metric: in the plane of the interface, both lattice parameters are equal and, out-of-plane, the parameter c is different. Nevertheless, the symmetry is not tetragonal since the polarization is oriented along one of the directions of the plane. As a result, it breaks the fourfold symmetry along the c-axis and replaces it with a twofold axis along a (if the polarization is oriented along a). The symmetry of the lattice is thus orthorhombic.
–The phase aa corresponds to a polarization pointing along the pseudocubic [110] direction. The epitaxial relationship prevents the elongation of the lattice in this direction and the loss of the 90° angle in the (001) plane. The corresponding crystal system is orthorhombic (Amm2), with the following as lattice vectors (expressed in reduced coordinates and relative to the phase P4/mmm): ![]() .
.
– The polarization’s direction in the phase r lies between the directions [uuv] and [00v] in the case where u < v and between the directions [uuv] and [uu0] in the case where u > v. These two cases correspond to the space group Cm, the former case is often called MA and the latter MB. The lattice vectors are still expressed in reduced coordinates and relative to the lattice P4/mmm: ![]() , and [0,0,1].
, and [0,0,1].
To draw the phase diagram in the (um,T) plane, it is necessary to determine the minima of the free energy of each phase with respect to the polarization’s components and to compare the values of these minima to choose the phase that corresponds to the global minimum.
The study of the renormalized thermodynamic potential (equation [2.5]) allows us to determine the following:
– The order of the transition phase, from the signs of the coefficients ![]() , and
, and ![]() . The situation where the three coefficients are positive corresponds to a second-order transition. This is, in particular, the case for PbTiO3, whereas the bulk transition is of first order.
. The situation where the three coefficients are positive corresponds to a second-order transition. This is, in particular, the case for PbTiO3, whereas the bulk transition is of first order.
– The paraelectric → ferroelectric transition temperature. For a massive material, we consider that only the coefficient a1 depends on temperature (a1 = (T-T0)/2∈oC, where ∈0 denotes the dielectric constant in the vacuum and C the Curie-Weiss constant) in the development of the elastic free energy (equation [2.1]). Following the renormalization, two coefficients, ![]() and
and ![]() , depend on temperature.
, depend on temperature. ![]() loses its stability with respect to P3 when
loses its stability with respect to P3 when ![]() cancels out, that is, at the temperature T3 = T0 + 2C∈0um(2Q12)/(s11+s12). We also determine the temperature T1 at which
cancels out, that is, at the temperature T3 = T0 + 2C∈0um(2Q12)/(s11+s12). We also determine the temperature T1 at which ![]() loses its stability with respect to P1 = P2 from the expression of
loses its stability with respect to P1 = P2 from the expression of ![]() . Therefore, the paraelectric → ferroelectric transition takes place at the highest of both temperatures. It is worth noticing that the larger the um, the more the transition temperature is different from the bulk temperature. These two temperatures are only equal to T0 for um=0.
. Therefore, the paraelectric → ferroelectric transition takes place at the highest of both temperatures. It is worth noticing that the larger the um, the more the transition temperature is different from the bulk temperature. These two temperatures are only equal to T0 for um=0.
– All the expressions of the properties (dielectric, piezoelectric, etc.) of the material can be obtained by considering the derivatives of this thermodynamic potential with respect to the corresponding variable.
2.3.2. Calculations limitations
Some limitations to the calculations described above can be identified:
1) The calculations contain an implicit approximation that might influence the phase diagram. Indeed, the development of the Gibbs function (equation [2.1]) for a BaTiO3-type ferroelectric does not contain electromechanical terms of the P4σ type whose coefficients are not available in the literature [TAG 04].
2) The description of the thin film relies on the assumption that stresses are homogeneous in the film. Rather than a thin film for which strain is imposed on one of the faces, the description that is used considers that the in-plane lattice parameter is imposed throughout the thickness of the film. This description is also the one that is usually adopted for the ab initio calculations. For ultra thin films (i.e. with a thickness below the critical thickness of misfit dislocations formation), the strain caused by the breaking of symmetry imposed by the surface must be considered. For thicker films (thicker than this critical thickness), the possibility of a strain gradient along the direction 3, which will then induce a polarization gradient is to be considered. This polarization gradient would then change the phase diagram. The consideration of this gradient as well as the surface tension effects has been made [KRE 79, GLI 04]. However, the existence and the profile of this gradient remain an active area of research.
3) The considered thin films are under short-circuit, so there is no electric charge on the surface that would give rise to a depolarizing electrical field. This is the case of a thin film between two ideal metals. The consideration of the effects of space charges on the behaviors of ferroelectric thin films is also a very active research area [ZUB 06] and would shift the phase diagram, both in temperature as well in misfit strain.
4) The film is supposed to be continuous and homogeneous. In the case of columnar growth, the walls of these columns may contribute to alter the thermodynamic equilibrium of the thin film. However, below a critical density of walls, the model can still be applied.
5) The film is monodomain. In fact, this limit might be “lifted” since a thin film for which the period of the domains is large compared to the thickness of the film could be described by this theory. This description would neglect the lowering of the energy that a domain structure may enable and it would consider that the mechanical boundary conditions imposed by the substrate are valid within each of the domains. This requires, of course, being able to assess these two contributions to validate this approach. The complementary description presented in the following paragraph corresponds to a domain structure in the case where the period of the domains is less than the thickness of the film.
6) The rotation of oxygen octahedra is an effective mechanism of stress relaxation in ferroelectric materials. This mechanism is not addressed in this chapter but was applied to the case of SrTiO3 [PER 00, PER 02, HAE 04] and PbZrTiO3 [SIC 09]. It may significantly change the phase diagram, especially at low temperature.
7) The epitaxial relationship between the substrate and the thin film is perfect. This means that there are no dislocations generated at the interface and the thin film adopts the lattice parameter of the substrate. This limitation may not exist as long as the dislocations density remains constant. In fact, in this case, we can define an effective substrate whose lattice parameter is that of the real substrate altered by the dislocations density. The calculations are then carried out by considering that the thin film is in perfect epitaxy with this effective substrate.
Limitations are inherent to the design of any model. They should not be regarded as reservations to the use of temperature–misfit strain phase diagrams. They remain indeed valuable tools for the prediction of structures and therefore of properties of monodomain ferroelectric thin films. Moreover, many experimental studies have confirmed these calculations, which tend to indicate that the approximations and limitations of this model do not prevent it from being used on real systems.
2.4. Domain stability map
The temperature–misfit strain phase diagrams represent a valuable tool for the stress engineering in monodomain films. However, ferroelectric materials can adopt a domain structure to minimize their energy, in massive form as well as in thin films form. The latter usually present polydomain structures when their thickness and/or the difference of lattice parameter with the substrate becomes large. The domain stability maps present the most stable mono- or polydomain configuration for such thin layers.
We introduce in this section the computations that enable the calculation of domain stability maps for a tetragonal PbZr0.2Ti0.8O3 thin film deposited on MgO. These computations are based on the series of Thermodynamics of polydomain heterostructures articles [ROY 98a, ROY 98b, ALP 98]. The computations carried out in this section represent an extension of these articles in the case where the thickness of the thin film is not much larger than the critical thickness for domain formation and are applicable to any tetragonal material deposited on a substrate that exhibits a fourfold axis perpendicular to its surface.
The parameters used for this computation are the Poisson’s ration (ν = 0.36) and the “effective parameter of incompatibility” [ALP 98] that links the thickness t of the thin film to the critical thickness of domains formation ![]() . It is assumed that η = 0.1. In the following, by abuse of language, we will speak of “energies” that are in fact per unit length, surface, or volume energy densities.
. It is assumed that η = 0.1. In the following, by abuse of language, we will speak of “energies” that are in fact per unit length, surface, or volume energy densities.
2.4.1. Presentation and description of the framework of study
The adopted framework is the one defined by Roytburd, which is that of a laminar structure where the domains period is smaller than the thickness of the film [ROY 76], as shown in Figure 2.2. In this configuration, we consider that the domain walls’ energy is negligible compared to the energy within the domains. These structures are expected to form in thin films of a hundred nanometers or more [KUK 06].
Figure 2.2. Example of dense laminar domain structure. The domains period D is smaller than the thickness of the film
2.4.2. Main contributions to the total energy of a film
The main contributions to the total energy of a film are the following:
1) The average elastic energy ![]() corresponding to the macroscopic strain of the system. The average elastic stress originates in the difference between the lattice parameters of the material deposited and those of the substrate. In the case of a polydomain tetragonal film on a cubic substrate, the elastic energy is averaged for the two possible situations: c domains with the c-axis perpendicular to the interface and a1 and a2 domains with the c-axis in the plane, oriented along one of two main directions of the substrate. The average elastic energy is, by definition, proportional to the thickness of the thin film (see Figure 2.3).
corresponding to the macroscopic strain of the system. The average elastic stress originates in the difference between the lattice parameters of the material deposited and those of the substrate. In the case of a polydomain tetragonal film on a cubic substrate, the elastic energy is averaged for the two possible situations: c domains with the c-axis perpendicular to the interface and a1 and a2 domains with the c-axis in the plane, oriented along one of two main directions of the substrate. The average elastic energy is, by definition, proportional to the thickness of the thin film (see Figure 2.3).
2) The elastic energy due to the microstresses (emicro) that develop at the interface between the substrate and the film. In the case of a 90°domain structure, two adjacent domains exhibit different spontaneous strains (which is the direction for the c-axis in a tetragonal structure) (see Figure 2.3). In each of these domains, there are a given number of dislocations, different for each type of domain since the lattice mismatch is more or less important depending on the type of domain. These dislocations create a non-uniform microstress around them. These microstresses are localized at the interface and cover a distance equal to the domain’s periodicity D, which is equal to the stress sources distribution that have originated them, following the St. Venant principle. These are therefore short-range interactions.4 If both types of strains (average macroscopic and microscopic) are small and if it is possible to use the linear theory of elasticity, then the total energy of stresses can be written as the sum, in each domain, of the average elastic energy and the microstresses energy.
3) Domain wall energy: ewall. A domain wall indeed has an energy cost. The total energy of the domain walls is therefore proportional to their (areal) density, that is to say inversely proportional to their periodicity, D:
[2.9] ![]()
with σ the surface tension of domain walls and λ the angle between the domain walls and the interface, t denotes the film’s thickness and D the domain’s period. The coefficient 2 comes from the fact that D is the period of the system. So, there are necessarily two domain walls.
4) Finally, the energy due to the interface with the substrate Г0. The energy of a perfect interface between two similar crystalline phases is independent of the thickness and small compared to the elastic energy of the thin film, as soon as the latter is thick compared with the length defined by Г0/eM, where eM denotes the elastic energy of a domain [ROY 98a]. This length is usually on the order of a few interatomic distances [ROY 98a]. For non-perfect interfaces, microstresses are responsible for most of the energy of the interface. In the following, we will consider films that are much thicker than a few interatomic distances. So, we will neglect this contribution, even more easily than in such a laminar structure the energy contribution of the interface is considered negligible compared to the energy within the domains.
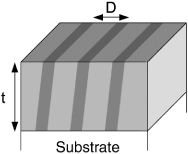
Figure 2.3. Possible orientations of tetragonal domains obtained from the cubic phase. From left to right, c domains, a1, a2. A polydomain structure a/c corresponds to the coexistence of c domains and one of the two orientations of a domains. A polydomain structure a1/a2 corresponds to the coexistence of a1 and a2 domains
Equation [2.10] summarizes the various contributions to the total energy:
[2.10] ![]()
with the notation introduced in the section.
2.4.3. Influence of thickness
In the expression of the total energy of the film, the terms that depend on the periodicity of the system are the energy due to the microstresses and the domain wall’s energy. We have seen that the energy due to the microstresses is proportional to D and that the domain wall’s energy is inversely proportional to D.
The period that corresponds to the equilibrium domain structure is obtained by minimizing the sum of these two contributions with respect to D. Thus, we have:
[2.11] ![]()
with C a proportionality constant. This gives a dependence of the period in ![]() , which corresponds to a value of the energies that depend on the period
, which corresponds to a value of the energies that depend on the period ![]() .
.
To sum up, we have: ![]() , and Г0 independent of t. For sufficiently thick films, it is therefore the average elastic energy that governs the properties of the system. So, we will consider in the following that the total energy of the system is equal to the average elastic energy.
, and Г0 independent of t. For sufficiently thick films, it is therefore the average elastic energy that governs the properties of the system. So, we will consider in the following that the total energy of the system is equal to the average elastic energy.
2.4.4. Macroscopic elastic energy for each type of tetragonal domain
For a film exhibiting a tetragonal symmetry and deposited on a substrate with a fourfold axis perpendicular to the surface (thus of cubic or tetragonal symmetry), there are three types of ferroelectric domains (see Figure 2.3). The framework is that of linear elastic theory and the substrate is considered infinitely rigid and infinitely thick compared to the film. The film is regarded as an isotropic elastic solid subjected to a biaxial stress.
The resulting elastic energies are those of an isotropically elastic solid of Young’s modulus E subjected to a biaxial stress:
[2.12] ![]()
The components of the strain tensors are function of the misfit strain:
[2.13] ![]()
as well as the tetragonality ![]() and the strain
and the strain ![]() with a and c the lattice parameters of the bulk. It is possible to take into account the presence of misfit dislocations at the interface in the expression of ∈M by considering an “effective” substrate of lattice parameter
with a and c the lattice parameters of the bulk. It is possible to take into account the presence of misfit dislocations at the interface in the expression of ∈M by considering an “effective” substrate of lattice parameter ![]() instead of the actual substrate of lattice parameter as. Table 2.1 summarizes the strain tensors for each type of domain as well as the resulting elastic energies.5 It should be noted that the sign of the misfit strain as defined in equation [2.13] is reversed compared to the one used in equation [2.4].
instead of the actual substrate of lattice parameter as. Table 2.1 summarizes the strain tensors for each type of domain as well as the resulting elastic energies.5 It should be noted that the sign of the misfit strain as defined in equation [2.13] is reversed compared to the one used in equation [2.4].
Table 2.1. Strain tensors and elastic energies due to differences in lattice parameter between the film (assumed isotropically elastic) and the substrate for each type of domains. The elastic strains involve ∈M = (a−as)/as and ![]() with ∈T = (c-a)/a. The equality
with ∈T = (c-a)/a. The equality ![]()
![]() is only valid for small strains
is only valid for small strains
2.4.5. Indirect interaction energy
A thin film can lower its elastic energy by creating a domain structure composed of two of the three types of domains.6 The transition to a polydomain state leads to a decrease in elastic energy due to the relative difference of the elastic energies of each domain. A deformation exists between two domains, under the assumption that strains remain small:
[2.15] ![]()
The corresponding energy is called the indirect interaction energy since it links each of the domains via their respective interaction with the substrate. The higher this energy, the more the system will tend to undergo a transition toward a state in which the domains are numerous. This energy can be written as follows:
[2.16] ![]()
with γ the planar tensor of the elastic moduli of the thin film. The terms for each domain structure are shown in Table 2.2.
Table 2.2. Indirect interaction energies for the different pairs of possible domains
Moreover, Δ∈ij should satisfy the compatibility relation [ROY 76]:
[2.17] ![]()
![]() is the normal to the twin plane between two domains. This yields two solutions: each couple of domains type can therefore form two pairs of domains. For instance, a and c domains can form a pair separated by an interface in a plane of type (101) or (101) (see Figure 2.4). They will be considered identical hereafter. So, there will be only three possible domain configurations: we will denote by (1,2) a structure of type a1/a2/a1/a2, and (1,3) and (2,3) the structures of type a/c/a/c (which means a1/c/a1/c and a2/c/a2/c).
is the normal to the twin plane between two domains. This yields two solutions: each couple of domains type can therefore form two pairs of domains. For instance, a and c domains can form a pair separated by an interface in a plane of type (101) or (101) (see Figure 2.4). They will be considered identical hereafter. So, there will be only three possible domain configurations: we will denote by (1,2) a structure of type a1/a2/a1/a2, and (1,3) and (2,3) the structures of type a/c/a/c (which means a1/c/a1/c and a2/c/a2/c).
Figure 2.4. Compatibility between a a domain and a c domain: both types of domains should share a common interface to be mechanically compatible. For this, they share a (101) plane. The tetragonality of the lattice was exaggerated to illustrate that the normal directions to the domains are disoriented one relative to the other
2.4.6. Domain structures at equilibrium
It is now possible to calculate the thermodynamic potentials corresponding to each domain configurations and to determine which is the most stable. It will thus be possible to plot the domain stability map for a given film.
The equilibrium free energy7 for a domain structure is written as follows [ALP 98]8:
[2.18] 
with ![]() and
and ![]() the equilibrium fraction of j domains:
the equilibrium fraction of j domains:
[2.19] 
The equilibrium free energy for a polydomain structure (fij) is therefore decomposed in a free energy term f0 of the unstressed tetragonal (identical for all three types of domains) and a term related to the elastic energy of the stressed structure ![]() . The latter term consists of the energy due to the adhesion to the substrate
. The latter term consists of the energy due to the adhesion to the substrate ![]() (see Table 2.1), and of the indirect interaction energy between i and j domains,
(see Table 2.1), and of the indirect interaction energy between i and j domains, ![]() (see equation [2.16]) that involves
(see equation [2.16]) that involves ![]() , the equilibrium fraction of j domains. The use of the “effective parameter of incompatibility”
, the equilibrium fraction of j domains. The use of the “effective parameter of incompatibility” ![]() enables us to take into account the effects of microstresses in the case where the critical thickness for the domains formation, tcr, is not negligible compared to the thickness of the film, t, which is the case for the system studied in this chapter.
enables us to take into account the effects of microstresses in the case where the critical thickness for the domains formation, tcr, is not negligible compared to the thickness of the film, t, which is the case for the system studied in this chapter.
The transitions between the polydomain structures correspond to the following equalities:
[2.20a] ![]()
[2.20b] ![]()
[2.20c] ![]()
2.4.7. Domain stability map
In this section, we introduce the calculations that enable us to plot the domain stability map, taking explicitly into account the effect of thickness. We consider the case where the thickness of the film t is not very large compared to the critical thickness tcr of domains formation. Therefore, the effective parameter of incompatibility η is not zero. The periodicity of domains D is not negligible compared to the thickness t of the film, although D < t still holds. The contributions of microstresses and interface energies are considered. Moreover, it is still assumed that the film is an elastic homogeneous and isotropic solid. Its elastic properties are therefore determined by its Young’s modulus E and its Poisson’s ratio ν.
The equilibrium fractions of different domains are then given by equation [2.21]:
[2.21a] ![]()
[2.21b] ![]()
with the tetragonality ![]() and the misfit strain
and the misfit strain ![]() , a and c denote the lattice parameters of the massive material and as the lattice parameter of the substrate. In the structure a1/a2/a1/a2 (1,2), it should noted that the volume fraction of a2 domains is equal to ½. This result is quite intuitive because of the symmetry of the problem (the fact that the c-axis is oriented along one or the other of the in-plane directions does not change the energy of the phase). For the same reason, this volume fraction does not depend on the thickness of the film, the tetragonality, or the misfit strain. This is not the case for
, a and c denote the lattice parameters of the massive material and as the lattice parameter of the substrate. In the structure a1/a2/a1/a2 (1,2), it should noted that the volume fraction of a2 domains is equal to ½. This result is quite intuitive because of the symmetry of the problem (the fact that the c-axis is oriented along one or the other of the in-plane directions does not change the energy of the phase). For the same reason, this volume fraction does not depend on the thickness of the film, the tetragonality, or the misfit strain. This is not the case for ![]() , the equilibrium volume fraction of c domains in a structure (1,3) or (2,3).
, the equilibrium volume fraction of c domains in a structure (1,3) or (2,3).
The elastic energies that correspond to the various domain structures are then given by equation [2.22]9 and their values are listed in Table 2.3:
[2.22] ![]()
Table 2.3. Equilibrium elastic energy density for the possible domain configurations
Due to the symmetry of the problem, the monodomain structures a1 (1) and a2 (2) have the same equilibrium elastic energy, they are thus equally likely. They will be referred to hereafter as structure (1)/(2). Likewise, the structures a1/c/a1/c (1,3) and a2/c/a2/c (2,3) will be denoted as (1,3)/(2,3).
The expressions of the equilibrium elastic energies involve only two variables, the tetragonality (denoted ∈T) and the misfit strain (∈M), as well as two parameters, the Poisson’s ration (ν) and the effective parameter of incompatibility (η). For a given material (that is, for ν constant) with a given thickness (that is, for η constant), it is therefore possible to plot the domains of stability of each of the structures and, by comparing their energies, to determine which is the most stable. Following this approach, we can build a stability map of domain structures taking into account the thickness of the film.
2.4.7.1. Regions of existence
It is worth noting that the domain structure (1,2) is always more stable than the monodomain structure (1)/(2) (see equation [2.22] and Table 2.3). The domain structure (1,2) is stable over all possible values of ∈T and ∈M. This implies that the monodomain structure (1)/(2) is never the most stable one. It will therefore not appear on the map of existence (see Figure 2.5). Similarly, the structure (1,3)/(2,3) is always more stable than the monodomain structure (3). On the contrary, the domain structure (1,3)/(2,3) exists if and only if ![]() . The equations of the lines delimiting its region of existence are computed from equation [2.21a]. Therefore, the monodomain structure (3) has a non-zero region of existence.
. The equations of the lines delimiting its region of existence are computed from equation [2.21a]. Therefore, the monodomain structure (3) has a non-zero region of existence.
The different regions of existence in the half-plane (∈T ≥ 0,∈M) are shown in Figure 2.5.
Figure 2.5. Regions of existence for each domain structure as a function of the tetragonality ∈T and the misfit strain ∈M. The monodomain structure c (3) and the polydomain structure a1/a2/a1/a2 (1,2) exist over the entire half-plane. These two structures coexist with the phase a/c/a/c (which is (1,3)/(2,3)) in the region of the half-plane bounded by ![]() and
and ![]() . Here, the figure is plotted for a Poisson’s ratio ν = 0.36 and a relatively thin layer (η = 0.1)
. Here, the figure is plotted for a Poisson’s ratio ν = 0.36 and a relatively thin layer (η = 0.1)
2.4.7.2. Regions of stability
Now that we have determined the stable phase (or phases) on the various regions, the final step to establish the domain stability map consists of determining which structure is the most stable in each region of the half-plane (∈T ≥ 0, ∈M), where several structures coexist (see Figure 2.5).
Let us start with the region where the three structures coexist, that is, between the lines ![]() and
and ![]() . We have previously noticed that the structure a/c/a/c (denoted as (1,3)/(2,3)) is more stable than the monodomain structure c (3). It is therefore sufficient to compare the equilibrium elastic energies of the polydomain structures (1,3)/(2,3) and (1,2) over this region. The structure (1,2) will be the most stable if e12 < e13. The region corresponding to the solution of this inequation is shown in Figure 2.6. This figure further indicates that the structure (1,3)/(2,3) is metastable (which means that it satisfies the conditions of existence, but is less stable than the structure (1,2)) for a proportion of c domains that range between 0 (limit of existence, dotted line) and 0.566 (limit of instability, clear line) for ν = 0.36 and η = 0.1 (see Figures 2.6 and 2.7).
. We have previously noticed that the structure a/c/a/c (denoted as (1,3)/(2,3)) is more stable than the monodomain structure c (3). It is therefore sufficient to compare the equilibrium elastic energies of the polydomain structures (1,3)/(2,3) and (1,2) over this region. The structure (1,2) will be the most stable if e12 < e13. The region corresponding to the solution of this inequation is shown in Figure 2.6. This figure further indicates that the structure (1,3)/(2,3) is metastable (which means that it satisfies the conditions of existence, but is less stable than the structure (1,2)) for a proportion of c domains that range between 0 (limit of existence, dotted line) and 0.566 (limit of instability, clear line) for ν = 0.36 and η = 0.1 (see Figures 2.6 and 2.7).
Let us now look at the two regions where structures (1,2) and (3) coexist. Structure (1,2) is more stable than structure (3) when e12 < e3, that is, for ![]() (see Figure 2.6). Because of the low value of the effective parameter incompatibility (η = 0.1), the stability limits of structure (1,2) compared to structures (1,3)/(2,3) and (3) are very close (see the lines corresponding to
(see Figure 2.6). Because of the low value of the effective parameter incompatibility (η = 0.1), the stability limits of structure (1,2) compared to structures (1,3)/(2,3) and (3) are very close (see the lines corresponding to ![]() and
and ![]() in Figure 2.6). Nevertheless, the latter is located inside the region of existence of structure (1,3)/(2,3). So, there is no possible direct transition between the structures (1,2) and (3).
in Figure 2.6). Nevertheless, the latter is located inside the region of existence of structure (1,3)/(2,3). So, there is no possible direct transition between the structures (1,2) and (3).
Figure 2.6. Stability map for the various phases. The comparison of the equilibrium elastic energies of the monodomain phase c (e3) and the polydomain phases a/c/a/c (e13) and a1/a2/a1/a2 (e12) defines the stability regions of each of them
2.4.7.3. Domain stability map
Through the combination of the existence and stability conditions of the various structures (i.e. by overlaying Figures 2.5 and 2.6), we obtain Figure 2.7 from which the domain stability map is derived (see Figure 2.8).
Figure 2.7. Overlaying of the existence and stability maps for the various phases considered
Figure 2.8. Domain stability map for a thin layer (η = 0.1) of Pb(Zr0.2Ti0.8)O3 (ν = 0.36). The a1/a2/a1/a2 phase is stable for ![]() , a/c/a/c phase for
, a/c/a/c phase for ![]() , and c phase for
, and c phase for ![]()
From this map, we see that the monodomain c phase is the most stable for ∈M0 > 0, that is to say when the deposited material is under compression. This result is intuitive. Moreover, for ∈M very negative, we observe that the polydomain a1/a2/a1/a2 phase is the most stable. Once again, intuitively, if a tetragonal thin film is submitted to a tenstile stress, the in-plane orientation of polarization is favored. Since both directions of the interface are equivalent by symmetry, the polarization tends to be oriented either along a or along b and the resulting structure consists, in equal proportion, of these two types of domains. Between the two there is a coexistence between an a phase and a c phase. We may first note that if this phase is limited by the line corresponding to ![]() (which means 100% of c domains) on the right side, it does not extend to the dotted line corresponding to
(which means 100% of c domains) on the right side, it does not extend to the dotted line corresponding to ![]() (0% of c domains) on the left side. Between the lines defined by
(0% of c domains) on the left side. Between the lines defined by ![]() and 0.566, the a/c/a/c phase is metastable, which means that its conditions of existence are validated, but that the a1/a2/a1/a2 phase is the most stable. This implies that the minimum percentage of c domains in such a phase will be 56.6%. This means that the c domains will always predominate in a a/c/a/c phase, whatever the temperature and the applied stresses. Moreover, the transition between a a/c/a/c phase and the a1/a2/a1/a2 phase will result in the sudden disappearance of c domains before their proportion reaches 0. The phase transition between the a/c/a/c and a1/a2/a1/a2 structures will be therefore of the first order.
and 0.566, the a/c/a/c phase is metastable, which means that its conditions of existence are validated, but that the a1/a2/a1/a2 phase is the most stable. This implies that the minimum percentage of c domains in such a phase will be 56.6%. This means that the c domains will always predominate in a a/c/a/c phase, whatever the temperature and the applied stresses. Moreover, the transition between a a/c/a/c phase and the a1/a2/a1/a2 phase will result in the sudden disappearance of c domains before their proportion reaches 0. The phase transition between the a/c/a/c and a1/a2/a1/a2 structures will be therefore of the first order.
Finally, it is worth noting that a temperature interval exists over which the monodomain c phase is the most stable while the thin layer is under stress (∈M < 0). This means that, for thin films under (modest) tensile stress, it is possible to stabilize a phase with a polarization oriented in a direction that is out of the plane of the interface. This can be intuitively understood by noticing that the greater the tetragonality (∈T) the higher the stability the further the stability region of c domains extends on the tensile side of the domain stability map, which extends on the tensile stress side; in other words, the more the lattice is elongated along the c-axis, the more difficult it will be to make it flip in the plane of the interface.
2.5. Temperature–misfit strain phase diagram for polydomain flms
The domain stability maps illustrate the fact that at a given temperature, a polydomain structure is often more stable than a monodomain one. This type of polydomain structure is the most frequent case for thin films whose thickness is much larger than the critical thickness of misfit dislocations generation. Nevertheless, these films should remain thin enough so that an epitaxy holds. The thicknesses of these films are thus intermediate between monodomain films and polycrystalline films. Regarding Pb(Zr,Ti)O3 films, these thicknesses begin at about 100 nm.
To determine the evolution of the structure as a function of temperature, Koukhar10 et al. developed a nonlinear theory analog to LGD [KOU 01] to calculate the temperature–misfit strain phase diagram of such films. The description of the studied films is the same as that used to establish the domain stability maps: the thin film is supposed to be composed of a dense laminar domain structure, whose period is smaller than the thickness yet sufficiently important so that the energy within each domain is much larger than the energy of domain walls.11 Furthermore, the thin film is considered to be under perfect short-circuit conditions, that is, without a depolarizing field. Under such conditions, the polarization and the strain are almost uniform within each domain and, consequently, the energy density is also uniform [KOU 01].
The polarization and the strain change from one domain to another implies that the approach used to calculate the phase diagrams of monodomain films cannot be applied here. Instead, the approach taken is to calculate the free energy of the film-substrate system, by considering that the film surface is free and no external force is applied. It is then possible to show that the average density of the electric Gibbs free energy ![]() is the sum of the free energy densities within each type of domain (
is the sum of the free energy densities within each type of domain (![]() and
and ![]() ) weighted by their volume fraction (φ and 1 – φ). We thus have:
) weighted by their volume fraction (φ and 1 – φ). We thus have:
[2.23] ![]()
The free energy density is defined by the relation ![]() , where G2 denotes the electrical Gibbs free energy, U the internal energy, T the temperature, S the entropy, Ei the internal electric field components relative to the film, Pi polarization components and ∈0 the dielectric constant in the vacuum. Since only the Gibbs free energy, G, is known for PZT [HAU 89a], G2 is expressed in terms of G through the Legendre transform: G2 = G + σijSij. The equilibrium polarization is then computed by minimizing
, where G2 denotes the electrical Gibbs free energy, U the internal energy, T the temperature, S the entropy, Ei the internal electric field components relative to the film, Pi polarization components and ∈0 the dielectric constant in the vacuum. Since only the Gibbs free energy, G, is known for PZT [HAU 89a], G2 is expressed in terms of G through the Legendre transform: G2 = G + σijSij. The equilibrium polarization is then computed by minimizing ![]() . For a fixed direction of the domain walls, the expression of
. For a fixed direction of the domain walls, the expression of ![]() involves the polarization in each type of domain, the respective volume fractions, as well as the stresses and internal electric fields in each domain. The latter two contributions are eliminated by considering the mechanical and electrical boundary conditions in the same way as for the monodomain films. The mechanical boundary conditions are expressed as a function of the misfit strain:
involves the polarization in each type of domain, the respective volume fractions, as well as the stresses and internal electric fields in each domain. The latter two contributions are eliminated by considering the mechanical and electrical boundary conditions in the same way as for the monodomain films. The mechanical boundary conditions are expressed as a function of the misfit strain:
[2.24] ![]()
with ![]() the effective lattice parameter of the substrate [SPE 94] and
the effective lattice parameter of the substrate [SPE 94] and ![]() the pseudocubic lattice parameter of the massive material. The subsequent calculations are similar to that used for the calculations on monodomain layers and involves the minimization of
the pseudocubic lattice parameter of the massive material. The subsequent calculations are similar to that used for the calculations on monodomain layers and involves the minimization of ![]() in each phase defined above and the comparison of these minima to determine the absolute minimum.
in each phase defined above and the comparison of these minima to determine the absolute minimum.
The phase diagrams of PbTiO3, BaTiO3 [KOU 01], and Pb(Zr1−x,Tix)O3 for x = 0.4 → 0.9 [KUK 06] were calculated through this methodology. As an illustration, the phase diagrams of PbTiO3 and BaTiO3 are shown in Figure 2.9. They indicate that c phase is the only stable monodomain phase. The r and aa phases are less stable than the polydomain a/c/a/c and a1/a2/a1/a2 phases. However, the regions of stability are not necessarily identical.
Figure 2.9. Temperature–misfit strain phase diagram computed for dense laminar domain structures of (a) PbTiO3 and (b) BaTiO3 [KOU 01]
2.6. Discussion of the nature of the “misfit strain”
Phase diagrams of monodomain thin films, domain stability maps, as well as temperature–misfit strain phase diagrams previously presented are plotted as a function of a quantity called misfit strain but whose expressions vary (see equations [2.4], [2.13], and [2.24]).
This quantity may have two meanings:
– Mechanical misfit strain: it links the lattice parameters of the unstressed material to those of the material under stress (see equation [2.13]).
– Thermodynamic misfit strain: It then appears as a modification of the lattice parameter of the parent phase, which is equal to the one of the paraelectric phase of the bulk material if T > TC, or to the pseudocubic lattice parameter for T < TC (see equations [2.4] and [2.24]).
2.6.1. Mechanical misfit strain
The expressions depend on:
1) the chosen point of view (Lagrangian (coordinate system in movement) or Eulerian (fixed coordinate system)) for the sign;
2) the system under consideration for the lattice parameters that appear in the numerator;
3) the choice of the lattice parameter for the denominator.
The system under consideration may be, as for Roytburd et al., a tetragonal phase deposited on a cubic substrate; the misfit strain (denoted as ∈M) will then be a tensor whose terms represent the relative differences between the lattice parameters of the tetragonal phase and the lattice parameter of the substrate (see equation [2.13]) [ALP 98]. The fact that, at the first order, the differences that are considered are small compared to all the lattice parameters explains the arbitrary choice of the denominator.
2.6.2. Thermodynamic misfit strain
The misfit strain intervenes only as a variable in the development of the Gibbs free energy. This variable represents the strain imposed on the free paraelectric cubic phase (the “parent” phase). Therefore, the “thermodynamic” misfit strain represents the relative difference between the lattice parameter of the thin layer in the plane and the pseudocubic lattice parameter. The boundary conditions are fixed by the substrate and its expression therefore reads: ![]() , where as denotes the lattice parameter of the substrate and
, where as denotes the lattice parameter of the substrate and ![]() the pseudocubic lattice parameter. This expression makes sense only with the expression
the pseudocubic lattice parameter. This expression makes sense only with the expression ![]() (σ//= σ1 or σ2), which reflects the fact that at the interface, during the deposition, the deposited material should adopt the lattice parameter of the substrate.
(σ//= σ1 or σ2), which reflects the fact that at the interface, during the deposition, the deposited material should adopt the lattice parameter of the substrate.
In the case where dislocations due to the mismatch (i.e. due to the difference in lattice parameters between the deposited massive material and the substrate at a given temperature) relax some of these stresses, it is possible to use the concept of effective substrate [SPE 94]. The lattice parameter of the latter (denoted as ![]() ) corresponds to the lattice parameter of the real substrate, altered because of the dislocations. The lattice parameter of the effective substrate is actually equal to the in-plane lattice parameter of the film, at the deposition temperature. By definition, the effective substrate is indeed the substrate that “imposes” its lattice parameter to the film. In all cases, it is the boundary conditions governing the evolution of the pseudocubic lattice parameter of the massive material that are described. It is, indeed, on this reference state that is based the description of the system’s evolution through the Landau-Devonshire theory.
) corresponds to the lattice parameter of the real substrate, altered because of the dislocations. The lattice parameter of the effective substrate is actually equal to the in-plane lattice parameter of the film, at the deposition temperature. By definition, the effective substrate is indeed the substrate that “imposes” its lattice parameter to the film. In all cases, it is the boundary conditions governing the evolution of the pseudocubic lattice parameter of the massive material that are described. It is, indeed, on this reference state that is based the description of the system’s evolution through the Landau-Devonshire theory.
2.6.3. As an illustration
Let us consider the case of a monocrystalline thin slab, with no effect of finite size, of PbTiO3 for example. To make it clearer, we may imagine a monocrystalline slab of a few tens of nanometers in thickness. This film undergoes a transition from a paraelectric cubic phase to a ferroelectric tetragonal one. The assumption is made that, below the transition, this monocrystal is monodomain and oriented with the c-axis being vertical. Its evolution in the temperature–misfit strain phase diagram is as follows: from the deposition temperature to TC, the system follows a straight vertical line, corresponding to um = 0. The material remains unstrained, its lattice parameter in the plane is equal to the pseudocubic lattice parameter. Below TC the slab transits toward a ferroelectric phase. This transition induces a strain of the lattice called spontaneous strain. This is reflected on the phase diagram by a deviation from the vertical line passing through um = 0. In the plane of the slab, the a lattice parameters are different from the pseudocubic lattice parameter. Therefore, a misfit strain arises, even without any mechanical strain.
The strains called misfit strains are thus linked by the relation:
[2.25] ![]()
∈thermo is denoted um in the temperature–misfit strain phase diagrams and ∈mecha has been denoted ∈M for the stability maps of domain structures.
2.7. Conclusion
This chapter aimed at emphasizing that a thin film is a complex object and that the description of a system composed of a thin film deposited on a substrate encompasses much more than a monocrystal imposing its lattice parameter to the other one.
Moreover, the temperature–misfit strain phase diagrams are essential tools for the understanding of the structures observed on thin films and are invaluable for the engineering of these systems.
Finally, the domain stability maps indicate what is the stable domain structure of the thin film, the properties (and therefore the potential applications) of these films being strongly dependent thereupon.
2.8. Experimental validation of phase diagrams: state of the art
In many applications such as nonvolatile memories or filters, it is necessary to use monodomain thin films in order to take full advantage of the anisotropy of dielectric, piezoelectric, and electrooptical properties of ferroelectric materials.
As shown in this chapter the fundamental changes in the properties of monodomain thin films under stresses can be described within the framework of LGD theory. In fact, the latter allows the generation of temperature–misfit strain phase diagrams that are valuable tools for understanding the influence of stresses on the structure and, consequently, on the properties of thin films. If the temperature–misfit strain phase diagram has been calculated for a number of materials, there are, on contrary, only a few available experimental datasets are able to confirm and/or validate some of the initial assumptions. This is certainly due to the difficulty to synthesize good quality monodomain thin films on the one hand and to perform characterizations as a function of temperature on the other hand. The temperature of phase transition for thin films of BaTiO3 [CHO 04, MIS 06, LI 06, HE 06], SrTiO3 [HAE 04, HE 04, HE 05, KEA 06], and Ba0,5Sr0,5TiO3 [RIO 06] were compared with the corresponding temperature–misfit strain diagrams. Moreover, the evolution of the misfit strain as a function of temperature has been reported till this day for PbZr0.2Ti0.8 O3 [JAN 07a] and PbTiO3 [JAN 07b]
Bulk Pb(Zr0.2Ti0.8)O3 (denoted as PZT 20/80 in the following) and PbTiO3 are two tetragonal materials. The thin films considered hereafter are monodomain c (thus they are also tetragonal). Interestingly, the two materials are relatively close in composition and structure. Their study will nevertheless reveal several differences and enable the comparison of the experimental results with the corresponding phenomenological calculations.
2.9. Case study
The studied films are therefore films of PbTiO3 and PZT 20/80, of 100 nm of thickness, deposited on SrTiO3 at high temperature. The thicknesses of the films were determined using the Laue oscillations observed by X-ray diffraction (see Figures 2.10 and 2.11) to the very good crystalline quality of the thin films and their finite thickness. Intensity diffracted by a crystal of finite dimensions is indeed given by:
[2.26] ![]()
where N denotes the number of diffracting planes, d the interplanar distance in the direction perpendicular to the interface, 2θ the diffraction angle, and λ the wavelength of the X-ray beam. The thickness is therefore given by N.
2.10. Results
2.10.1. Evolution of the lattice parameters
The evolution of the lattice parameters of the thin film of PZT 20/80 as a function of temperature is shown in Figure 2.12. The lattice parameters of the target (ceramics of bulk PZT 20/80) that was used for its deposition by pulsed laser deposition as well as those of the substrate (SrTiO3) are plotted on the same figure.
Figure 2.10. Diffractogram and Laue oscillations on a Pb(Zr0.2Ti0.8)O3 thin film deposited on SrTiO3, the doublet at higher 2θ is due to the diffraction of the substrate. The wavelength used for these measurements was λCuKα
Figure 2.11. Diffractogram and Laue oscillations on a PbTiO3 thin film deposited on SrTiO3; the doublet at larger diffraction angle is due to the diffraction of the substrate. The wavelength used for these measurements was λCuKα
Figure 2.13 shows the same evolution for the thin layer of PbTiO3; the lattice parameters of the bulk are those published by Shirane [SHI 50].
The measurements indicate that both films are monodomain, oriented with the c-axis perpendicular to the interface, and this, over the entire considered range of temperatures. The films do not undergo any phase transition, on the contrary to their bulk counterpart where the paraelectric → ferroelectric transition takes place at 740 K for PZT and 760 K for PbTiO3. The in-plane lattice parameters were measured equal and perpendicular to one another, implying a tetragonal structure throughout the considered temperature range, in particular below the transition temperature of the bulk.
Figure 2.12. Evolution of the lattice parameters of PZT 20/80 as a function of temperature: lattice parameters of the massive material (•) and of the thin film, out-of-plane (▲) and in-plane (▼), deposited on SrTiO3
Figure 2.13. Evolution of the lattice parameters of the thin film ofPbTiO3 as a function of temperature: lattice parameters of the bulk (according to [SHI 50]) (•) and of the thin film, out-of-plane (▼) and in-plane (▲), deposited on SrTiO3
The in-plane lattice parameter of the film of PZT 20/80 (a//) shows an evolution in temperature that is parallel to the substrate (see Figure 2.12). This indicates that the thin film is strongly clamped onto the substrate, so that the latter imposes its thermal evolution. Nevertheless, the thermal expansion coefficients in the plane of the film and of the substrate are different. Indeed, a thermal expansion coefficient α(T) is defined as:
[2.27] ![]()
Thus, even if the curves are parallel (i.e. if the slopes are the same), since the lattice parameters at room temperature are different (a//(298K) ≠ as(298 K)), the thermal expansion coefficients are not be equal. It is worth noting that, for the same reason, an “effective” substrate [SPE 94] does not have the same thermal expansion coefficient as the associated real substrate.
In the case of PbTiO3, on the contrary, the film and the substrate have the same in-plane lattice parameter at the interface (see Figure 2.13). The epitaxy is said to be coherent. The thermal expansion coefficients are therefore equal.
These two structures in (mono) domains are consistent with the domain stability map since the films are under compressive stress according to Alpay’s definition (∈M > 0, see equation [2.13]) [ALP 98]. These films can therefore be compared to their respective temperature–misfit strain phase diagram.
2.10.2. Associated stresses and strains
The misfit strain for the PbTiO3 and PZT 20/80 films is negative at room temperature. The in-plane (respectively, out-of-plane) lattice parameter in the film is larger (respectively, smaller) than its bulk value (see Figures 2.12 and 2.13, and Table 2.4).
Table 2.4. Lattice parameters at room temperature for PZT 20/80 and PbTiO3: bulk (am, cm) and thin film (af, cf)
| T = 298K | PZT 20/80 | PbTiO3 |
| af | 3.966 | 3.905 |
| cf | 4.131 | 4.150 |
| am | 3.950 | 3.894a |
| cm | 4.150 | 4.140a |
The various contributions to the resulting strain state of the thin film are:
– the strain due to the deposition on a substrate with a different lattice parameter;
– the strain due to the difference in thermal expansion that occurs during the cooling from the deposition temperature to room temperature;
– the spontaneous strain due to the phase transition, the films being deposited above TC, that is to say, in the bulk paraelectric phase; and
– the inhomogeneous stresses due to defects.
2.10.2.1. Deposition stress
At the deposition temperature, the cubic lattice parameter of the paraelectric phase of bulk PZT 20/80 is greater than that of the substrate. The same holds for PbTiO3. Therefore, in both cases, the thin films grow under a compressive stress. The associated strain, ![]() , may be partially or completely relaxed by dislocations at the interface (the misfit dislocations). Thus, we have
, may be partially or completely relaxed by dislocations at the interface (the misfit dislocations). Thus, we have ![]()
![]() and
and ![]() .
.
The stress associated with ∈deposition is given by:
[2.28] ![]()
which gives12 ![]() GPa and
GPa and ![]() GPa. It therefore appears that the deposition stress is very large.
GPa. It therefore appears that the deposition stress is very large.
The fraction of the initial strain that was relaxed by dislocations corresponds to the relative difference between the strain that a thin film in coherent epitaxy with the substrate would sustain and the one effectively sustained by these films:
– for PZT 20/80, in the case of a coherent epitaxy, the film sustains a strain equal to ![]() ; the dislocations therefore relax 1 − (−12,7×10⁻³)/(−19,4×10−3) = 34% of the associated stress;
; the dislocations therefore relax 1 − (−12,7×10⁻³)/(−19,4×10−3) = 34% of the associated stress;
– for PbTiO3, the epitaxy is coherent (af = as); the deposition stress represents therefore the entirety of the stress due to the difference in lattice parameter between the substrate and the massive material.
2.10.2.2. Inhomogeneous stresses
Like most materials, these thin films may contain defects: oxygen vacancies, threading or misfit dislocations, etc., which induce inhomogeneous stresses and therefore locally distort the material.
We make the assumption that these distortions are created during the deposition and that they do not vary with temperature. They can therefore be embodied in the term related to the deposition stress.
2.10.2.3. Differential thermal stress
During the cooling after deposition, and in addition to the natural contraction of the material, a strain occurs because of the difference between the contraction speeds (in Å/K) of the substrate and of the massive material. This difference is illustrated in Figures 2.12 and 2.13 by the slightly different slopes for the lattice parameter of the substrate and the pseudocubic bulk. The material under stress during the deposition “would like” to contract like the (mechanically free) massive material but it is “forced” the substrate. Between the deposition temperature Td and a temperature T, the evolution of the lattice parameter in the plane of the film is described by:
[2.29] ![]()
The film presents a thermal expansion coefficient equal to ![]() and its evolution is parallel to the substrate, whereas if it were not driven by the latter, its evolution would be parallel to the massive material:
and its evolution is parallel to the substrate, whereas if it were not driven by the latter, its evolution would be parallel to the massive material:
[2.30] ![]()
where ![]() (298 K) denotes the pseudocubic lattice parameter of the massive material at room temperature and αm its thermal expansion coefficient.
(298 K) denotes the pseudocubic lattice parameter of the massive material at room temperature and αm its thermal expansion coefficient.
The differential thermal strain, ∈Δth, is therefore written as follows:
[2.31] ![]()
and Table 2.5 gathers the values related to the calculation of ∈deposition and ∈Δth.
For PZT, the thermal stress is therefore (weakly) compressive at room temperature ![]() . This small value comes from the fact that the thermal expansion coefficients as well as the lattice parameters of PZT and those of SrTiO3 are very close. On the contrary, for PbTiO3, the differential thermal stress is a tensile stress at room temperature:
. This small value comes from the fact that the thermal expansion coefficients as well as the lattice parameters of PZT and those of SrTiO3 are very close. On the contrary, for PbTiO3, the differential thermal stress is a tensile stress at room temperature: ![]() . In both cases, this differential thermal strain is much smaller than the deposition strain.
. In both cases, this differential thermal strain is much smaller than the deposition strain.
Table 2.5. Differential thermal strain for PZT and PbTiO3
The associated stresses can be calculated from equation [2.28]: ![]() MPa and
MPa and ![]() MPa. These stresses are, respectively, 50 and 6 times smaller than the deposition stresses.
MPa. These stresses are, respectively, 50 and 6 times smaller than the deposition stresses.
Expression [2.31] points out the fact that it is not possible to directly compare the thermal expansion coefficients of a material and of a substrate to predict the sign of the differential thermal stress. One actually needs to compare this difference, weighted by the pseudocubic lattice parameters at room temperature.
2.10.2.4. Misfit strain
The sum of these two contributions, ![]() , represents the difference between the pseudocubic lattice parameter of the bulk and the in-plane lattice parameter of the film. The associated strain is therefore the misfit strain in its thermodynamic meaning,
, represents the difference between the pseudocubic lattice parameter of the bulk and the in-plane lattice parameter of the film. The associated strain is therefore the misfit strain in its thermodynamic meaning, ![]() . In the case of PZT, um(298 K) = −7, 5 × 10⁻³ and, in the case of PbTiO3, um(298 K) = −7,6 × 10⁻³.
. In the case of PZT, um(298 K) = −7, 5 × 10⁻³ and, in the case of PbTiO3, um(298 K) = −7,6 × 10⁻³.
This quasi-equality underlines that the misfit strain is a complex quantity to estimate a priori. The thin films studied here display different deposition stresses (since the epitaxy with the substrate is coherent for one of the films and involves misfit dislocations for the other). The differential thermal stresses present neither the same sign nor the same magnitude, yet the misfit strain is the same in both films. This means that, thermodynamically, they are similar.
As the misfit strain is a thermodynamic quantity, there is no associated stress.
2.10.2.5. Mechanical strain
The thermodynamic misfit strain does not reflect the mechanical state of the material. In fact, the latter is defined as the relative difference between the in-plane lattice parameter of the film (material under stress) and the lattice parameter of the massive material (free material). Relation [2.25] can be rewritten as:
[2.32] ![]()
as the spontaneous strain is linked to the paraelectric → ferroelectric phase transition (for the a domains of the bulk, ![]() . At room temperature,
. At room temperature, ![]()
![]() for PZT and
for PZT and ![]() for PbTiO3 (see Table 2.4). The stresses associated with these strains are, respectively,
for PbTiO3 (see Table 2.4). The stresses associated with these strains are, respectively, ![]() GPa for PZT 20/80 and
GPa for PZT 20/80 and ![]() for PbTiO3. These large values are of the same order of magnitude as the deposition stresses.
for PbTiO3. These large values are of the same order of magnitude as the deposition stresses.
In both cases |∈spont| > |um|; the mechanical strain is therefore positive for both films and the associated stress is a tensile stress. For PZT 20/80, the mechanical stress associated with the measured mechanical strain is 760 MPa and for PbTiO3, it is approximately 580 MPa.
The calculation presented here is thus in agreement with the experimental results.
This underlines the difference between the various definitions of the misfit strain. The misfit strain in its thermodynamic definition is negative, whereas the thin film is under tension, which means that the misfit strain in its mechanical definition is positive. These two quantities describe the same thin film but the viewpoints are different.
To sum up, the differential thermal strain and the deposition strain contribute to the thermodynamic misfit strain which is fundamentally different from the mechanical strain.
2.11. Comparison between the experimental data and the temperature–misfit strain phase diagrams
The complete sets of lattice parameters enable us to calculate the evolution of the misfit strain in its thermodynamic meaning, ![]() , as a function of temperature and, thus, to compare these experiments with the corresponding phase diagrams.
, as a function of temperature and, thus, to compare these experiments with the corresponding phase diagrams.
2.11.1. Thin film of PZT
The evolution of the misfit strain as a function of the temperature for the PZT thin film is plotted in Figure 2.14.
The proposed structure, monodomain c, is consistent with these observations. The measured evolution is quasi-linear and its evolution is continuous. This is consistent with continuous linear evolutions of the bulk pseudocubic lattice parameters and of the in-plane lattice parameters of the film. Since the differential thermal strain as well as the deposition strain are negative, the misfit strain tends to increase when the thin film is cooled toward room temperature.
Furthermore, this evolution confirms the absence of para → ferroelectric phase transition. Therefore, the film remains ferroelectric up to 800 K. Recent measurements of PFM (piezo force microscopy) on a 50 nm film of PZT 20/80 highlighted the persistence of the ferroelectricity up to very high temperatures; the transition temperature has been measured at 1,060 K [PAR 06]. The data presented here do not enable us to confirm the values of the transition temperatures, but from a linear extrapolation it is possible to evaluate the transition temperature for this film (see Figure 2.14). This transition is then expected at TC = 910 ± 20 K, which is comparable to the recent observations [PAR 06].
Figure 2.14. Evolution of the misfit strain, ![]() , as a function of temperature: superposition of these experimental points and the phase diagram of PZT [PER 03]. The thick line (between c and r phases) represents a first-order phase transition, while the thin lines represent second-order phase transitions. The dotted line passing through the experimental points is used to determine the transition temperature
, as a function of temperature: superposition of these experimental points and the phase diagram of PZT [PER 03]. The thick line (between c and r phases) represents a first-order phase transition, while the thin lines represent second-order phase transitions. The dotted line passing through the experimental points is used to determine the transition temperature
It is also possible to evaluate the maximum temperature of the tetragonal phase (which is not necessarily ferroelectric) from the evolution of the ratio c/a (see Figure 2.15). This maximum temperature corresponds to the temperature for which c/a = 1, that is ~ 1,400 K. This suggests that during the deposition (Td = 870 K), the film already adopts a tetragonal symmetry.
Figure 2.15. Evolution as a function of the temperature of the measured tetragonality ![]() and computed polarization (•)
and computed polarization (•) ![]() [MOR 04] of the thin film of PZT 20/80 deposited on SrTiO3. The horizontal solid continuous line represents the value of the elastic tetragonality at the deposition temperature and the dotted lines represent the refinements: linear for the tetragonalities and according to relation [2.33] for the polarization
[MOR 04] of the thin film of PZT 20/80 deposited on SrTiO3. The horizontal solid continuous line represents the value of the elastic tetragonality at the deposition temperature and the dotted lines represent the refinements: linear for the tetragonalities and according to relation [2.33] for the polarization
It is also possible to calculate the polarization in the film from the relation that links the spontaneous polarization to the distortion of the lattice:
[2.33] ![]()
where Q denotes the electrostrictive coefficient. The value of this coefficient was computed by Morioka et al. from measurements of tetragonality (c/a − 1) and of polarization on the PZT films (with 0.13 < Zr/(Zr+Ti) < 0.65) of 50 nm deposited on SrTiO3 with SrRuO3 as electrode. The linear relation established between ![]() and (c/a — 1) enables us to determine an effective electrostrictive coefficient for the thin films: Qeff = 0.049 m4/C2 [MOR 04], with this relation Ps is about 90 μC/cm2 in the film at room temperature. This value is higher than those measured on tetragonal PZT thin films [TUT 93, BRE 04]. This difference is explained by the fact that the tetragonality of the films has been considered as being entirely due to ferroelectricity, while the biaxial stresses already induce a purely elastic strain of the lattice. We thus have
and (c/a — 1) enables us to determine an effective electrostrictive coefficient for the thin films: Qeff = 0.049 m4/C2 [MOR 04], with this relation Ps is about 90 μC/cm2 in the film at room temperature. This value is higher than those measured on tetragonal PZT thin films [TUT 93, BRE 04]. This difference is explained by the fact that the tetragonality of the films has been considered as being entirely due to ferroelectricity, while the biaxial stresses already induce a purely elastic strain of the lattice. We thus have ![]() . It is possible to evaluate this “elastic tetragonality” by considering that, at the deposition temperature, the spontaneous strain is negligible. The in-plane strain at the temperature of deposition was previously computed:
. It is possible to evaluate this “elastic tetragonality” by considering that, at the deposition temperature, the spontaneous strain is negligible. The in-plane strain at the temperature of deposition was previously computed: ![]() . The strain of the film in the direction perpendicular to the interface between the film and the substrate,
. The strain of the film in the direction perpendicular to the interface between the film and the substrate, ![]() , is related to the previously computed deposition strain
, is related to the previously computed deposition strain ![]() by:
by:
[2.34] ![]()
It is then possible to calculate the out-of-plane lattice parameter at the deposition temperature:
[2.35] ![]()
The elastic tetragonality of the film at the deposition temperature can thus be determined: ![]() This elastic tetragonality should then be substracted to the measured tetragonality to obtain the “ferroelectric tetragonality”, the only component of the tetragonality that intervenes in expression [2.33].
This elastic tetragonality should then be substracted to the measured tetragonality to obtain the “ferroelectric tetragonality”, the only component of the tetragonality that intervenes in expression [2.33].
The evolution, as a function of temperature, of the spontaneous polarization in the film computed as mentioned above is plotted in Figure 2.15. The value at room temperature (~70 μC/cm2) is consistent with the literature. This polarization vanishes at 980 K, a temperature that satisfactorily corresponds with the one extrapolated from the temperature–misfit strain phase diagram.
2.11.2. Thin layer of PbTiO3
Similarly to the PZT thin film, the evolution of the misfit strain as a function of temperature was computed from the lattice parameters of the PbTiO3 thin film. It is compared to the phase diagram calculated by Pertsev et al. in Figure 2.16.
Here, the agreement between experiment and theory is very good. The evolution is still quasi-linear because of the linear evolutions of the pseudocubic lattice parameter of PbTiO3 and the in-plane lattice parameter of the film. Since the differential thermal strain is positive, while the deposition strain is negative, the misfit strain decreases when the thin film is cooled toward the room temperature, in contrast to what happens in PZT. The absence of phase transition is consistent with the phase diagram and the thin film therefore remains tetragonal and ferroelectric up to 850 K. By extrapolating the measured evolution of um, the paraelectric → ferroelectric transition temperature is about 1,000 K.
The measured linear extrapolation of the ratio c/a — 1 enables us to provide an estimate of the maximum temperature of stability of the tetragonal phase. As for the film of Pb(Zr0 2Ti0 8)O3, it is possible to decompose the measured tetragonality into an elastic and a ferroelectric tetragonality. We find ![]() . The polarization in the film of PbTiO3 can then be computed by using the Qeff determined for PZT [MOR 04]. Therefore, at room temperature, it would be about 90 μC/cm2.
. The polarization in the film of PbTiO3 can then be computed by using the Qeff determined for PZT [MOR 04]. Therefore, at room temperature, it would be about 90 μC/cm2.
This polarization vanishes at 1,550 K, temperature above that obtained from the temperature–misfit strain phase diagram of PbTiO3.
Figure 2.16. Evolution of the misfit strain ![]() as a function of temperature for a film of PbTiO3 deposited on SrTiO3: comparison between experimental points and the calculated diagram [PER 98]. The para → ferroelectric c phase was extrapolated in the range −10 < um(10−3) < −5
as a function of temperature for a film of PbTiO3 deposited on SrTiO3: comparison between experimental points and the calculated diagram [PER 98]. The para → ferroelectric c phase was extrapolated in the range −10 < um(10−3) < −5
Figure 2.17. Measured (c/a — 1) (▲)/ferroelectric (▄) tetragonalities and polarization (•) computed by analogy to PZTfor the thin film ofPbTiO3 on SrTiO3. The horizontal continuous solid line represents the value of the tetragonality at the deposition temperature and the dotted lines represent the refinements: linear for the tetragonalities and according to relation [2.33] for the polarization
The agreement between the phase transition temperatures evaluated from the temperature–misfit strain phase diagram and the one evaluated from the polarization seems to be better when the temperature of deposition (Td = 870 K) is close to the transition temperature (![]() , both evaluated from the phase diagram). In fact, we made the assumption that the tetragonality that arises during deposition has a purely elastic origin, which is true only if the deposition is made in the paraelectric phase.
, both evaluated from the phase diagram). In fact, we made the assumption that the tetragonality that arises during deposition has a purely elastic origin, which is true only if the deposition is made in the paraelectric phase.
2.12. Conclusion
The study of the structures of thin films enable the identification and quantification of the various contributions involved in the strain of the lattice of the deposited material (see Figure 2.18).
The growth begins in coherent epitaxy on the substrate, for PbTiO3 as for PZT 20/80; the in-plane lattice parameter of the film is therefore equal to that of the substrate. Then, in the case of PZT 20/80 the stress due to the difference in lattice parameters between PZT 20/80 and the substrate is partially relaxed by the generation of misfit dislocations. For both growth modes, the deposition strain links the cubic lattice parameter of the bulk ![]() to the in-plane lattice parameter of the film (af) at the deposition temperature. During the cooling between the deposition temperature and room temperature, the substrate imposes its thermal evolution to the in-plane lattice parameter of the film: this gives rise to the differential thermal strain. The sum of these two strains is the normalized difference between
to the in-plane lattice parameter of the film (af) at the deposition temperature. During the cooling between the deposition temperature and room temperature, the substrate imposes its thermal evolution to the in-plane lattice parameter of the film: this gives rise to the differential thermal strain. The sum of these two strains is the normalized difference between ![]() and af at room temperature. This strain represents the thermodynamic misfit strain.
and af at room temperature. This strain represents the thermodynamic misfit strain.
The mechanical misfit strain is computed as the difference between the lattice parameters of the massive material (a) and the in-plane lattice parameter of the film (af): above the para → ferroelectric transition, the massive material is cubic and its lattice parameter is ![]() . Both misfit strains are then equal. Below the transition, the measured lattice parameters are a and c (tetragonal system) and are different from
. Both misfit strains are then equal. Below the transition, the measured lattice parameters are a and c (tetragonal system) and are different from ![]() , the spontaneous strain linking a (or c) to
, the spontaneous strain linking a (or c) to ![]() . Thus, the mechanical deformation links the lattice parameter of the stress-free material (bulk), a, to that of the material under stress (the thin film), af.
. Thus, the mechanical deformation links the lattice parameter of the stress-free material (bulk), a, to that of the material under stress (the thin film), af.
Since the thermodynamic misfit strain is the sum of the mechanical and ferroelectric strains (see equation [2.32]), the thermodynamic misfit strain can be viewed as the effective strain of an elastic and ferroelectric material.
There is therefore a fundamental difference between the mechanical strain and the thermodynamic misfit strain. The two films are mechanically in tension (∈mecha > 0), while the misfit strain is negative.
Moreover, the studied films offer an experimental verification of the theoretical temperature–misfit strain phase diagrams and their assumptions. Although this verification could not provide a direct validation of the transition temperatures nor of the computed phase sequence, the proposed description shows that these thin films remain tetragonal, including in the paraelectric phase of the bulk, in accordance with the predictions of Pertsev et al. [PER 98].
Figure 2.18. Differences in lattice parameters (arrows) related to the different strains (in legend) involved in the case of a monodomain ferroelectric thin film. At any temperature, the mechanical strain (between the lattice parameters of the thin film and those of the bulk) is given by the sum of the strain of deposition (∈deposition), the differential thermal (∈Δth) and spontaneous ![]() strains
strains
Finally, the predicted domain structure (monodomain c) corresponds to that observed on these samples, and the absence of phase transition on the studied temperature range is confirmed. Therefore, the ferroelectric nature up to the considered highest temperatures is also confirmed. It appears then that this type of thin film enables us to obtain ferroelectric and therefore piezoelectric systems suitable for high-temperature applications.
2.13. Bibliography
[ALP 98] ALPAY S., ROYTBURD A., “Thermodynamics of polydomain heterostructures. III. Domain stability map”, J. Appl. Phys., vol. 83, no. 9, p. 4714, 1998.
[BAN 02] BAN Z.-G., ALPAY S., “Phase diagrams and dielectric response of epitaxial barium strontium titanate films: A theoretical analysis”, J. Appl. Phys., vol. 91, no. 11, p. 9288, 2002.
[BRE 04] BRENNECKA G., HUEBNER W., TUTTLE B., CLEM P., “Use of stress to produce highly oriented tetragonal lead zirconate titanate (PZT40/60) thin films and resulting electrical properties”, J. Am. Ceram. Soc., vol. 87, no. 8, p. 1459, 2004.
[CHO 04] CHOI K., BIEGALSKI M., LI Y., SHARAN A., SCHUBERT J., UECKER R., REICHE P., CHEN Y., PAN X., GOPALAN V., CHEN L.-Q., SCHOLM D., EOM C., “Enhancement of ferroelectricity in strained BaTiO3 thin films”, Science, vol. 306, no. 5698, p. 1005, 2004.
[DIE 04a] DIEGUEZ O., TINTE S., ANTONS A., BUNGARO C., NEATON J.B., RABE K.M., VANDERBILT D., “Publisher’s Note: Ab initio study of the phase diagram of epitaxial BaTiO3”, Phys. Rev. B, vol. 70, no. 6, p. 069903, 2004.
[DIE 04b] DIEGUEZ O., TINTE S., ANTONS A., BUNGARO C., NEATON J.B., RABE K.M., VANDERBILT D., “Ab initio study of the phase diagram of epitaxial BaTiO3”, Phys. Rev. B, vol. 69, no. 21, p. 212101, 2004.
[GLI 04] GLINCHUK M., MOROZOVSKA A., STEPHANOVICH V., JASTRABIK L., “Surface tension and mismatch effects in ferroelectric thin film properties”, Ferroelectrics, vol. 298, p. 83, 2004.
[HAE 04] HAENI J., IRVIN P., CHANG W., UECKER R., REICHE P., LI Y., CHOUDHURY S., TIAN W., HAWLEY M., CRAIGO B., TAGANTSEV A., PAN X., STREIFFER S., CHEN L., KIRCHOEFER S., LEVY J., SCHLOM D., “Room-temperature ferroelectricity in strained SrTiO3”, Nature, vol. 430, p. 758, 2004.
[HAU 87] HAUN M.J., FURMAN E., JANG S.J., MCKINSTRY H.A., CROSS L.E., “Thermodynamic theory of PbTiO3”, J. Appl. Phys., vol. 62, no. 8, p. 3331, 1987.
[HAU 89a] HAUN M., FURMAN E., JANG S., CROSS L., “Thermodynamic theory of the lead zirconate-titanate solid solution system; Part I: Phenomenology”, Ferroelectrics, vol. 99, p. 13, 1989.
[HAU 89b] HAUN M., FURMAN E., MCKINSTRY H., CROSS L., “Thermodynamic theory of the lead zirconate-titanate solid solution system; Part II: tricritical behavior”, Ferroelectrics, vol. 99, p. 27, 1989.
[HE 04] HE F., WELLS B., BAN Z.-G., ALPAY S., GRENIER S., SHAPIRO S., SI W., CLARK A., XI X., “Structural phase transition in epitaxial perovskite films”, Phys. Rev. B, vol. 70, p. 235405, 2004.
[HE 05] HE F., WELLS B., SHAPIRO S., “Strain phase diagram and domain orientation in SrTiO3 thin films”, Phys. Rev. Lett., vol. 94, no. 17, p. 176101, 2005.
[HE 06] HE F., WELLS B.O., “Lattice strain in epitaxial BaTiO3 thin films”, Appl. Phys. Lett., vol. 88, no. 15, p. 152908, 2006.
[JAN 07a] JANOLIN P. — E., FRAISSE B., LE MARREC F., DKHIL B., “Partial decoupling between strain and polarization in mono-oriented Pb(Zr0.2Ti0.8) O3 thin film”, Appl. Phys. Lett., vol. 90, p. 212904, 2007.
[JAN 07b] JANOLIN P.-E., LE MARREC F., CHEVREUL J., DKHIL B., “Temperature evolution of the structural properties of monodomain ferroelectric thin film”, Appl. Phys. Lett., vol. 90, no. 19, p. 192910, AIP, 2007.
[KEA 06] KEANE S.P., SCHMIDT S., LU J., ROMANOV A.E., STEMMER S., “Phase transitions in textured SrTiO3 thin films on epitaxial Pt electrodes”, J. Appl. Phys., vol. 99, no. 3, p. 033521, 2006.
[KOU 01] KOUKHAR V., PERTSEV N., WASER R., “Thermodynamic theory of epitaxial ferroelectric thin films with dense domain structure”, Phys. Rev. B, vol. 64, p. 214103, 2001.
[KRE 79] KRETSCHMER R., BINDER K., “Surface effects on phase transitions in ferroelectrics and dipolar magnets”, Phys. Rev. B, vol. 20, no. 3, p. 1065, 1979.
[KUK 06] KUKHAR V. G., PERTSEV N.A., KOHLSTEDT H., WASER R., “Polarization states of polydomain epitaxial Pb(Zr1−x Tix)O3 thin films and their dielectric properties”, Phys. Rev. B, vol. 73, no. 21, p. 214103, 2006.
[KWA 94] KWAK B., ERBIL A., BUDAI J., CHISHOLM M., BOATNER L., WILKENS B., “Domain formation and strain relaxation in epitaxial ferroelectric superstructures”, Phys. Rev. B, vol. 49, no. 21, p. 14865, 1994.
[LAI 05] LAI B.-K., KORNEV I., BELLAICHE L., SALAMO G., “Phase diagrams of epitaxial BaTiO3 ultrathin films from first principles”, Appl. Phys. Lett., vol. 86, p. 132904, 2005.
[LAN 81] LANDOLT-BÖRNSTEIN, Numerical Data and Functionnal Relationships in Science and Technology, Springer, Berlin, 1981.
[LEE 01] LEE K.S., CHOI J.H., LEE J.Y., BAIK S., “Domain formation in epitaxial Pb(Zr,Ti)O3 thin films”, J. Appl. Phys., vol. 90, no. 8, p. 4095, 2001.
[LI 06] LI Y. L., CHEN L.Q., “Temperature-strain phase diagram for BaTiO3 thin films”, Appl. Phys. Lett., vol. 88, no. 7, p. 072905, 2006.
[MIS 06] MISIRLIOGLU I.B., ALPAY S.P., HE F., WELLS B.O., “Stress induced monoclinic phase in epitaxial BaTiO3 on MgO”, J. Appl. Phys., vol. 99, no. 10, p. 104103, 2006.
[MOR 04] MORIOKA H., YOKOYAMA S., OIKAWA T., FUNAKUBO H., SAITO K., “Spontaneous polarization change with Zr/(Zr+Ti) ratios in perfectly polar-axis-oriented epitaxial tetragonal Pb(Zr;Ti)O3 films”, Appl. Phys. Lett., vol. 85, no. 16, p. 3516, 2004.
[PAR 06] PARUCH P., TRISCONE J.M., “High-temperature ferroelectric domain stability in epitaxial PbZr0.2Tip0.8 O3 thin films”, Appl. Phys. Lett., vol. 88, no. 16, p. 162907, 2006.
[PER 95] PERTSEV N.A., ZEMBILGOTOV A.G., “Energetics and geometry of 90° domain structures in epitaxial ferroelectric and ferroelastic films”, J. Appl. Phys., vol. 78, no. 10, p. 6170, 1995.
[PER 98] PERTSEV N., ZEMBILGOTOV A., TAGANTSEV A., “Effect of mechanical boundary conditions on phase diagrams of epitaxial ferroelectric thin films”, Phys. Rev. Lett., vol. 80, no. 9, p. 1988, 1998.
[PER 99] PERTSEV N.A., ZEMBILGOTOV Z.G., TAGANTSEV A.K., “Equilibrium states and phase transitions in epitaxial ferroelectric thin films”, Ferroelectrics, vol. 223, no. 1–4, pp. 79–90, 1999.
[PER 00] PERTSEV N., TAGANTSEV A., SETTER N., “Phase transition and strain-induced ferroelectricity in SrTiO3 pitaxial thin films”, Phys. Rev. B, vol. 61, no. 2, p. R825, 2000.
[PER 02] PERTSEV N., TAGANTSEV A., SETTER N., “Erratum: Phase transitions and straininduced ferroelectricity in SrTiO3 epitaxial thin films[PRB61-R825(2000)]”, Phys. Rev. B, vol. 65, p. 219901, 2002.
[PER 03] PERTSEV N., KUKHAR V., KOHLSTEDT H.,WASER R., “Phase diagrams and physical properties of single-domain epitaxial PZT thin films”, Phys. Rev. B, vol. 67, p. 054107, 2003.
[RIO 06] RIOS S., SCOTT J.F., LOOKMAN A., MCANENEY J., BOWMAN R.M., GREGG J.M., “Phase transitions in epitaxial Ba0.5Sr0.5TiO3 thin films”, J. Appl. Phys., vol. 99, no. 2, p. 024107, 2006.
[ROY 76] ROYTBURD A.L., “Equilibrium structure of epitaxial layers”, Physica Status Solidi (a), vol. 37, no. 1, pp. 329–339, 1976.
[ROY 98a] ROYTBURD A., “Thermodynamics of polydomain heterostructures. I. Effect of macrostresses”, J. Appl. Phys., vol. 83, no. 1, p. 228, 1998.
[ROY 98b] ROYTBURD A., “Thermodynamics of polydomain heterostructures. II. Effect of microstresses”, J. Appl. Phys., vol. 83, no. 1, p. 239, 1998.
[SHA 04] SHARMA A., BAN Z.G., ALPAY S.P., MANTESE J.V., “Pyroelectric response of ferroelectric thin films”, J. Appl. Phys., vol. 95, no. 7, p. 3618, 2004.
[SHI 50] SHIRANE G., HOSHINO S., SUZUKI K., “X-ray study of the phase transition in lead titanate”, Phys. Rev., vol. 50, pp. 1105–1106, 1950.
[SIC 09] SICHUGA D., PONOMAREVA I., BELLAICHE L., “Phase diagrams of epitaxial Pb(Zr,Ti)O3 ultrathin films from first principles”, Phys. Rev. B (Condensed Matter and Materials Physics), vol. 80, no. 13, p. 134116, APS, 2009.
[SPE 94] SPECK J., POMPE W., “Domain configurations due to multiple misfit relaxation mechanisms in epitaxial ferroelectric thin films. I. Theory”, J. Appl. Phys., vol. 76, no. 1, p. 466, 1994.
[TAG 04] TAGANTSEV A.K., Private communication, 2004.
[TOU 77] TOULOUKIAN Y., KIRBY R., TAYLOR R., LEE T., Thermal Expansion: Nonmetalic Solids Volume 13, Thermodynamical Properties of Matter, IFI-Plenum, New York, 1977.
[TUT 93] TUTTLE B., VOIGT J.A., GOODNOW D.C., LAMPPA D.L., HEADLEY T.J., EATOUGH M.O., ZENDER G., NASBY R.D., RODGERS S.M., “Highly oriented, chemically prepared Pb(Zr, Ti)O3 thin films”, J. Am. Ceram. Soc., vol. 76, no. 6, p. 1537, 1993.
[ZHA 02] ZHAO M.H., FU R., LU D., ZHANG T.Y., “Critical thickness for cracking of Pb(Zr0.53Ti0.47)O3 thin films deposited on Pt/Ti/Si(100) substrates”, Acta Materialia, vol. 50, no. 17, p. 4241, 2002.
[ZHE 04] ZHENG X., LI J., ZHOU Y., “X-ray diffraction measurement of residual stress in PZT thin films prepared by pulsed laser deposition”, Acta Mater., vol. 52, no. 11, p. 3313, 2004.
1 Chapter written by Pierre-Eymeric JANOLIN.
1 For a discussion on the misfit strain concept, see p. 50.
2 We use the Voigt notation with axis 3 parallel to the z-axis, that is, perpendicular to the interface. We therefore have the following relations:
3 A phase b could be defined. In such a phase, only the component P2 is non-zero. Nevertheless, the symmetry of system makes it formally equivalent to the phase a. It is therefore not mentioned hereafter.
4 Let us note that the sum of these microstresses is zero. In fact, each microstress represents a deviation compared to the macroscopic stress. Thus, for two types of domains, the energy associated with the microstresses (emicro) is written as follows:
![]()
By definition, the average macroscopic elastic energy ![]() is equal to the sum weighted by the volume fractions (1 — α and α) of the elastic energies of each type of domain
is equal to the sum weighted by the volume fractions (1 — α and α) of the elastic energies of each type of domain ![]() :
:
[2.8] ![]()
The sum of the elastic energies due to the microstresses on the whole system is therefore zero because:
with the definition of the macroscopic elastic energy (equation [2.8]).
5 The last term of the elastic energy for the domains (2) has been forgotten in the expression reported in Table I of the article by Alpay and Royburd [ALP 98], without any repercussions in the subsequent calculations of the article. The elastic energy of the domains (1) is necessarily equal to that of the domains (2) as long as the problem is symmetric with respect to the direction “(1)+(2)”.
6 For a domain structure that includes the three types of domains (a1/a2/c, which can also be seen as a mixture of structures a1/c/a1/c and a2/c/a2/c), Roytburd et al. showed that, for symmetry reasons, the fraction of c domains in the a1/c and a2/c domains should be equal and that the film should be composed of as many a1/c domains as there are a2/c domains [ROY 76]. Under these conditions, the equilibrium elastic energy is obtained for a proportion of c domains equal to [TAG 04]:
[2.14] ![]()
This implies that the substrate must have a lattice parameter that satisfies a < as < c+a/2. We shall not consider this case here. However, including this possibility in the calculations would not bring any major difficulties.
7 Alpay and Roytburd consider the Gibbs free energy [ALP 98]. The problem has been simplified by omitting the terms that are related to the application of an external pressure and by considering an infinitely thick substrate, which corresponds to the system studied in this chapter.
8 An error occurred in this article by Alpay et al. The factor ¼ of their equation [2.6] — which is analogous to our equation [2.18] — is actually included in their expression of ![]() .
.
9 The expression in the article by Alpay and Roytburd appears as ![]() , where the factor 1/4 should not appear and the strain
, where the factor 1/4 should not appear and the strain ![]() should be replaced by the energy
should be replaced by the energy ![]() to ensure the homogeneity of the formula.
to ensure the homogeneity of the formula.
10 Also spelled Kukhar.
11 This is valid as long as the domain walls density in the film is not to be determined. This density may, however, be evaluated in the linear elastic approximation [PER 95] and such calculations confirm that the energy of the domain walls can be neglected even for films of 100 nm.
12 For PZT 20/80, Young’s modulus: E = 122 GPa and Poisson’s ratio: ν = 0.36. For PbTiO3, Young’s modulus: E = 130 GPa and Poisson’s ratio: ν = 0.37.