Chapter 12
Troubleshooting an Oracle Database
In This Chapter
![]() Using a system-level troubleshooting methodology
Using a system-level troubleshooting methodology
![]() Troubleshooting with Oracle database logs
Troubleshooting with Oracle database logs
![]() Employing other diagnostic utilities
Employing other diagnostic utilities
No matter what the salespeople claim, any system made by mortal beings will have issues and sometimes even break; that’s reality. Worse yet, those same salespeople who claimed their system was perfect aren’t around to fix it when it does break; that’s your job. Fortunately, this chapter provides the information you need when problems arise.
Before jumping into database-specific diagnostic techniques, we give you a method for troubleshooting at the system level. Remember: Oracle exists as part of an overall information system. Here you explore the methods and tools you need to operate at system level.
Oracle provides a wealth of information, almost an overload, in its multiple log and trace files. Between the different files and tracing levels, odds are good that the information you need to solve the problem is there somewhere . . . if you know where to look for it. We provide that knowledge.
Just when you thought you couldn’t get any more information about your Oracle database, we do just that via Oracle diagnostic tools and scripts. We’re not showing tools that provide pointless data; rather, we explain tools that provide fast, actionable information.
Troubleshooting with System Methodology
If an Oracle crash hasn’t happened to you yet, it will happen sometime. When it does, it won’t be at a convenient time.
The problem is that people assume that because they have an Oracle-based system, the problem must be with Oracle. It could be, but you don’t know just yet. Oracle is simply a component of a larger system, and the root cause and solution may not be Oracle-based. Even if you get an Oracle database error message, the cause may be something outside of Oracle. We often see people become so focused on the specific error message that they lose awareness of the overall system environment hosting the database. Be sure to look at the overall system supporting the database, not just the database itself.
 Don’t react to a problem report on face level. Apply a structured, repeatable pattern when addressing problems. We can’t stress this next statement enough: Yours is a technical profession, and you’re paid to solve problems, not simply to react and hope for a quick fix.
Everyone has a troubleshooting methodology tailored for their unique environment, but we suggest the following as a start:
1. Identify the real problem. Determine and confirm what’s happening in the system.
2. Perform basic system checks. Check the server, operating environment, and connectivity for outright errors and performance degradation.
3. Perform basic database checks. Confirm that the database is running and see whether you can log in to it.
4. Determine what your error messages mean.
5. Develop a solution and apply it. Confirm that the fix works and that there aren’t unintended consequences.
With experience and time, you will modify these steps for your environment. Depending on the situation, you may process some steps very fast — but they’re still processed, not skipped.
Identifying the real problem
Before doing anything to fix the perceived problem, you need to know what the real problem is. You can’t guess or assume. It’s far better to treat the real cause of a problem, not just the symptoms.
People reporting problems get excited, miss key details, make assumptions, and often inaccurately state the nature and severity of a problem; that’s simply human nature. If you think otherwise, ask any cop or ER doctor about the quality of the initial witness reports they receive. This is exacerbated in computer work because many people who are reporting problems aren’t technical and can’t articulate their problems very well.
You need to determine what system component has the problem and what is specifically happening before you can develop and apply a fix. Ask the following questions:
![]() What: What specifically is happening? Have the user walk through what he’s doing when the error occurs. Work directly with the person having problems and monitor the issue in real time rather than getting second- or third-hand information. Get screen shots or the error messages themselves.
What: What specifically is happening? Have the user walk through what he’s doing when the error occurs. Work directly with the person having problems and monitor the issue in real time rather than getting second- or third-hand information. Get screen shots or the error messages themselves.
![]() Who: Who’s being impacted? Is it one or two users? Is it a specific subclassification of users? Is it everyone? Also, is it your production, test, or development system? Never assume that because someone is excited, it must be production. Trying to fix the wrong database will leave you blushing with embarrassment.
Who: Who’s being impacted? Is it one or two users? Is it a specific subclassification of users? Is it everyone? Also, is it your production, test, or development system? Never assume that because someone is excited, it must be production. Trying to fix the wrong database will leave you blushing with embarrassment.
![]() Where: Are affected users spread over a wide geographic location, or are they in a specific city or building?
Where: Are affected users spread over a wide geographic location, or are they in a specific city or building?
![]() When: How long has this been occurring, and has it occurred before? Also, does it happen every time or just sometimes? If it happens only occasionally, drill down into what’s being done prior to the error. If it occurred only since a recent system change (such as a patch, an upgrade, or a reboot), that can be a valuable clue. The question “What has recently changed in the system?” is a great one to ask!
When: How long has this been occurring, and has it occurred before? Also, does it happen every time or just sometimes? If it happens only occasionally, drill down into what’s being done prior to the error. If it occurred only since a recent system change (such as a patch, an upgrade, or a reboot), that can be a valuable clue. The question “What has recently changed in the system?” is a great one to ask!
![]() How bad: Is this a total loss of service where the company is stopped, or is it just an annoyance on a seldom-used development system?
How bad: Is this a total loss of service where the company is stopped, or is it just an annoyance on a seldom-used development system?
After asking these questions, you should know what’s happening, who it’s happening to, how bad it is, and when it started. You should also have a rough idea of what subsystem or components to start checking.
 Keep a cool head when troubleshooting hot issues; be methodical and work in a logical manner until the problem is fixed (and confirmed to be fixed). Other people may become excited, stressed, or unprofessional, but you need to keep your wits and professionalism as you work toward a solution. Don’t let yourself be intimidated by irate users or management standing over your shoulder.
Performing basic system checks
You need to perform basic system checks to ensure the system is in a state that can support a database. If the network is down, server is overloaded, or disk system has run out of space, your database may be impacted and display database errors, but the root problem is system related.
Investigate these key areas:
![]() Network: Can you connect to the server or application?
Network: Can you connect to the server or application?
![]() Server utilization: What are the top processes on the server?
Server utilization: What are the top processes on the server?
![]() CPU utilization: Is the CPU maxed out?
CPU utilization: Is the CPU maxed out?
![]() Memory: How much memory is available?
Memory: How much memory is available?
![]() Available disk space: Is there disk space available?
Available disk space: Is there disk space available?
![]() System event logs: Is anything being reported to the system?
System event logs: Is anything being reported to the system?
You don’t need to be a system administrator to perform these checks.
Network
If you can’t connect to the database server, odds are good that your users can’t either. You have two easy ways to check this:
![]() Ping to test server connectivity.
Ping to test server connectivity.
![]() Log in to the server as the Oracle user.
Log in to the server as the Oracle user.
From the DOS or Linux command prompt, type ping SERVER NAME to see whether the target server can be reached.
$ ping oralinux1
PING oralinux1 (192.168.2.121) 56(84) bytes of data.
64 bytes from oralinux1 (192.168.2.121): icmp_seq=1 ttl=64 time=0.020 ms
64 bytes from oralinux1 (192.168.2.121): icmp_seq=2 ttl=64 time=0.007 ms
64 bytes from oralinux1 (192.168.2.121): icmp_seq=3 ttl=64 time=0.007 ms
--- oralinux1 ping statistics ---
3 packets transmitted, 3 received, 0% packet loss, time 1999ms
rtt min/avg/max/mdev = 0.007/0.011/0.020/0.006 ms
In the preceding code, three ping packets were sent, and all three arrived successfully. Depending on the ping version, you get back slightly different output, but all outputs specify whether the server was reachable.
If the server comes back as unavailable, the problem is one of these things:
![]() The server is shut down.
The server is shut down.
![]() The network is down.
The network is down.
![]() You’re prevented from pinging servers.
You’re prevented from pinging servers.
Sometimes security blocks the ping utility, so check whether it works before problems occur so you know the test is valid.
After you confirm the server can be reached, try actually logging in as the owner of the Oracle software if possible. Note that on some systems you have to log in as yourself (for security-auditing purposes) and then switch users to the Oracle software owner. This action confirms the server is not only running but also able to support a login attempt.
Server utilization
If a program, process, or job is consuming all the resources on a server and has been doing so for a long enough time, a database can
![]() Slow down
Slow down
![]() Be rendered unusable
Be rendered unusable
![]() Be killed (in rare cases)
Be killed (in rare cases)
The processes themselves may be one of three things: valid, a competing database (multiple databases can be on the same server), or an out-of-control, runaway process.
You must identify the programs that are running before you can determine whether they’re valid or hurting the system. There are several graphical tools to do this.
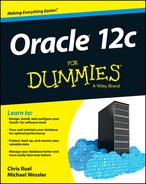
![]() On Windows, use Windows Task Manager to see which applications are running (under the Applications tab). For more detail, use the Processes tab shown in Figure 12-1.
On Windows, use Windows Task Manager to see which applications are running (under the Applications tab). For more detail, use the Processes tab shown in Figure 12-1.
![]() For Linux/UNIX, use the command top to display the top processes on a server and their process ID (PID), as shown in Figure 12-2. The output is text based and refreshed every few seconds.
For Linux/UNIX, use the command top to display the top processes on a server and their process ID (PID), as shown in Figure 12-2. The output is text based and refreshed every few seconds.
Additionally, at the top of the screen is the machine’s load average. This derived value reflects relative load on the server.
![]() Values up to 3 are light and shouldn’t reflect performance problems.
Values up to 3 are light and shouldn’t reflect performance problems.
![]() Values in the teens reflect higher use of a busy system, and performance may suffer.
Values in the teens reflect higher use of a busy system, and performance may suffer.
![]() Values above 20 indicate a busy system where performance is likely impacted.
Values above 20 indicate a busy system where performance is likely impacted.
For Linux/UNIX, the uptime command helps you see system load:
$ uptime
23:13:03 up 4 days, 10:27, 1 user, load average: 0.00, 0.00, 0.00
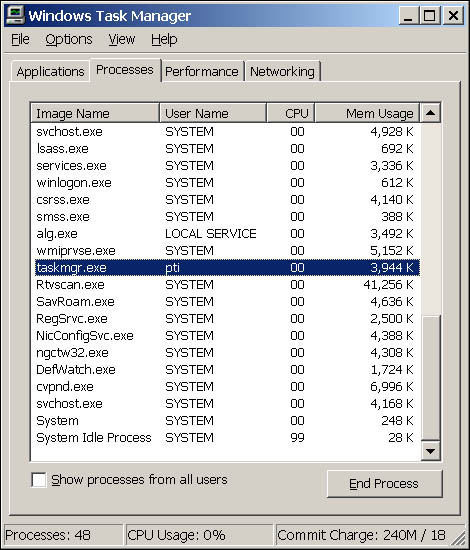
Figure 12-1: Windows Task Manager has multiple processes executing as multiple users via the Processes tab.
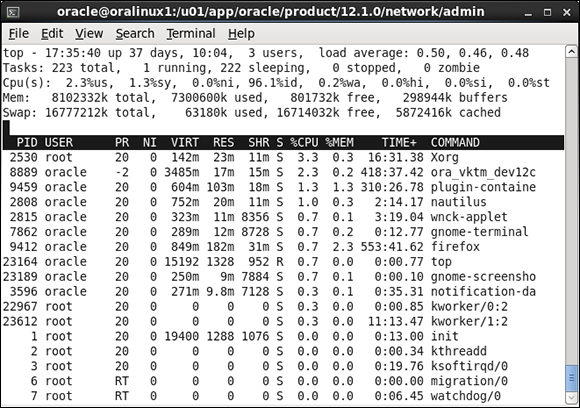
Figure 12-2: The top utility shows the top processes.
System load values are the same as with the top command:
![]() The leftmost value is the current load.
The leftmost value is the current load.
![]() The middle value is the load 5 minutes previous.
The middle value is the load 5 minutes previous.
![]() The rightmost value is the load 15 minutes prior.
The rightmost value is the load 15 minutes prior.
Another useful value is the time since the last server restart. Obviously if users reported problems and you see the server recently rebooted a few minutes prior, the server reboot (or crash) is the likely culprit.
![]() On UNIX Oracle Solaris systems, prstat is an alternative to top.
On UNIX Oracle Solaris systems, prstat is an alternative to top.
![]() On HP-UX systems, the glance command is extremely useful.
On HP-UX systems, the glance command is extremely useful.
CPU utilization
Servers may have single or multiple CPUs. Regardless, processing needs to be available for the server to process application requests.
 If a machine has a very high or complete CPU use, performance issues will occur.
![]() On Windows, the previously mentioned Windows Task Manager has a Performance tab. That tab displays CPU use as a percentage and as recent spikes; see Figure 12-3.
On Windows, the previously mentioned Windows Task Manager has a Performance tab. That tab displays CPU use as a percentage and as recent spikes; see Figure 12-3.
![]() For Linux/UNIX systems, the previously described top command displays CPU utilization at the top of the screen.
For Linux/UNIX systems, the previously described top command displays CPU utilization at the top of the screen.

Figure 12-3: The Windows Task Manager Perform-ance tab shows CPU use.
Memory
If the server is lacking memory, system performance suffers or even stands still. It isn’t desirable to run a server with little or no memory available. If you find the server is consistently memory starved, either add more memory or reduce the amount of memory allocated for programs.
![]() To check memory on Windows, the Windows Task Manager Performance tab provides the total memory on the machine and amount available.
To check memory on Windows, the Windows Task Manager Performance tab provides the total memory on the machine and amount available.
![]() Linux/UNIX systems have multiple tools to check memory, but the top utility provides this information rapidly.
Linux/UNIX systems have multiple tools to check memory, but the top utility provides this information rapidly.
Available disk space
Disk space is different than disk utilization. The frequency of reads and writes on a disk is utilization and can be a major performance factor. Running out of available disk space can bring your system to a halt and is the focus here because you, as the DBA, can do something about it.
However, poor disk utilization won’t often bring your system to a complete standstill without warning. Measuring and accurately interpreting disk utilization, especially in large SAN environments, is outside the scope of this book. You should work with your storage engineers to address that topic.
What can happen when a disk fills up? It depends on what’s writing to that disk. At minimum, log files can’t be written to and tablespaces can’t be expanded. At worst, archive log files can’t be successfully written, and the database hangs. With other software, processes can spin high amounts of CPU, and Java Virtual Machines can crash. Any one of these problems is likely to generate a panicked call to your desk.
The quickest way to check for disk space is to see if any file systems are 100 percent full.
![]() For Windows systems, the fastest way is to go to My Computer and look at free space for each disk drive. Be sure to have the Details option selected on the View tab to get the full information.
For Windows systems, the fastest way is to go to My Computer and look at free space for each disk drive. Be sure to have the Details option selected on the View tab to get the full information.
![]() The df -m command helps Linux and Oracle Solaris users:
The df -m command helps Linux and Oracle Solaris users:
$ df -m
Filesystem 1M-blocks Used Available Use% Mounted on
/dev/sda3 8064 3587 4068 47% /
tmpfs 3957 1885 2072 48% /dev/shm
/dev/sda5 8064 208 7447 3% /home
/dev/sda6 8064 147 7508 2% /tmp
/dev/sda1 64310 17016 44028 28% /u01
/dev/sr0 2367 2367 0 100% /media/ Oracle12cBeta
This code shows the file systems, their percentage used, percentage free (available), and the actual amounts in megabytes. The df -k command can show the same info but listed in kilobytes. The –k flag is useful because some versions of UNIX don’t support the -m flag.
![]() On HP-UX UNIX systems, use bdf.
On HP-UX UNIX systems, use bdf.
System event logs
If all else fails, listen to what the computer is telling you. As a DBA, you should have at least read access to the system event logs on your server and hopefully all servers that are part of the application. System event logs record routine events on the server but also may list special error events that could be the cause of your system problems. Sometimes the event logs clearly list hardware issues, or that the file systems are full, or that the machine just rebooted or crashed. All of these are good things to know when you’re trying to track down a problem.
The location of the event logs can vary, and often additional logs are beyond the OS logs to review when you learn your system.
![]() On Windows systems, go to Control Panel⇒Administrative Tools⇒Event Viewer to see the system and application logs.
On Windows systems, go to Control Panel⇒Administrative Tools⇒Event Viewer to see the system and application logs.
![]() On Linux/UNIX systems, /var/adm/messages and /var/log/syslog are quite valuable. The dmesg command can see the end of the most recent system log file.
On Linux/UNIX systems, /var/adm/messages and /var/log/syslog are quite valuable. The dmesg command can see the end of the most recent system log file.
Much of this information may not make sense to a DBA who isn’t OS savvy; however, seeing errors can be enough to seek the opinion of the system administrator.
Performing basic database checks
If you’ve confirmed you can get to the server and that it should be able to support an application database, perform three basic database checks:
![]() Verify the database is running.
Verify the database is running.
![]() Verify Oracle Net functionality.
Verify Oracle Net functionality.
![]() Perform a database connection.
Perform a database connection.
Running database instance
You should check whether the database is actually running because, sometimes, databases crash, fail to startup, or for whatever reason are not running when they should be running. Automated monitoring tools to detect if a database is not running are plentiful, but every DBA should know how to check if their database is indeed running.
Oracle database instances execute with different mandatory processes, such as PMON.
![]() On Windows systems, go to Control Panel⇒Administrative Tools⇒Services to see whether the Oracle service has started. You can also look under Windows Task Manager to find similar information.
On Windows systems, go to Control Panel⇒Administrative Tools⇒Services to see whether the Oracle service has started. You can also look under Windows Task Manager to find similar information.
![]() On Linux/UNIX systems, simply check for the PMON process. Without PMON, there’s no Oracle database instance running.
On Linux/UNIX systems, simply check for the PMON process. Without PMON, there’s no Oracle database instance running.
$ ps -ef|grep pmon
oracle 8885 1 0 Jul20 ? 00:04:51 ora_pmon_dev12c
The PMON process is for dev12c, which is a running Oracle database. You could search for additional database processes, but if you know PMON is, you can safely assume the rest of the database instance is running too.
After you confirm a working basic network infrastructure and a connectable database server, you have to confirm the Oracle Net infrastructure is working so users can connect to the database.
Oracle Net functionality
Execute tnsping from the DOS or Linux command prompt. It uses the Oracle Net protocol to see whether it can connect to the database.
$ tnsping dev12c
TNS Ping Utility for Linux: Version 12.1.0.1.0 - Production on 02-AUG-2013 17:37:36
Copyright (c) 1997, 2013, Oracle. All rights reserved.
Used parameter files:
/u01/app/grid/12.1.0/network/admin/sqlnet.ora
Used TNSNAMES adapter to resolve the alias
Attempting to contact (DESCRIPTION = (ADDRESS_LIST = (ADDRESS = (PROTOCOL = TCP)(HOST = oralinux1)(PORT = 1521))) (CONNECT_DATA = (SERVICE_NAME = dev12c)))
OK (40 msec)
Note how the output from a tnsping specifies the host, port, and SID information for that database. This information is valuable when troubleshooting errors.
![]() If the output for host, port, or SID doesn’t match what you know to be correct, it is a clue.
If the output for host, port, or SID doesn’t match what you know to be correct, it is a clue.
![]() If output for the tnsping doesn’t come back at all, it may be a network or server failure.
If output for the tnsping doesn’t come back at all, it may be a network or server failure.
![]() Depending on the Oracle error returned, a tnsping test may suggest an error with the database listener process.
Depending on the Oracle error returned, a tnsping test may suggest an error with the database listener process.
Database connection
When you know the database is up and you can establish an Oracle Net communications handshake, log in to see whether you can establish a database session.
1. Identify the problem tier that users are reporting.
In a client-server application, this tier is the workstation.
In a multi-tier architecture, this tier is likely the web application server.
2. From the tier where the problem exists, try logging in to the database via SQL*Plus, preferably as a typical user, to mimic the connection which is failing.
Here’s connecting as an application user to a remote database dev12c:
$ sqlplus dwilson@dev12c
SQL*Plus: Release 12.1.0.1.0 Production on Fri Aug 2 17:38:32 2013
Copyright (c) 1982, 2013, Oracle. All rights reserved.
Enter password:
Last Successful login time: Sat Jul 20 2013 11:05:24 -04:00
Connected to:
Oracle Database 12c Enterprise Edition Release 12.1.0.1.0 - 64bit Production
With the Partitioning, OLAP, Advanced Analytics and Real Application Testing options
SQL> show user
USER is "DWILSON"
The SQL*Plus attempt shows a successful connection to a remote database as an application user. You want to force the use of the Oracle Net infrastructure in this test. The @dev12c denotes that you’ll use Oracle Net to connect to the remote database rather than directly logging in if you’re already on the same server.
If you logged in, you’re done with your basic database checks; you confirmed a user can connect to the database. On the other hand, you may have encountered any of the following common errors:
![]() You cannot archive the log file. If the archive dump destination is full, or for any other reason the archiver processes can’t properly write the archive log file, your login attempt fails. Oracle does this because even a login generates archive log information and Oracle guarantees it will track that information or it won’t perform the action.
You cannot archive the log file. If the archive dump destination is full, or for any other reason the archiver processes can’t properly write the archive log file, your login attempt fails. Oracle does this because even a login generates archive log information and Oracle guarantees it will track that information or it won’t perform the action.
Fix: Resolve that archiver problem.
You can always log in on the server itself with / as sysdba to perform maintenance.
![]() The database is in a restricted session. The database may be running, but if it’s in a restricted session, then only users with RESTRICTED SESSION system privilege can log in. Generally, the database is in the state because some form of database maintenance is occurring and the DBA doesn’t want normal users in the system.
The database is in a restricted session. The database may be running, but if it’s in a restricted session, then only users with RESTRICTED SESSION system privilege can log in. Generally, the database is in the state because some form of database maintenance is occurring and the DBA doesn’t want normal users in the system.
Fix: Determine why the database is in restricted session mode and take it out of that mode if appropriate. Or you can grant RESTRICTED SESSION to the user(s), but that usually defeats the purpose of having restricted session.
![]() The login simply hangs. Sometimes the login attempt hangs and doesn’t immediately generate an error message. These can be tough to diagnose because you’re not getting any feedback.
The login simply hangs. Sometimes the login attempt hangs and doesn’t immediately generate an error message. These can be tough to diagnose because you’re not getting any feedback.
Fix: Try connecting from a different tier. Also try logging in from the database server itself; see whether you can find where you can connect from and generate an actionable log message. Also revalidate your network, server, and system checks to confirm that they’re valid and then search for error messages.
Performing basic database checks is a way to confirm there’s nothing obviously wrong with the database, such as it isn’t running or you can’t connect to it. After you perform those checks, you can begin the more detailed problem and error log analysis.
Analyzing error messages
Ever hear the expression “hiding in plain sight”? That phrase often applies when people see an Oracle error message. They see the message, but they don’t actually read it and think about what it says. As a result, the most valuable clue you have isn’t fully maximized.
Avoid falling into that trap. Make the most of your error messages:
![]() Slow down and read the error message — several times if necessary. Think about what it’s saying. Don’t just rattle off ORA-1234 and the description. Ask yourself what specific action is failing based on the context of the error message and what is going on at the time of the message.
Slow down and read the error message — several times if necessary. Think about what it’s saying. Don’t just rattle off ORA-1234 and the description. Ask yourself what specific action is failing based on the context of the error message and what is going on at the time of the message.
![]() Pretend you’re the application and ask what you were doing when the error occurred. Then apply the text of the message to see which piece or action is failing. Breaking down a larger process into individual steps and performing each step to see where something breaks is an effective troubleshooting technique.
Pretend you’re the application and ask what you were doing when the error occurred. Then apply the text of the message to see which piece or action is failing. Breaking down a larger process into individual steps and performing each step to see where something breaks is an effective troubleshooting technique.
![]() Apply most of your focus on the first error message you receive. Often a series of error messages occurs related to one event, but typically that first message is the cause of the other messages.
Apply most of your focus on the first error message you receive. Often a series of error messages occurs related to one event, but typically that first message is the cause of the other messages.
![]() Know the types of error messages and which components they relate to:
Know the types of error messages and which components they relate to:
• ORA denotes database or SQL errors.
• TNS denotes database listener or Oracle Net communication issues.
• HTTP is web related.
• LDAP denotes details with your directory server, perhaps Oracle Internet Directory.
The architecture of your system determines what components may generate errors. Know what components exist within the system and the process flow so you can tell what part of the system is failing based on the type of message.
![]() Become familiar with normal messages versus extraordinary error messages. Many harmless informational messages crop up for events that aren’t errors — particularly when working with log files. Know what your system logs look like during normal operations so that when real errors occur, you can identify them easily.
Become familiar with normal messages versus extraordinary error messages. Many harmless informational messages crop up for events that aren’t errors — particularly when working with log files. Know what your system logs look like during normal operations so that when real errors occur, you can identify them easily.
![]() Plug the error message into My Oracle Support (formerly Oracle Metalink) and your favorite Internet search utilities to get more detailed descriptions and possible fixes. Expect lots of irrelevant information and false leads. But odds are good that your search results will also include information that helps identify and fix the problem.
Plug the error message into My Oracle Support (formerly Oracle Metalink) and your favorite Internet search utilities to get more detailed descriptions and possible fixes. Expect lots of irrelevant information and false leads. But odds are good that your search results will also include information that helps identify and fix the problem.
Knowing database and system anatomy
A firm understanding of Oracle database architecture and processes is key to your ability to understand error messages and diagnostic output. Think of it as database anatomy. You would flee if your doctor said “I don’t really understand that heart stuff,” right? Similarly, what kind of DBA is clueless about the SYSTEM tablespace? Even if you think you know it, a periodic review of Chapter 2 is time well spent for any DBA.
Where in the overall system does your database fit, and what are the components? If people are reporting an HTTP-404 error, you probably want to get the web administrator involved because the problem may be a web server or content. But if your database generates the HTML content via mod_plsql Web Toolkit, it may actually be your database having issues. Not knowing that would result in the problem being routed to the wrong people, further delaying the fix. There simply is no substitute for knowing the specifics of how your system works and being able to apply that knowledge.
Error system example
Look at this example of a common message that confuses people. Upon analysis, the cause is simple to identify.
ORA-01034: ORACLE not available.
ORA denotes a database message (versus TNS for a listener or HTTP for a web error). What does Instance not available mean in terms of databases? If you know database architecture, you know that an instance is the memory and background processes for a database. Thus, the database instance may not be running; you need to confirm that.
A quick ps –ef | grep pmon on the server shows no PMON process running, so now you have confirmed the database instance is down. A further check using the uptime command shows the server was restarted 15 minutes ago; you can assume the database didn't restart after a server crash or reboot. At this point, you can check database logs to see whether the instance tried to restart and failed or no attempt was made to restart. Based on that, you can manually restart the database and get users back to work.
oerr utility
The oerr utility gets more information about an error message. This command-line utility is where you specify an error number and the oerr utility provides the most likely problem causes and possible solutions. Although it isn’t in-depth troubleshooting, it is very handy:
$ oerr ora 1034
01034, 00000, "ORACLE not available"
// *Cause: Oracle was not started up. Possible causes include the following:
// - The SGA requires more space than was allocated for it.
// - The operating-system variable pointing to the instance is
// improperly defined.
// *Action: Refer to accompanying messages for possible causes and correct
// the problem mentioned in the other messages.
// If Oracle has been initialized, then on some operating systems,
// verify that Oracle was linked correctly. See the platform
// specific Oracle documentation.
Developing and applying a solution
How do you fix a problem? Sometimes it is a simple command that is obvious even to the most inexperienced administrator. More commonly it is a multi-step operation that may span both database and non-database areas. Consider these guidelines as you develop and implement your plan.
For very simple and obvious fixes, you clearly aren’t going to apply every step listed in the following exhaustive detail. However, you should review the guidelines and see how they apply to what you’re doing.
Technical fixes and software patches don’t always work, which is outside your control. However, planning the repair process is something you can control, and it will better the odds of your success greatly.
Researching
You should understand what is happening and why. What is causing the problem and how is that best remedied?
![]() Review the error messages.
Review the error messages.
![]() Read the documentation.
Read the documentation.
![]() Search the Internet.
Search the Internet.
![]() Talk to other administrators.
Talk to other administrators.
![]() Get Oracle Support assistance.
Get Oracle Support assistance.
It’s dangerous to apply a fix when you don’t know why something is occurring. Only through understanding will you have the confidence that whatever fix you apply is the right one and won’t cause further damage.
Develop the pseudo-code list of steps that you will need to perform based on your research. This task may bring up more questions as it is developed, but that’s good. The end product is a high-level plan for fixing the problem.
Planning
How will you specifically fix the problem? After creating your high-level plan, make it technically detailed:
![]() Identify the technical substeps for each high-level pseudo-code step.
Identify the technical substeps for each high-level pseudo-code step.
![]() Know what commands need to be issued and by which account.
Know what commands need to be issued and by which account.
![]() Know the time necessary for each step to occur and dependencies between steps.
Know the time necessary for each step to occur and dependencies between steps.
![]() If additional software or patches are required, make sure those needs are addressed.
If additional software or patches are required, make sure those needs are addressed.
Have another administrator review your fix-planning steps to make sure you haven’t skipped anything.
Ramifications
If you perform the fix, what are the side effects?
![]() Will you have to restart and place the system in restricted session for a complex fix, kicking off system users?
Will you have to restart and place the system in restricted session for a complex fix, kicking off system users?
![]() How long will the system be unavailable? Remember to leave yourself a margin for error and unexpected issues.
How long will the system be unavailable? Remember to leave yourself a margin for error and unexpected issues.
![]() When is the best downtime to impose a reduced impact on end users while still having outside support if needed?
When is the best downtime to impose a reduced impact on end users while still having outside support if needed?
![]() Can you perform the fix solo, from end to end, or do you need help from other groups (such as networking or the system administrator)?
Can you perform the fix solo, from end to end, or do you need help from other groups (such as networking or the system administrator)?
![]() Does the fix void your software warranty or break other components?
Does the fix void your software warranty or break other components?
Unfortunately, not all solutions are easy decisions and sometimes there are downsides to a fix. Carefully weigh the benefits of a fix and the negatives of the existing problem against the downsides of implementing the fix. Be sure to include input from all affected parties to allow a more informed decision.
Coordinating with other groups and the user community for a fix is often a big hurdle when working on large, distributed, and complex systems. It’s helpful to have management support as well as documented policies and procedures to support coordination efforts.
Testing
Don’t tell me you’re trying something in production before testing it first! If at all possible, re-create the problem in a test environment and apply the fix there before doing it in production.
Testing accomplishes these things:
![]() Ensures your steps are complete
Ensures your steps are complete
![]() Provides accurate timeframes for the total fix
Provides accurate timeframes for the total fix
![]() Verifies your syntax with the opportunity to make mistakes
Verifies your syntax with the opportunity to make mistakes
![]() Confirms the problem is actually fixed
Confirms the problem is actually fixed
![]() Verifies there are no unintended consequences
Verifies there are no unintended consequences
Many organizations are under mandate to test changes before going into production, and that is generally a good policy. When you’re troubleshooting complex problems or operating on large amounts of data, testing is even more important.
We’ve seen many ill-advised attempts at applying untested fixes that ended in disastrous results. Don’t let that happen to you.
Fallback options
The fix doesn’t work and things go from bad to worse. You do have a fallback plan, right? A good administrator always has a workable fallback plan for when things go wrong. Those who don’t, sooner or later, end up seeking other employment opportunities.
Before performing nearly any technical fix, do these things:
![]() Take another database backup or verify that your most recent backups are valid and accessible.
Take another database backup or verify that your most recent backups are valid and accessible.
![]() If backups are stored offsite for disaster recovery, recall those backups. You may need them before you start your maintenance operation.
If backups are stored offsite for disaster recovery, recall those backups. You may need them before you start your maintenance operation.
![]() Consider taking multiple backup copies too, in case one copy is bad. Parachutists jump with a backup chute; shouldn’t you?
Consider taking multiple backup copies too, in case one copy is bad. Parachutists jump with a backup chute; shouldn’t you?
After large amounts of data have been modified, can it be undone without a backup? You may need to work with the application developers on data changes. Also consider other items that need to be undone outside the database. For example, a network change with DNS may require several hours to take effect. If you push a change to thousands of client workstations, how do you roll that back if necessary?
Support
Odds are good that you’ll be performing your maintenance over a weekend or late at night. If so, are the other people available to perform their parts of the fix?
![]() Do you have everyone’s phone numbers?
Do you have everyone’s phone numbers?
![]() Are they willing and able to help you at 3 a.m. when you discover a problem? Be sure to let them know you may require their assistance before you start your work.
Are they willing and able to help you at 3 a.m. when you discover a problem? Be sure to let them know you may require their assistance before you start your work.
![]() Are they authorized to make the change?
Are they authorized to make the change?
Verification
Who is going to test and confirm the fix actually worked? A test plan with testers or knowledgeable users is a good idea, particularly if data or application changes are necessary.
![]() Run through the plan first; otherwise you may discover broken parts of the application unrelated to the problem you’re attempting to fix.
Run through the plan first; otherwise you may discover broken parts of the application unrelated to the problem you’re attempting to fix.
![]() Make sure these testers are available when you’re done with your work.
Make sure these testers are available when you’re done with your work.
Backup
After you’ve developed, tested, applied, and verified your technical fix, what’s the final step before turning it over to the users? Often the final step is performing a full database or system backup. The benefit is that if something unrelated occurs and you need to restore, you don’t need to go through the previous fix.
Troubleshooting Using Oracle Database Logs
You need to dive into the Oracle logs themselves. Each database has a set of directories where key log, trace, and dump files are stored.
Database log infrastructure
Using log files to diagnose a problem is often a daily task for the DBA so knowing how Oracle manages this critical resource is important. Oracle log file structure and management are referred to as the Automatic Diagnostic Repository (ADR). ADR provides these log management capabilities:
![]() Integrated log management not just for the database but other Oracle products. Currently, Automatic Storage Management and listener also write to the new log infrastructure.
Integrated log management not just for the database but other Oracle products. Currently, Automatic Storage Management and listener also write to the new log infrastructure.
![]() Event logging in terms of incidents with included diagnostic data and stored in zip files that can be reviewed and sent to Oracle Support. The idea is to better compartmentalize error events and neatly package them so they can be sent directly to Oracle Support.
Event logging in terms of incidents with included diagnostic data and stored in zip files that can be reviewed and sent to Oracle Support. The idea is to better compartmentalize error events and neatly package them so they can be sent directly to Oracle Support.
![]() Incident flood control to intelligently limit the creation and size of trace files. If an event repeats at an extreme rate above a defined threshold, only the occurrence of the event is logged.
Incident flood control to intelligently limit the creation and size of trace files. If an event repeats at an extreme rate above a defined threshold, only the occurrence of the event is logged.
It’s important to know where the key diagnostic files are located:
![]() The location for the diagnostic subdirectories (diag) is the ADR_BASE and is typically under the ORACLE_BASE.
The location for the diagnostic subdirectories (diag) is the ADR_BASE and is typically under the ORACLE_BASE.
![]() The location of the base for the log subdirectories is the ADR_HOME and is defined by database parameter DIAGNOSTIC_DEST.
The location of the base for the log subdirectories is the ADR_HOME and is defined by database parameter DIAGNOSTIC_DEST.
![]() The ADR_HOME is beneath the ADR_BASE location and is under the database SID directory.
The ADR_HOME is beneath the ADR_BASE location and is under the database SID directory.
The structure for ADR_HOME for databases follows:
$ADR_BASE/diag/rdbms/DATABASE NAME/DATABASE SID
For example, here’s the following structure for the dev12c database:
$ ls $ORACLE_BASE/diag/rdbms/dev12c/dev12c
alert hm incpkg lck metadata metadata_pv sweep
cdump incident ir log metadata_dgif stage trace
The ADR_HOME location is the full path up to and including the second reference to dev12c.
You see this same information neatly stored within the database and can be queried via V$DIAG_INFO:
SQL> select name, value from v$diag_info;
NAME VALUE
----------- ---------------------------------
Diag Enabled TRUE
ADR Base /u01/app/oracle
ADR Home /u01/app/oracle/diag/rdbms/dev12c/dev12c
Diag Trace /u01/app/oracle/diag/rdbms/dev12c/dev12c/trace
Diag Alert /u01/app/oracle/diag/rdbms/dev12c/dev12c/alert
Diag Incident /u01/app/oracle/diag/rdbms/dev12c/dev12c/incident
Diag Cdump /u01/app/oracle/diag/rdbms/dev12c/dev12cl/cdump
Health Monitor /u01/app/oracle/diag/rdbms/dev12c/dev12c/hm
Default Trace File
/u01/app/oracle/diag/rdbms/dev12c/dev12c/trace/dev12c_ora_23293.trc
Active Problem Count 0
Active Incident Count 0
11 rows selected.
Within each database directory are subdirectories where different files are stored. Table 12-1 lists each primary directory and its purpose.
Table 12-1 Database Trace and Log Directories
|
Directory |
Purpose |
|
alert |
Stores very important XML-formatted alert log for database |
|
cdump |
Core dump location of memory stack when a process fails |
|
incident |
Subdirectories relating to individual events or incidents |
|
trace |
Trace and dump files for background and user processes; also contains text formatted alert log |
This is a listing of each directory:
$ ls $ORACLE_BASE/diag/rdbms/dev12c/dev12c
alert hm incpkg lck metadata metadata_pv sweep
cdump incident ir log metadata_dgif stage trace
oralinux1> ls $ORACLE_BASE/diag/rdbms/dev12c/dev12c/alert
log.xml
$ ls $ORACLE_BASE/diag/rdbms/dev12c/dev12c/cdump
$ ls $ORACLE_BASE/diag/rdbms/dev12c/dev12c/incident
$ ls $ORACLE_BASE/diag/rdbms/dev12c/dev12c/trace
alert_dev12c.log dev12c_m000_23037.trc dev12c_ora_6593.trm
dev12c_aqpc_24310.trc dev12c_m000_23037.trm dev12c_ora_760.trc
These directories can get cluttered with many files and eat up disk space.
Have a process to clean up the trace, cdump, and incident directories so they don’t fill up your disk and are easier to manage.
Database alert log
By far the most important file to review for a database is the alert log. This file is where database-level errors are written and operations such as startup, shutdown, and other events are logged. Oracle writes to this text-based file in a chronological order when the database is running.
The alert log is in the alert subdirectory and is named log.xml.
![]() Whenever a problem occurs, review the alert log file.
Whenever a problem occurs, review the alert log file.
![]() Review the alert log file daily (if you’re the DBA) to ensure errors are not occurring undetected.
Review the alert log file daily (if you’re the DBA) to ensure errors are not occurring undetected.
Many DBAs even write scripts to scan the alert log for errors and have e-mail messages sent to them if key events are detected. Also, many DBAs copy off their alert log weekly to prevent it from becoming excessively large.
Here’s a sample of an alert log file in XML format:
<msg time='2013-07-19T13:22:18.955-04:00' org_id='oracle' comp_id='rdbms'
msg_id='opiexe:3292:2802784106' type='NOTIFICATION' group='admin_ddl'
level='16' host_id='oralinux1' host_addr='192.168.1.66'
module='sqlplus@oralinux1 (TNS V1-V3)' pid='24286'>
<txt>Completed: CREATE DATABASE "dev12c"
MAXINSTANCES 8
MAXLOGHISTORY 1
MAXLOGFILES 16
MAXLOGMEMBERS 3
MAXDATAFILES 100
DATAFILE '/u01/app/oracle/oradata/dev12c/system01.dbf' SIZE 700M REUSE
AUTOEXTEND ON NEXT 10240K MAXSIZE UNLIMITED
EXTENT MANAGEMENT LOCAL
SYSAUX DATAFILE '/u01/app/oracle/oradata/dev12c/sysaux01.dbf'
SIZE 550M REUSE AUTOEXTEND ON NEXT 10240K MAXSIZE UNLIMITED
SMALLFILE DEFAULT TEMPORARY TABLESPACE TEMP TEMPFILE '/u01/app/oracle/orada
ta/dev12c/temp01.dbf' SIZE 20M REUSE AUTOEXTEND ON NEXT 640K
MAXSIZE UNLIMITED
SMALLFILE UNDO TABLESPACE "UNDOTBS1" DATAFILE '
/u01/app/oracle/o
radata/dev12c/undotbs01.dbf' SIZE 200M REUSE AUTOEXTEND ON NEXT 5120K
MAXSIZE UNLIMITED
CHARACTER SET WE8MSWIN1252
NATIONAL CHARACTER SET AL16UTF16
LOGFILE GROUP 1 ('/u01/app/oracle/oradata/dev12c/redo01.log') SIZE 50M,
GROUP 2 ('/u01/app/oracle/oradata/dev12c/redo02.log') SIZE 50M,
GROUP 3 ('/u01/app/oracle/oradata/dev12c/redo03.log') SIZE 50M
USER SYS IDENTIFIED BY USER SYSTEM IDENTIFIED BY
</txt>
</msg>
<msg time='2013-07-19T13:22:19.033-04:00' org_id='oracle' comp_id='rdbms'
msg_id='opiexe:3209:4222364190' type='NOTIFICATION' group='admin_ddl'
level='16' host_id='oralinux1' host_addr='192.168.1.66'
module='sqlplus@oralinux1 (TNS V1-V3)' pid='24311'>
<txt>CREATE SMALLFILE TABLESPACE "USERS" LOGGING DATAFILE '/u0
1/app/oracle/oradata/dev12c/users01.dbf' SIZE 5M REUSE AUTOEXTEND ON NEXT
1280K MAXSIZE UNLIMITED EXTENT MANAGEMENT LOCAL SEGMENT SPACE MANAGEMENT AUTO
</txt>
</msg>
This code shows routine messages for a database creation.
A text-formatted version is still available for people using command-line editors like vi or Notepad. It is in the trace subdirectory and has the standard name format alert_SID.log (which is alert_dev12c.log in this example). Without the XML tags, you can easily read it via a command-line utility.
Here’s the same information as the XML file, but without the tags:
Fri Jul 19 13:21:21 2013
CREATE DATABASE "dev12c"
MAXINSTANCES 8
MAXLOGHISTORY 1
MAXLOGFILES 16
MAXLOGMEMBERS 3
MAXDATAFILES 100
DATAFILE '/u01/app/oracle/oradata/dev12c/system01.dbf' SIZE 700M REUSE AUTOEXTEND ON NEXT 10240K MAXSIZE UNLIMITED
EXTENT MANAGEMENT LOCAL
SYSAUX DATAFILE '/u01/app/oracle/oradata/dev12c/sysaux01.dbf' SIZE 550M REUSE AUTOEXTEND ON NEXT 10240K MAXSIZE UNLIMITED
SMALLFILE DEFAULT TEMPORARY TABLESPACE TEMP TEMPFILE '/u01/app/oracle/oradata/dev12c/temp01.dbf' SIZE 20M REUSE AUTOEXTEND ON NEXT 640K MAXSIZE UNLIMITED
SMALLFILE UNDO TABLESPACE "UNDOTBS1" DATAFILE '/u01/app/oracle/oradata/dev12c/undotbs01.dbf' SIZE 200M REUSE AUTOEXTEND ON NEXT 5120K MAXSIZE UNLIMITED
CHARACTER SET WE8MSWIN1252
NATIONAL CHARACTER SET AL16UTF16
LOGFILE GROUP 1 ('/u01/app/oracle/oradata/dev12c/redo01.log') SIZE 50M,
GROUP 2 ('/u01/app/oracle/oradata/dev12c/redo02.log') SIZE 50M,
GROUP 3 ('/u01/app/oracle/oradata/dev12c/redo03.log') SIZE 50M
USER SYS IDENTIFIED BY USER SYSTEM IDENTIFIED BY
Database mounted in Exclusive Mode
Lost write protection disabled
Ping without log force is disabled.
Using default pga_aggregate_limit of 2560 MB
Fri Jul 19 13:21:28 2013
db_recovery_file_dest_size of 4815 MB is 0.00% used. This is a
user-specified limit on the amount of space that will be used by this
database for recovery-related files, and does not reflect the amount of
space available in the underlying filesystem or ASM diskgroup.
Successful mount of redo thread 1, with mount id 3622234653
Using SCN growth rate of 16384 per second
Assigning activation ID 3622234653 (0xd7e6ea1d)
Starting background process TMON
Fri Jul 19 13:21:28 2013
TMON started with pid=24, OS id=24298
Thread 1 opened at log sequence 1
Current log# 1 seq# 1 mem# 0: /u01/app/oracle/oradata/dev12c/redo01.log
Successful open of redo thread 1
Here’s what an Oracle error looks like from a trace file:
*** KEWROCISTMTEXEC - encountered error: (ORA-06525: Length Mismatch for CHAR or RAW data
ORA-06512: at "SYS.DBMS_STATS", line 40111
Review and manage the alert log regularly so you can catch small issues before they grow into large problems.
Trace and dump files
When a problem event occurs (such as a failed process or failed memory allocation), log files for that event are written into the trace directory.
The format for the log filename is SID_process name_process ID.trc:
$ ls $ORACLE_BASE/diag/rdbms/dev12c/dev12c/trace
alert_dev12c.log dev12c_m000_23037.trc dev12c_ora_6593.trm
dev12c_aqpc_24310.trc dev12c_m000_23037.trm dev12c_ora_760.trc
Here are the contents of a trace file:
Trace file /u01/app/oracle/diag/rdbms/dev12c/dev12c/trace/dev12c_dbw0_24263.trc
Oracle Database 12c Enterprise Edition Release 12.1.0.1.0 - 64bit Production
With the Partitioning, OLAP, Advanced Analytics and Real Application Testing opt
ions
ORACLE_HOME = /u01/app/oracle/product/12.1.0
System name: Linux
Node name: oralinux1
Release: 2.6.39-400.17.2.el6uek.x86_64
Version: #1 SMP Wed Mar 13 12:31:05 PDT 2013
Machine: x86_64
Instance name: dev12c
Redo thread mounted by this instance: 0 <none>
Oracle process number: 11
Unix process pid: 24263, image: oracle@oralinux1 (DBW0)
*** 2013-07-19 13:21:21.458
*** CLIENT ID:() 2013-07-19 13:21:21.458
*** SERVICE NAME:() 2013-07-19 13:21:21.458
*** MODULE NAME:() 2013-07-19 13:21:21.458
*** ACTION NAME:() 2013-07-19 13:21:21.458
2013-07-19 13:21:21.458540 :kjcipctxinit(): (pid|psn)=(11|1): initialised and
linked pctx 0x125d93038 into process list
The difference between a dump and a trace file: A trace is an ongoing log of a problem event. The dump is the one-time dumping of information into a file for a problem event. As a DBA, you should review these text files to diagnose what is occurring.
If a process crashes, a core dump can be created in the cdump directory. This is a binary trace file of the memory process and its contents at the time of the crash. Although many people consider these to be “hands-off” for a DBA to review, that isn’t necessarily the case. The Linux and UNIX strings command can show the printable text of a binary file. If you opt to upload the core file to any support organization, you may want to review it first for username and password combinations because they are sometimes present in clear text in these files.
Listener log
You may have to track connections into the database via the listener. Every time a connection to the database occurs, that event (or failure) is stored in the listener log. Chapter 5 goes into greater detail about the database listener architecture.
Knowing where listener logs are generated is important to troubleshooting. You can find the listener log under the ADR_BASE/diag/tnslsnr directory tree. (In this example, it’s /u01/app/oracle/diag/tnslsnr/oralinux1/listener/trace/listener.log.)
Here’s a sample log entry:
02-AUG-2013 17:38:48 * (CONNECT_DATA=(SERVICE_NAME=dev12c)
(CID=(PROGRAM=sqlplus)(HOST=oralinux1)(USER=oracle))) *
(ADDRESS=(PROTOCOL=tcp)(HOST=192.168.2.121)(PORT=21165))
* establish * dev12c * 0
Key information is the time, host, and program for the incoming connections.
Here’s a Dell TOAD software utility user connecting, most likely from a user’s workstation:
02-AUG-2013 11:57:45 * (CONNECT_DATA=(SERVICE_NAME=192.168.2.121)
(CID=(PROGRAM=C:Program?FilesQuest?SoftwareTOADTOAD.exe)
(HOST=LPT-MPYLE)(USER=mpyle))) * (ADDRESS=(PROTOCOL=tcp)
(HOST=192.168.2.170) (PORT=3108))
* establish * 192.168.2.121 * 12514
Finally, an error is occurring:
TNS-12514: TNS:listener does not currently know of service
requested in connect descriptor
You can search for the Transport Network Substrate (TNS) error code in the listener log to see what errors are occurring. This search is useful because there will (hopefully) be far more connections than errors and, like the alert logs, the listener log can grow large.
Benefiting from Other Diagnostic Utilities
As a DBA, you should be grounded in the fundamentals of how your database works and where files are located.
Sometimes you’ll have only a command-line interface into your database server and have to manually review log files. However, you also should know several easier, faster methods:
![]() Oracle Enterprise Manager and Database Express 12c
Oracle Enterprise Manager and Database Express 12c
![]() Remote Diagnostic Assistant (RDA)
Remote Diagnostic Assistant (RDA)
![]() Database diagnostic scripts
Database diagnostic scripts
Oracle Enterprise Manager and Database Express 12c
Graphical tools, such as Oracle Enterprise Manager and Database Express 12c, let you review alert messages and view incidents. These easy methods of checking for critical errors let you avoid manually sifting through text files. Depending on the graphical tools used, you can upload files to Oracle Support in the form of a Service Request (SR). Some versions of Oracle GUI software also combine log files in a central location for easier viewing and management.
The capabilities of each GUI tool and the location of each utility change from release to release. Although these changes are a little frustrating at first, Enterprise Manager and Database Express 12c are very intuitive, so you can find what you need very quickly. For detailed information on these tools, see Chapter 13.
Remote Diagnostic Agent
Oracle Remote Diagnostic Agent (RDA) is an Oracle Support utility that captures Oracle-related information on an entire server and stores the results in a series of HTML files. RDA can be integrated with Oracle Configuration Manager (OCM) and can query a myriad of Oracle components outside the database, such as Oracle WebLogic or Enterprise Manager, in addition to your database. The utility asks you a series of simple questions about your environment and what components you want to investigate. Don’t worry if you don’t know the answer to a question; you can accept the provided default answer.
The intent is to capture data about the operating system, hardware, Oracle software versions, database instances, listeners, and activities within the database environment in an automated manner. You can view that information as a series of static HTML pages to get fast graphical access to all Oracle-related information for a given server.
Not only is graphical information useful to DBAs, but when you provide an RDA to Oracle Support it gives an accurate picture of your database environment. In fact, one of the first things many Oracle Support analysts request is an RDA of your server.
Oracle RDA comes as a tar or zip file available for download via the My Oracle Support network. When downloaded, it executes on the server as either a Perl or shell script. The output is a zip file that you can
![]() Upload to Oracle Support as part of a Service Request
Upload to Oracle Support as part of a Service Request
![]() Unzip into a series of HTML files that you can navigate to find key information
Unzip into a series of HTML files that you can navigate to find key information
In Figure 12-4, you see the main index page of the RDA output where you can drill down into multiple useful areas.
RDAs are a great way to get a quick snapshot of a system even when there are no problems (per se). For example, if you are consulting and need a quick overview of a client’s system, the RDA is very handy. Or if you’re taking over an existing database server, the RDA tells you exactly what’s on that server and how it’s configured.
Figure 12-4: The RDA initial RDA_Start page.
Database diagnostic scripts
Most old-school DBAs from the Oracle 7 days lived and died by their toolbox of database scripts — and for good reason. Database scripts based on internal database views and tables provided the raw information for what was going on in a database. That raw data, coupled with a real understanding of how the database and application worked, often made for a very skilled administrator who could solve most problems. Toward that end, entire books are dedicated to database scripts, and many websites make scripts available for download.
Oracle provides a set of database scripts in every $ORACLE_HOME/rdbms/admin directory. In it are core scripts necessary to create a database, build the data dictionary, and other maintenance operations that aren’t very useful for troubleshooting.
However, the $ORACLE_HOME/rdbms/admin directory also has useful scripts such as utllockt.sql and utlrp.sql. Use them to search for database locks and compile invalid database objects. We encourage you to become familiar with the scripts in this directory and identify the ones that fit into your toolbox.
Many good third-party scripts exist both from books and Internet downloads. We can’t validate everything out there, so use your own best judgment and don’t run anything you don’t understand or trust. However, some good scripts are available, so don’t be afraid to seek out good sources and test them first on your development database.
And if all else fails, write your own. Here’s one of our favorites we’ve used many times to see what’s happening on a database and who is doing it:
SQL>get show_session_short.sql
1 set linesize 180
2 set pagesize 20
3 col "Logon Time" format a11
4 col "UNIX Proc" format a9
5 col username format a15
6 col osuser format a13
7 col "Program Running" format a20
8 col sid format 9999
9 col "Connect Type" format a12
10 col serial# format 9999999
11 select s.username, osuser, status,
12 to_char(logon_time,'fmHH:MI:SS AM') as "Logon Time",
13 sid, s.serial#, p.spid as "UNIX Proc"
14 from v$session s, v$process p
15 where s.paddr = p.addr
16 and s.username is not null
17* order by status, s.username, logon_time
SQL>@show_session_short
USERNAME OSUSER STATUS Logon Time SID SERIAL# UNIX Proc
--------------- ------------- -------- ----------- ----- -------- ---------
SYSTEM oracle ACTIVE 11:39:11 PM 125 12 29062
SYS oracle ACTIVE 12:18:25 AM 119 829 31376
MWESSLER oracle ACTIVE 11:40:39 PM 124 54 29264
CRUEL oracle ACTIVE 11:41:19 PM 138 35 29359
MPYLE oracle INACTIVE 11:37:51 PM 135 13 28749
MWESSLER oracle INACTIVE 11:40:26 PM 129 24 29258
DWILSON oracle INACTIVE 11:40:49 PM 155 32 29273
CSARJENT oracle INACTIVE 11:40:59 PM 126 54 29275
DBSNMP oracle INACTIVE 11:41:29 PM 132 19 29357
APEX_WEB oracle INACTIVE 11:41:39 PM 131 55 29355
RMAN oracle INACTIVE 11:41:49 PM 127 323 29361
11 rows selected.
Although the script is useful, the actual point is to show you the power of a simple script and what it can provide quickly.
Despite all the wiz-bang GUI tools and wonderful database advisors, many folks still use database scripts for some, if not all, of their administrative work.
A toolbox of useful scripts coupled with modern Enterprise Manager tools provides DBAs with the best capability to manage their databases.