Chapter 8
Keeping the Database Running
In This Chapter
![]() Performing daily common tasks
Performing daily common tasks
![]() Automating jobs via the Oracle Scheduler
Automating jobs via the Oracle Scheduler
![]() Using Oracle Data Pump
Using Oracle Data Pump
In most instances, managing an Oracle database is a full-time job. That’s why some people have the job title Oracle database administrator (DBA). A DBA must keep on top of a plethora of activities to make sure the database runs smoothly and doesn’t let people down when they most need it.
The 12c Oracle database needs less attention in areas that were traditionally very hands-on. However, each release has new features that require the coddling and care that more mature features do not require. Besides basic care and feeding, you might be asked to do some things on a regular basis: for example, loading data or scheduling jobs.
In this chapter, we investigate some of the daily maintenance tasks you will find yourself doing, how to use the Oracle Scheduler, and how to load and unload data by using Oracle Data Pump.
Doing Your Database Chores
The following sections identify some of the common activities you as DBA might perform. All databases are different. Each DBA has unique tasks and common management responsibilities. You might discover that not all the common tasks in these sections apply to you. However, we think most of them do.
On the other hand, you might do something every day that’s unique to your environment (and maybe everyone else’s too). We can’t possibly cover such unique tasks. Still, this chapter’s guidelines get you started on the road toward a well-maintained, reliable database.
Making way, checking space
A lot of areas in the database require you to check on space for growth and shrinkage. Most people need to watch out for growth. In our experience, most databases grow, not shrink, over time. With the business use of unstructured data (such as image, sound, and movie files) and more online activity than ever, you can expect storage requirements to increase.
Some environments are severely restricted regarding how much space is available. If that’s the case for you, identify database resources that allow you to reclaim valuable space. Also, avoiding extraneous, empty blocks of storage in the database helps performance.
Chapter 7 explains that when you create a brand-new tablespace, you choose a file for that tablespace to store its data. A tablespace is just a logical pointer to a file or files on the operating system. The file is the physical component of storage in Oracle. Everything is ultimately stored in a file.
Say you create a tablespace called MY_DATA by typing
<create tablespace my_data
datafile '/u01/app/oracle/oradata/dev12c/my_data01.dbf'
size 10M;>
When this tablespace is created, Oracle allocates 10MB of space from the operating system. The OS sees this space as used. However, if you look in the database, this space is free. Essentially, the space disappears from the OS and appears in the database.
 Again, when you create a tablespace, the system administrator sees that the space on the system has shrunk; to the DBA, the database has grown. (We’re beating this to death because this distinction is important.)
Imagine that you have 100GB of space available on the OS, and you create a 99GB tablespace. Someone looking on the OS side would start sounding alarms: New space must be purchased! But the DBA can calm any fears by saying, “Don’t worry. That 99GB is still free, but Oracle owns it now. The OS can’t see it.” DBAs do this because it is bad for tables and indexes to run out of space, so DBAs err on the side of having too much space.
Before you jump into adding space, how much space is actually unused in your database? Too often people add space to a system that has plenty of free space available.
 You can monitor available real estate in a tablespace a couple of ways:
![]() Use the Enterprise Manager Database Express (EM Express) web-based management tool.
Use the Enterprise Manager Database Express (EM Express) web-based management tool.
![]() Query the data dictionary.
Query the data dictionary.
Although we recommend the EM Express tool, we show you both ways so you have a better understanding of how this process works.
Enterprise Manager Database Express
The EM Express web-based management tool provides an easy way to check space.
1. Log in to EM Express as a DBA user, such as SYSTEM.
The URL is typically https://yourservername.com:5500/em.
2. Click the Storage tab.
3. Click the Tablespaces link in the Storage section.
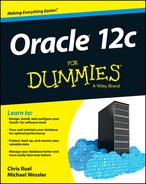
A screen similar to Figure 8-1 appears.
A lot of information is available in this window:
![]() Name: By row, which tablespace contains information/data.
Name: By row, which tablespace contains information/data.
![]() Size: The amount of space that the tablespace has access to on the file system. It doesn’t mean that much space is unused. It’s the total amount of used and free space in megabytes (MB).
Size: The amount of space that the tablespace has access to on the file system. It doesn’t mean that much space is unused. It’s the total amount of used and free space in megabytes (MB).
![]() Free Space: The amount of space, in megabytes, you’ve used creating objects and inserting/loading data.
Free Space: The amount of space, in megabytes, you’ve used creating objects and inserting/loading data.
Figure 8-1: Tablespace usage screen in EM Express looks like this.
![]() Used (%): A graphical representation of how much space is used. Nice for reports and showing to people who prefer pictures.
Used (%): A graphical representation of how much space is used. Nice for reports and showing to people who prefer pictures.
![]() Auto Extend: Setting to allow space to be added automatically as needed.
Auto Extend: Setting to allow space to be added automatically as needed.
![]() Maximum Size: The maximum size the tablespace can grow.
Maximum Size: The maximum size the tablespace can grow.
![]() Status: A graphical representation of whether the tablespace is online or offline.
Status: A graphical representation of whether the tablespace is online or offline.
![]() Type: A graphical representation of the tablespace type; either permanent, undo, or temporary.
Type: A graphical representation of the tablespace type; either permanent, undo, or temporary.
![]() Group Name: Storage group if assigned; often, this is null.
Group Name: Storage group if assigned; often, this is null.
![]() Auto Storage Management: Indicator of whether automatic storage management is enabled for a tablespace.
Auto Storage Management: Indicator of whether automatic storage management is enabled for a tablespace.
![]() Directory: The directory where the data files for the corresponding tablespace are located.
Directory: The directory where the data files for the corresponding tablespace are located.
To see the data file(s) and their size allocation, click the plus sign (+) under each tablespace name to expose this valuable information.
SQL
If EM Express isn’t available in your environment, a couple of SQL queries can get you the same information.
1. Log in to SQL*Plus.
2. Type the following code:
< select tablespace_name, bytes
from dba_data_files;>
With this code you get the tablespace name, its associated data files, and their sizes. You see something like this:
TABLESPACE_NAME BYTES
--------------- --------------
UNDOTBS1 267,386,880
SYSAUX 1,200,553,984
USERS 101,777,408
SYSTEM 891,289,600
MY_DATA 10,485,760
The query sums the bytes and groups by tablespace_name in case the tablespaces have more than one data file.
3. To get the free space available, type
< select tablespace_name, sum(bytes) bytes
from dba_free_space
group by tablespace_name;>
You see something like this:
TABLESPACE_NAME BYTES
--------------- --------------
SYSAUX 264,503,296
UNDOTBS1 255,524,864
USERS 33,226,752
SYSTEM 6,422,528
MY_DATA 10,420,224
This information tells you how much available space remains in your tablespaces that you can use for creating objects and loading data.
4. Take those numbers and calculate your percentages.
If you’re clever with SQL, you can do it all in one query. EM Express makes your work very easy here.
We’d love to say managing available space as simple as that. Alas, more goes into space management whether you use EM Express or SQL. You see, the preceding steps give you a rough estimate of the space you have available. It’s a pretty good estimate, but it’s not exact. Will it get you through the night knowing you have enough space for batch jobs to run? Yes, probably.
 Beware the false numbers caused by the following situations:
![]() When you create a tablespace, the OS considers the disk space allocated, even though within the database that space may not yet contain any objects. (Similarly, misrepresentations can happen within the database, where you can allocate extents, but the space doesn’t contain any objects.)
When you create a tablespace, the OS considers the disk space allocated, even though within the database that space may not yet contain any objects. (Similarly, misrepresentations can happen within the database, where you can allocate extents, but the space doesn’t contain any objects.)
For example, when you create a table, by default it creates an extent that is 64k. That 64k is reserved for rows, so it no longer shows up in your free space allocation table. What if you took a 10MB tablespace and created 150 new tables with 64k initial extents? No data, just empty tables. Your free space view would tell you that only 0.1MB of that 10MB is left, yet you haven’t put any data into the table
![]() Autoextensible data files (described in Chapter 7). A data file might say it’s 10MB, but if it reaches that, it automatically grows up to the maximum size specified in the autoextend clause.
Autoextensible data files (described in Chapter 7). A data file might say it’s 10MB, but if it reaches that, it automatically grows up to the maximum size specified in the autoextend clause.
For a query that shows your tablespace sizes more accurately, type the following:
< select tablespace_name, file_name, bytes, autoextensible, maxbytes
from dba_data_files;>
You see something like this:
TABLESPACE_NAME BYTES AUT MAXBYTES
--------------- -------------- --- ---------------
USERS 101,777,408 YES 3.460E+10
UNDOTBS1 267,386,880 YES 3.460E+10
SYSAUX 1,200,553,984 YES 3.460E+10
SYSTEM 891,289,600 YES 3.460E+10
MY_DATA 10,485,760 NO 0
In this example, the AUT column stands for autoextensible. If the AUT column shows YES, the MAXBYTES column tells you how big the data file can automatically grow. This detail is important when you're deciding whether to add space.
Monitoring space in your segments
Segments are objects that take up space in the database. Segments are objects that, when created, allocated one or more extents from the free space in your tablespaces. The two most common database segments are
![]() Tables
Tables
![]() Indexes
Indexes
Tables are what hold data, and indexes are access pointers to data elements within a table. Management of space for tables and indexes are very similar, so we focus on table management; however, the same concepts and techniques apply for index space management.
Before putting any data in a table, Oracle goes to the tablespace where it lives and allocates an extent. You can call this a used extent because it belongs to an object. The remaining space in the tablespace is free extents you can use when objects grow or new objects are created.
As you start putting data into that table, the extent that was allocated upon creation begins to fill up. When the extent reaches capacity, the table goes out to the tablespace and grabs another extent. This cycle continues until either you stop adding data or the tablespace runs out of free space. If the tablespace runs out of free space, the process requesting the space generates an error message and either fails or temporarily suspends until space is added.
To get a better idea of how objects grow, consider these guidelines:
![]() When you first create an object, the default extent size is 64k.
When you first create an object, the default extent size is 64k.
![]() The object continues to grow on 64k extents until it has 16 extents.
The object continues to grow on 64k extents until it has 16 extents.
![]() The 17th extent is 1MB.
The 17th extent is 1MB.
![]() The object continues to grow in 1MB extents for the next 63 extents (a total of 64, including the first 1MB extent).
The object continues to grow in 1MB extents for the next 63 extents (a total of 64, including the first 1MB extent).
![]() The 81st extent is 8MB.
The 81st extent is 8MB.
![]() After 8MB extents, the last size Oracle uses is 64MB extents.
After 8MB extents, the last size Oracle uses is 64MB extents.
Knowing how your segments grow can help you predict space requirements. This skill is important to have when monitoring storage.
If you constantly insert data into your table, you’ve got it covered. However, that isn’t always the case. Some tables grow and shrink. To be specific, they grow, but the shrinking, if necessary, is up to you.
Understanding how the objects in your application are used comes in handy. Consider these examples:
![]() What tables grow?
What tables grow?
![]() What tables, if any, shrink over time?
What tables, if any, shrink over time?
![]() What tables receive inserts and are never added to again except for reads?
What tables receive inserts and are never added to again except for reads?
![]() What tables are under constant manipulation (INSERT, UPDATE, DELETE)?
What tables are under constant manipulation (INSERT, UPDATE, DELETE)?
Tables that stay the same are easy. You don’t have to worry much about those tables unless you want to tune them for performance. We cover how to monitor a table’s growth (in the earlier section “Making way, checking space”), so any tables that grow without getting any rows deleted are covered . . . unless, again, you want to tune them for performance (but that’s another topic).
Growing and shrinking tables
A table that fits this category might be loaded every night and then deleted from throughout the day, like a batch processing table. For example, consider an ORDERS table that’s batch loaded at night from all the orders that were taken from a website; as the orders are processed the next day, rows are deleted one by one. At the end of the day, all the rows are gone. What do you need to monitor for this table?
You should be most concerned with how big the table gets each day after the batch load. Businesses want orders to increase. What about the deletes? Should you shrink the table at the end of the day before the next batch load to free up space? Absolutely not. Although it’s small, the growth of an object is overhead on the system processing. By leaving it the same size day to day, you know the space will be constantly reused. It’s kind of like recycling. You mainly want to monitor this type of object for growth.
What about a table that you add to and delete from on a frequent basis? Say for every 1 million rows inserted in a week, 30 percent are deleted. This table can present an interesting challenge.
Take a quick look at how rows are inserted to better understand how objects grow and use space:
![]() You have a new table with one 64k extent.
You have a new table with one 64k extent.
![]() Your block size is 4k, so that extent is 16 blocks.
Your block size is 4k, so that extent is 16 blocks.
![]() You start inserting data; 100 rows fit in a block.
You start inserting data; 100 rows fit in a block.
![]() By default, Oracle fills blocks to 90 percent full and then stops (so you can update the row later and have it grow). For example, some fields are left null until a later date, and then you fill them in. You don’t want the block to get filled too easily by an update; otherwise Oracle has to move the row to a new block that fits it. This rows migration degrades performance.
By default, Oracle fills blocks to 90 percent full and then stops (so you can update the row later and have it grow). For example, some fields are left null until a later date, and then you fill them in. You don’t want the block to get filled too easily by an update; otherwise Oracle has to move the row to a new block that fits it. This rows migration degrades performance.
![]() When all the blocks are filled in the free extents, the table allocates a new extent, and the process starts over.
When all the blocks are filled in the free extents, the table allocates a new extent, and the process starts over.
What if you start deleting rows at the same time you’re inserting? Will Oracle reuse the space where you deleted the row? It depends. Again, Oracle has a built-in feature that sacrifices space in favor of performance. Oracle inserts a row into a block that was once full, but only if the deletions bring the block to 40 percent full.
 Oracle doesn’t want to manage a block that teeters between full, not full, full, not full, and so on. Although Oracle has reduced the performance overhead that comes with managing blocks and which ones you can insert data into, managing block storage still has a cost associated with it. Imagine you have a table with 10,000 blocks and you’re constantly inserting and deleting from that table. Oracle could spend all the CPU cycles managing what blocks can have inserts and which can’t if there were only a one-row difference between full and not-full blocks.
That’s why Oracle uses the 40-percent rule. A block takes all the inserts it can until it’s 90 percent full, but the block can’t get back in line until it’s been reduced to 40 percent full.
Again, what if you insert 1 million rows a week and delete 30 percent of them? What if the 30 percent that you delete are randomly selected and spread evenly across the blocks? Over time, those blocks never get down to 40 percent full. After a year, you may have a table that is 10GB with 3GB of empty row space that won’t be reused.
Shrinking tables
You must determine whether you can release an object’s space after evaluating the object’s usage pattern. Determining whether you can release an object’s space requires a little arithmetic. Before you can decide whether to make room in a table, you need to analyze the table to gather statistics.
When we say analyze, we mean analyze. The ANALYZE command gets the necessary statistics to do this computation; DBMS_STATS doesn’t get those stats.
This example uses the emp table. To analyze the table appropriately, take these steps:
1. Log in to SQL*Plus and type
< analyze table emp compute statistics;>
You see this:
Table analyzed.
2. Run a query against the USER_TABLES view by typing
<select table_name, avg_space, blocks
from user_tables
where table_name = 'EMP'>
You see something like this:
TABLE_NAME AVG_SPACE BLOCKS
------------------------------ ---------- ----------
EMP 3264 4528
The AVG_SPACE column shows the average amount of free space per block.
3. Use the following formula to calculate the amount of empty space in the emp table:
(AVG_SPACE – (DB_BLOCK_SIZE × FREE_SPACE)) × TAB_BLOCKS
For this example, the formula looks like this:
(3623 – (8192 × .10)) × 4528 = 11066432 (approximately 11MB)
4. Decide whether there’s enough space to make it worthwhile to shrink the object.
5. To enable Oracle to move rows around in the table type, issue this SQL command:
<alter table emp enable row movement;>
You see this:
Table altered.
6. Issue this SQL command to do the shrink:
<alter table emp shrink space;>
You see this:
Table altered.
7. Re-analyze the table and re-execute the query to check the statistics.
<select table_name, avg_space, blocks
from user_tables
where table_name = 'EMP'>
You should see something like this:
TABLE_NAME AVG_SPACE BLOCKS
------------------------------ ---------- ----------
EMP 933 2979
As you can see, the AVG_SPACE is about 10 percent of the block size. This is normal for default block space organization.
Check things like the Flash Recovery Area. Any day that produces a lot of archive logs or large backup files can quickly overcome the allocated space. If you don’t have something like Enterprise Manager 12c watching this, you can encounter problems such as a hung database or failing backups. These situations can have dire consequences on your database system.
Checking users
Knowing what is going on within the database is part of your job as a DBA. You should regularly log in to your database to understand who is using it, what normal usage looks like, and whether anything unusual is occurring. Developing a baseline understanding of your database usage greatly helps you in your other DBA responsibilities.
If you check on your users on a regular basis, you’ll be able to recognize the most active users. You can also find the following issues:
![]() Stale and abnormally long sessions
Stale and abnormally long sessions
![]() Login abuse, such as people sharing accounts and unauthorized logins
Login abuse, such as people sharing accounts and unauthorized logins
Finding stale sessions
Stale sessions have been logged in to the system for a long time, and no one has done anything with them. Getting rid of stale sessions can help control resource usage.
Everyone’s system is different, so you have to rely on some of your knowledge to decide whether the absence of activity is abnormal. To get a list of logged-in users and the last time they issued a command, connect to the database as a DBA user and type the following:
<select sid, serial#, username, last_call_et
from v$session
where username is not null;>
You might see something like this:
SID SERIAL# USERNAME LAST_CALL_ET
--- ------- ---------------- ------------
12 9853 SYSMAN 3
14 6552 HR 0
56 42 DBSNMP 6
112 59271 SYSTEM 160
65 23451 MPYLE 743160
98 8752 CRM 1
32 4551 CRM 3
45 16554 HR 36
119 9812 KHANR 36522
MPYLE and KHANR are the two potentially bothersome accounts in this example. The LAST_CALL_ET column output data has the number of seconds since there was any activity. MPYLE has been inactive for over eight days! KHANR is a little less alarming at about 10 hours, but nonetheless, that would most likely require some explanation.
Note that the command uses the WHERE clause USERNAME IS NOT NULL. Oracle internal processes show up in this list as unnamed users, and you don’t want those getting in the way of evaluation. Also, this example includes identification columns SID and SERIAL#. Together, these two columns uniquely identify a session within the database.
If you see a session you want to get rid of, type the following:
<alter system kill session '65,23451';>
You should see this:
System altered.
Releasing the bug
We had a client system that had over 3,000 connected sessions regularly. While evaluating the sessions, we discovered that 1,200 sessions had never issued a single command after logging in and setting a date format. It turned out to be an application bug that created multiple sessions for each application operation — one of them a session to set the date format. Of course, it did no good to set a session date format and log in to another session to do the work. Regardless, the client fixed the bug. The fix released nearly 6GB of memory from the OS!
Before you go killing sessions that have long periods of inactivity, check with application folks to determine whether a connection is part of a connection pool that just hasn’t been used for a while. Usually, removal is safe if it isn’t an application ID or if you can identify the user. Do your research!
Policing for login abuse and unauthorized logins
People everywhere are abusing their login privileges, and such abuse is a significant security problem. Unfortunately, it’s usually people higher up in the application chain of command who tend to have more privileges giving out their login ID to subordinates to help with work. In other cases, co-workers decide to share a login ID because an account became locked or someone forgot his or her password.
Track this abuse down by comparing the database login ID with the OS login ID. Oracle tracks both. Type the following to see all the users connected with both IDs:
<select sid, serial#, username, osuser, program
from v$session
where username is not null;>
You might see something like this:
SID SERIAL# USERNAME OSUSER PROGRAM
---------- ---------- ---------- ---------- -----------------
112 3741 MPYLE MPYLE sqlplusw.exe
122 3763 MPYLE RKHAN sqlplusw.exe
115 9853 SYSMAN oracle OMS
122 35878 HR HRAPP sqlplus@classroom
124 4 DBSNMP oracle emagent@classroom
MPYLE has given his login ID to RKHAN (or at least the evidence suggests that). Evaluate this information carefully and do a thorough investigation. Take appropriate measures if there’s been a violation of your security policy.
Checking backups
Checking your backups should be a regular part of your daily routine. Checking backups includes these things:
![]() Ensuring the database backups completed successfully and without errors.
Ensuring the database backups completed successfully and without errors.
From an Oracle DBA’s standpoint, you need to make sure the entire backup process is logged and no errors were detected. A common mistake is for the DBA to setup a database backup, but not monitor the output logs to confirm it was successful.
![]() Following up occasionally with appropriate personal about OS backups.
Following up occasionally with appropriate personal about OS backups.
![]() Checking regularly to ensure the system admin is moving the database backup from disk to tape.
Checking regularly to ensure the system admin is moving the database backup from disk to tape.
Too many environments put system backups on the back burner because they were scheduled jobs; no alerting was in place. If you subscribe to this methodology, you could be signing up for a heap of trouble. Be sure to verify that your backups are running without errors. It would be extremely embarrassing and potentially career-limiting to discover you’ve “lost” a database because, as the DBA, you ignored e-mailed error messages for months.
Keep these backup tips in mind:
![]() Oracle Recovery Manager has a LOG option that you can pass in with your backup script. This option forces RMAN to log the details for every step of the backup as it runs. This shell script example logs the output of your RMAN backup on Linux/UNIX:
Oracle Recovery Manager has a LOG option that you can pass in with your backup script. This option forces RMAN to log the details for every step of the backup as it runs. This shell script example logs the output of your RMAN backup on Linux/UNIX:
#/usr/bin/ksh
# Environment Settings
export ORACLE_BASE=/u01/app/oracle
export ORACLE_HOME=$ORACLE_BASE/product/12.1.0
export ORACLE_SID=dev12c
export BAK_DATE=`date '+%d%b%Y_%H_%M'`
export PATH=$ORACLE_HOME/bin:$PATH
# Run Backup
rman target / cmdfile=full_hot_backup.rmn
log=full_hot_backup_${ORACLE_SID}_${BAK_DATE}.log
# Check Error Code
Export ECODE=$?
if [ $ECODE -gt 0 ]; then
mailx –s "RMAN BACKUP FAILED!" [email protected]
else echo "RMAN BACKUP SUCCESSFUL"
fi
The simple script, which you might schedule in cron, runs a backup script of your choice (called full_hot_backup.rmn) and logs the output to a file with the database name and date attached.
After the backup completes, the script checks whether RMAN exited cleanly. It does this by checking a mechanism called an error code. Well-written programs have this mechanism. If the environment variable $? has a value of non-zero, something failed.
I have an if-then section that sends an e-mail if that backup failed. Of course, if there’s a failure, you have to find out why and fix it. Either way, implementing a notification similar to the example helps you tighten your backup and recovery planning.
![]() Make sure the backup is usable. This task is important for all backups but is especially important if you store any backups to tape. Make sure those backups can be restored from tape and then actively recovered to a database. For obvious reasons, you don’t necessarily have to do this with your production database. You can do the restore to a different database. A common DBA task is to refresh test database images with production backup copies; this process is a good way to test your production backups. Either way, as reliable as you would like to think tapes can be, you need to test them. What if one of the tape’s heads is going bad and writing corrupt blocks? Silent corruption of backups is a rare but serious problem encountered by DBAs. Testing your backups helps you to practice your recovery strategies and validate your overall backup and recovery posture.
Make sure the backup is usable. This task is important for all backups but is especially important if you store any backups to tape. Make sure those backups can be restored from tape and then actively recovered to a database. For obvious reasons, you don’t necessarily have to do this with your production database. You can do the restore to a different database. A common DBA task is to refresh test database images with production backup copies; this process is a good way to test your production backups. Either way, as reliable as you would like to think tapes can be, you need to test them. What if one of the tape’s heads is going bad and writing corrupt blocks? Silent corruption of backups is a rare but serious problem encountered by DBAs. Testing your backups helps you to practice your recovery strategies and validate your overall backup and recovery posture.
![]() At the very least, date and save this backup log in a directory on the system. If you want to go one step further, have it e-mailed to you every day when the backup completes. If you need to use a backup from a specific date, saving the log files for those backups helps you confirm the backup is valid.
At the very least, date and save this backup log in a directory on the system. If you want to go one step further, have it e-mailed to you every day when the backup completes. If you need to use a backup from a specific date, saving the log files for those backups helps you confirm the backup is valid.
![]() Look at the backup log for errors. Imagine how you’d feel if you experienced a failure and had to tell your boss that you can’t recover because the backup’s been failing for six months. It’s surprising how often we run into situations like this while helping clients with their backup and recovery strategies.
Look at the backup log for errors. Imagine how you’d feel if you experienced a failure and had to tell your boss that you can’t recover because the backup’s been failing for six months. It’s surprising how often we run into situations like this while helping clients with their backup and recovery strategies.
Checking batch jobs
Almost all companies we have worked for have some sort of nightly batch jobs that run against the database. They range from loading data to generating reports to some sort of data processing. They might be scheduled by you or someone else. Either way, we find it common that the DBA is the one responsible for monitoring them and ensuring their success. If you think about it, they’re on your turf because you’re in charge of the database.
Whether you or someone else developed the scripts, the scripts, like RMAN, should have some sort of logging and notification system in place. Such a system makes it easier for you to identify a problem when it occurs. By having status e-mails generated and sent out, you’re all but forced to keep up with the results. If your e-mail program allows filtering, you can send the notifications to separate folders for each batch job. Just remember to check them. Again, we’re trying to help you cover all the bases that an Oracle DBA might commonly have on his or her plate.
Reviewing audit logs
What’s the use of auditing in the database if you aren’t doing anything with the information? You should develop some ideas on what types of information you’re looking for. Additionally, regularly back up and purge the audit logs (whether they’re in the database or the OS). This way, they aren’t taking up space and they are easier to search when looking for potential problems.
Many companies are required to comply with various auditing and compliance laws, policies, and guidelines. These requirements specify what activities are logged, how often the logs are reviewed and by whom, and how long the logs are retained. Be sure you’re aware of the requirements for your company and can prove to an auditor that you’re in compliance.
Maintaining logs
Oracle generates all kinds of logs for various components. Depending on what features you enabled in the database, there may be more or fewer. Some logs (alert and listener, for example) should be regularly:
![]() Checked to identify errors
Checked to identify errors
![]() Renamed with a timestamp added
Renamed with a timestamp added
![]() Trimmed down in size so they do not grow excessively large
Trimmed down in size so they do not grow excessively large
![]() Backed up so they can be reviewed later if necessary
Backed up so they can be reviewed later if necessary
If certain logs grow too large, they can cause problems in the database where either the database suspends or activity is not logged.
Oracle database logs contain valuable information that frequently helps identify problems. When a problem is encountered, one of the first things a DBA does is review the appropriate database logs for errors and background information. In addition to Oracle’s logs, don’t hesitate to look at items such as Windows Event view or the message logs on Linux/UNIX systems. They also contain valuable information for the operating system and server hardware which support the Oracle database.
Automating Chores with the Oracle Scheduler
With the use of the Oracle Scheduler, you can run almost any type of program with a robust resource-management and scheduling system. The Scheduler is intended to help you create and automatically run many of your administrative tasks managed from within the database. Oracle Scheduler is implemented via the DBMS_SCHEDULER database package and is a replacement for the old DMBS_JOB package.
The Scheduler can run these programs:
![]() PL/SQL stored procedures
PL/SQL stored procedures
![]() PL/SQL anonymous blocks
PL/SQL anonymous blocks
![]() Java stored programs
Java stored programs
![]() Local and remote external programs such as shell scripts and executables
Local and remote external programs such as shell scripts and executables
You can schedule jobs that are
![]() Timed-based: A job can run simply from wall-clock time. It can repeat on a schedule based on hours, days, months, and so on.
Timed-based: A job can run simply from wall-clock time. It can repeat on a schedule based on hours, days, months, and so on.
![]() Event-based: The results of certain conditions or events in the environment can cause a job to run. This trigger is useful when you have to wait for other processes to finish before a job is run.
Event-based: The results of certain conditions or events in the environment can cause a job to run. This trigger is useful when you have to wait for other processes to finish before a job is run.
![]() Dependency-based: You can set up dependency such as success or failure. Depending on the outcome of one job, one or more dependant scenarios can be executed.
Dependency-based: You can set up dependency such as success or failure. Depending on the outcome of one job, one or more dependant scenarios can be executed.
Scheduler objects
The Scheduler can use a number of objects to run jobs. Not all of them are mandatory. These objects specify job parameters, timing, execution windows, and resource limits.
![]() Programs: Programs are the actual code that the Scheduler will run. They identify the execution code, arguments, and job type.
Programs: Programs are the actual code that the Scheduler will run. They identify the execution code, arguments, and job type.
![]() Schedules: The job schedules are just what you think. They contain parameters such as when and how often. A schedule should be created by the DBA and then shared for many jobs.
Schedules: The job schedules are just what you think. They contain parameters such as when and how often. A schedule should be created by the DBA and then shared for many jobs.
![]() Jobs: When a job object is created, it contains the executable and the schedule required to run the job. You can enable the job for it to begin the task based on the parameters. Jobs are categorized as any of the following:
Jobs: When a job object is created, it contains the executable and the schedule required to run the job. You can enable the job for it to begin the task based on the parameters. Jobs are categorized as any of the following:
• Database jobs run out of the database from PL/SQL commands.
• External jobs run off the operating system from external executables.
• Chain (Dependency) jobs run based on status of other jobs.
• Detached jobs run to simply kick off another job in a new process.
• Lightweight are simple jobs that exist only for their immediate execution. They aren’t stored as schema objects. They’re used for quick, low-overhead applications.
![]() Windows: Helps schedule jobs for certain times, which can help control resource usage. When a window becomes active, certain resource directives are enabled that might restrict a job from overwhelming the system.
Windows: Helps schedule jobs for certain times, which can help control resource usage. When a window becomes active, certain resource directives are enabled that might restrict a job from overwhelming the system.
Creating your first Scheduler job
The Oracle Scheduler example in this section creates a simple job that runs a stored PL/SQL procedure. The procedure selects a count of the number of users on the system and inserts that number into a table with a timestamp. It runs every five minutes.
Follow these steps to schedule a job for the first time:
1. Log in to SQL*Plus as the SYS user.
2. Give the intended job creator the ability to create jobs:
<grant create job to hr;>
You should see this:
Grant succeeded.
This example job is created and run by HR.
3. Let HR see the V$SESSION table:
<grant select on v_$session to hr;>
You should see this:
Grant succeeded.
The _ in V_$SESSION isn’t a typo! V$SESSION is a synonym for V_$SESSION. For the grant to work, you have to give the view name.
4. Log in to SQL*Plus as the job creator and make a table to hold the data:
< create table user_count (
number_of_users NUMBER(4),
time_of_day TIMESTAMP
)
TABLESPACE users;>
You see this:
Table created.
5. Create a stored procedure:
< CREATE OR REPLACE PROCEDURE insert_user_count AS
v_user_count NUMBER(4);
BEGIN
SELECT count(*)
INTO v_user_count
FROM v$session
WHERE username IS NOT NULL;
INSERT INTO user_count
VALUES (v_user_count, systimestamp);
commit;
END insert_user_count;
/ >
The stored procedure gathers the number of users and inserts them into the table with a timestamp. You should see this:
Procedure created.
6. Create a program for the job:
< BEGIN
DBMS_SCHEDULER.CREATE_PROGRAM (
program_name => 'PROG_INSERT_USER_COUNT',
program_action => 'INSERT_USER_COUNT',
program_type => 'STORED_PROCEDURE'),
END;
/>
You see this:
PL/SQL procedure successfully completed.
7. Enable the program:
<exec dbms_scheduler.enable('PROG_INSERT_USER_COUNT')>
You see this:
PL/SQL procedure successfully completed.
8. Create a schedule for the job to run:
< BEGIN
DBMS_SCHEDULER.CREATE_SCHEDULE (
schedule_name => 'my_weekend_5min_schedule',
start_date => SYSTIMESTAMP,
repeat_interval => 'FREQ=MINUTELY; INTERVAL=5; BYDAY=SAT,SUN',
end_date => SYSTIMESTAMP + INTERVAL '30' day,
comments => 'Every 5 minutes'),
END;
/>
This example job runs every five minutes. You see this:
PL/SQL procedure successfully completed.
9. Create your job with the program and schedule you defined:
< BEGIN
DBMS_SCHEDULER.CREATE_JOB (
job_name => 'my_user_count_job',
program_name => 'prog_insert_user_count',
schedule_name => 'my_weekend_5min_schedule'),
END;
/>
You see this:
PL/SQL procedure successfully completed.
10. Enable your job so it runs within the defined schedule:
< exec dbms_scheduler.enable('my_user_count_job')>
You see this:
PL/SQL procedure successfully completed.
The job runs at the specified start time (at SYSTIMESTAMP). If you choose a calendar date in the future, it doesn’t start until then.
11. After the job’s been running for 17 minutes, type the following to see your USER_COUNT table:
< select *
from user_count;>
You see this:
NUMBER_OF_USERS TIME_OF_DAY
--------------- ---------------------------------
14 09-AUG-13 02.15.14.118495 PM
14 09-AUG-13 02.00.14.137300 PM
13 09-AUG-13 02.05.14.120116 PM
13 09-AUG-13 02.10.14.120680 PM
When you have the job running, you can get details about the success or failure by querying the following views:
USER_SCHEDULER_JOB_RUN_DETAILS
USER_SCHEDULER_JOB_LOG
These views show information only about your jobs. To get information on the recent runs of our job, log in as the job creator and type
< select job_name, status, run_duration, cpu_used
from USER_SCHEDULER_JOB_RUN_DETAILS
where job_name = 'MY_USER_COUNT_JOB';>
You see this:
JOB_NAME STATUS RUN_DURATION CPU_USED
-------------------- ---------- --------------- ------------------
MY_USER_COUNT_JOB SUCCEEDED +000 00:00:00 +000 00:00:00.01
MY_USER_COUNT_JOB SUCCEEDED +000 00:00:00 +000 00:00:00.01
MY_USER_COUNT_JOB SUCCEEDED +000 00:00:00 +000 00:00:00.00
MY_USER_COUNT_JOB SUCCEEDED +000 00:00:00 +000 00:00:00.01
Disabling a job
You can disable a job after it’s completed. That way, if necessary, you can easily re-enable it later. To disable your job, type the following:
<exec dbms_scheduler.disable('my_user_count_job')>
You should see this:
PL/SQL procedure successfully completed.
Removing the job
If your job is no longer needed, you can remove just the job and leave the program out there, or you can remove both. Same goes for the schedule you created.
If you no longer need this particular job, you can remove it by typing
<exec dbms_scheduler.drop_job('my_user_count_job')>
You should see this:
PL/SQL procedure successfully completed.
If you no longer need your program, you can remove it by typing
<exec dbms_scheduler.drop_program('prog_insert_user_count')>
You should see this:
PL/SQL procedure successfully completed.
If you no longer need a particular schedule, remove it by typing
<exec dbms_scheduler.drop_schedule('my_weekend_5min_schedule')>
You should see this:
PL/SQL procedure successfully completed.
The job schedule you created can be used for multiple jobs; be careful when removing your schedule to ensure you aren’t impacting more than what you expect.
Using Oracle Data Pump
Oracle Data Pump is one tool we use constantly to move data within databases and between databases.
Data Pump is modeled after Oracle’s Export/Import tools that were available prior to Oracle 10g. Export/Import is still available, but Data Pump has taken the tasks traditionally done by Export/Import and added a lot more options and flexibility.
Data Pump is useful for
![]() Moving data from one schema to another
Moving data from one schema to another
![]() Moving data from one version of Oracle to another
Moving data from one version of Oracle to another
![]() Moving data from one OS to another
Moving data from one OS to another
![]() Creating logical backups
Creating logical backups
You can use Data Pump to transport an entire database from one instance to another. This capability includes new Oracle 12c pluggable databases as well as older nonpluggable databases. You can use this to move a database to a new server environment or to upgrade to a higher database version.
Like the older Export/Import utilities, you must run Data Pump from the command line. That makes it easy to script and schedule automated jobs. Data Pump is controlled by a series of parameters and files.
You should be familiar with these files:
![]() Dump file: This file is created during a Data Pump Export. It’s the import file when you do a Data Pump Import. It’s binary so you can’t open it to see anything useful.
Dump file: This file is created during a Data Pump Export. It’s the import file when you do a Data Pump Import. It’s binary so you can’t open it to see anything useful.
![]() Parfile: This optional file lists the parameters that control the Data Pump Import or Export. You create this text-based file yourself.
Parfile: This optional file lists the parameters that control the Data Pump Import or Export. You create this text-based file yourself.
![]() Log file: This output is for all Data Pump Import and Export jobs unless you specify otherwise. You can name it yourself or let it have a default name. It’s useful for getting jobs statistics and for troubleshooting.
Log file: This output is for all Data Pump Import and Export jobs unless you specify otherwise. You can name it yourself or let it have a default name. It’s useful for getting jobs statistics and for troubleshooting.
You can interactively do these things with Data Pump jobs:
![]() Start
Start
![]() Stop
Stop
![]() Pause
Pause
![]() Restart
Restart
![]() Kill
Kill
The result is that you can start a job from the command line, detach from it to do something else (while it’s still running), and re-attach later to check progress or make changes. When a Data Pump job runs into a problem, it automatically suspends itself; that way you have a chance to fix the problem before the job fails altogether. This can be a real time-saver. Prior to Data Pump, if an Export/Import job ran into a problem, it would fail immediately, sometimes wasting hours of time.
In our experience, Data Pump Export is significantly faster than traditional exports on large jobs. If you have a small job, like one or two small tables or a small schema, it doesn’t really seem to make a difference. But on large jobs, the difference is phenomenal.
In one example, a job took around 12 hours to dump out about 200GB with the old Export tool. When we upgraded from 9i to 11g and converted to Data Pump, it took only 45 minutes. Part of the reason is that Data Pump can be easily parallelized. Parallelizing Data Pump means starting multiple processes that run simultaneously to split up the job. The only way to parallelize traditional exports is to manually split the workload into multiple jobs. That manual splitting was tedious and time-consuming.
Data Pump Export
The command-line program expdb launches Data Pump Export. All Data Pump Export jobs are estimated at the beginning so you see the estimate before it runs the actual export. Remember that estimates may not always be completely accurate.
From the OS command line, launch Data Pump Export and have it show a list of the parameter:
<expdp help=y>
You see something like this:
Export: Release 12.1.0.1.0 - Production on Sat Jul 20 06:56:47 2013
Copyright (c) 1982, 2013, Oracle and/or its affiliates. All rights reserved.
The Data Pump export utility provides a mechanism for transferring data objects
between Oracle databases. The utility is invoked with the following command:
Example: expdp scott/tiger DIRECTORY=dmpdir DUMPFILE=scott.dmp
You can control how Export runs by entering the 'expdp' command followed
by various parameters. To specify parameters, you use keywords:
Format: expdp KEYWORD=value or KEYWORD=(value1,value2,...,valueN)
Example: expdp scott/tiger DUMPFILE=scott.dmp DIRECTORY=dmpdir SCHEMAS=scott
or TABLES=(T1:P1,T1:P2), if T1 is partitioned table
...output snipped...
You can see that Data Pump lists all the parameters you have to choose from and gives a brief explanation of each.
You can specify parameters at two locations:
![]() On the command line
On the command line
![]() In a parameter file
In a parameter file
Go over some of the more useful parameters in detail:
![]() COMPRESSION: This parameter allows you to compress the output of Data Pump while the job is running. This trick is handy when space is at a premium. This parameter degrades the performance of the export, but that’s to be expected.
COMPRESSION: This parameter allows you to compress the output of Data Pump while the job is running. This trick is handy when space is at a premium. This parameter degrades the performance of the export, but that’s to be expected.
![]() CONTENT: This specifies what type of data you want to get. Do you want just object definitions? Do you want just the data? Both? Determine what you want to export and specify accordingly.
CONTENT: This specifies what type of data you want to get. Do you want just object definitions? Do you want just the data? Both? Determine what you want to export and specify accordingly.
![]() DIRECTORY: This specifies the directory where you want the dump file to go. This is an Oracle Object directory, not a simple path on the OS. We show you how to create a directory later in this chapter.
DIRECTORY: This specifies the directory where you want the dump file to go. This is an Oracle Object directory, not a simple path on the OS. We show you how to create a directory later in this chapter.
![]() DUMPFILE: This parameter names the dump file to be output. You can also have Data Pump number the files if you like. This numbering is handy when you use parallelism or have Data Pump break the job into multiple files of manageable size. To have Data Pump number the files, use the %U argument:
DUMPFILE: This parameter names the dump file to be output. You can also have Data Pump number the files if you like. This numbering is handy when you use parallelism or have Data Pump break the job into multiple files of manageable size. To have Data Pump number the files, use the %U argument:
DUMPFILE=my_dp_exp_%U.dmp
Data Pump starts with 1 and numbers the files to 99. What if you need more than 99 files? Try something like this:
DUMPFILE= my_dp_exp_seta_%U.dmp, my_dp_exp_set_b_%U.dmp
You can have it dump to multiple files, which is especially useful when you’re parallelizing the output.
![]() ESTIMATE: This parameter estimates your job size but won’t run it. Very handy when space is at a premium. This parameter stops the job after estimating.
ESTIMATE: This parameter estimates your job size but won’t run it. Very handy when space is at a premium. This parameter stops the job after estimating.
![]() EXCLUDE: You can exclude certain objects from the export. For example, say you want everything but the HR and OE schemas as well as all views and functions. EXCLUDE can have multiple entries. You can say this:
EXCLUDE: You can exclude certain objects from the export. For example, say you want everything but the HR and OE schemas as well as all views and functions. EXCLUDE can have multiple entries. You can say this:
EXCLUDE=SCHEMAS:"'HR','OE'"
EXCLUDE=VIEW,FUNCTION
![]() INCLUDE: Mutually exclusive with EXCLUDE, use this parameter if you want to get a specific type of object. When the list is small, this can be very useful:
INCLUDE: Mutually exclusive with EXCLUDE, use this parameter if you want to get a specific type of object. When the list is small, this can be very useful:
INCLUDE=VIEWS, TRIGGERS
![]() FILESIZE: You can break your Data Pump Export into multiple files, which aids file management. For example, if you have a 200GB export to do, you might not want a 200GB dump file to manage afterward. Instead, use this parameter to break it into 4GB chunks or something similar.
FILESIZE: You can break your Data Pump Export into multiple files, which aids file management. For example, if you have a 200GB export to do, you might not want a 200GB dump file to manage afterward. Instead, use this parameter to break it into 4GB chunks or something similar.
![]() FLASHBACK_TIME: If you want to dump the data from a time other than the present, you can use this parameter to specify a date and time. As long as your database still has the old data in its undo retention space, this parameter can be very useful.
FLASHBACK_TIME: If you want to dump the data from a time other than the present, you can use this parameter to specify a date and time. As long as your database still has the old data in its undo retention space, this parameter can be very useful.
![]() NETWORK_LINK: You can connect from one database to export to another by setting up a database link and specifying it with this parameter.
NETWORK_LINK: You can connect from one database to export to another by setting up a database link and specifying it with this parameter.
![]() PARALLEL: To help speed up your dump, you can parallelize it. Try different values to find the most efficient number of processes across different systems. At the very least, you should be able to parallelize by the number of CPUs you have while recalling the capabilities of the storage media to which you’re writing.
PARALLEL: To help speed up your dump, you can parallelize it. Try different values to find the most efficient number of processes across different systems. At the very least, you should be able to parallelize by the number of CPUs you have while recalling the capabilities of the storage media to which you’re writing.
![]() SCHEMAS: This parameter gives a list of schemas to Data Pump and tells it what to get. By default, Data Pump exports the schema that’s logging in to do the job.
SCHEMAS: This parameter gives a list of schemas to Data Pump and tells it what to get. By default, Data Pump exports the schema that’s logging in to do the job.
![]() TABLES: This restricts the export to a list of tables.
TABLES: This restricts the export to a list of tables.
![]() TABLESPACES: This parameter restricts the export to a list of tablespaces only.
TABLESPACES: This parameter restricts the export to a list of tablespaces only.
Data Pump Import
The command-line program impdb launches Data Pump Import. From the OS command line, launch Data Pump Import and have it show a list of the parameters:
<impdp help=y>
You see something like this:
Import: Release 12.1.0.1.0 - Production on Sat Jul 20 06:54:52 2013
Copyright (c) 1982, 2013, Oracle and/or its affiliates. All rights reserved.
The Data Pump Import utility provides a mechanism for transferring data objects
between Oracle databases. The utility is invoked with the following command:
Example: impdp scott/tiger DIRECTORY=dmpdir DUMPFILE=scott.dmp
You can control how Import runs by entering the 'impdp' command followed
by various parameters. To specify parameters, you use keywords:
Format: impdp KEYWORD=value or KEYWORD=(value1,value2,...,valueN)
Example: impdp scott/tiger DIRECTORY=dmpdir DUMPFILE=scott.dmp
...output snipped...
Like Data Pump Export, Import lists the parameters that can be used with the import portion of Data Pump. Many of these parameters behave the same way they do when you’re using Data Pump Export.
Take a closer look at some the Data Pump Import parameters:
![]() CONTENT: If you have a full content export file, you can choose to import only the metadata. For example, you might want to create all the tables with no rows. Obviously, if you didn’t include the rows in the export dump file, you can’t tell Data Pump Import to put them in!
CONTENT: If you have a full content export file, you can choose to import only the metadata. For example, you might want to create all the tables with no rows. Obviously, if you didn’t include the rows in the export dump file, you can’t tell Data Pump Import to put them in!
![]() ESTIMATE: This parameter estimates the size of the Data Pump Import.
ESTIMATE: This parameter estimates the size of the Data Pump Import.
![]() DIRECTORY: This one tells Data Pump Import where it can find the dump file. It doesn’t have to be the same place it was dumped, but you must move the file to the new location. This parameter might be useful when moving the file to another machine or OS.
DIRECTORY: This one tells Data Pump Import where it can find the dump file. It doesn’t have to be the same place it was dumped, but you must move the file to the new location. This parameter might be useful when moving the file to another machine or OS.
![]() DUMPFILE: A complete listing of all the files created by Data Pump Export.
DUMPFILE: A complete listing of all the files created by Data Pump Export.
![]() EXCLUDE: This works much like Data Pump Export but tells Data Pump Import what to leave from the dump file.
EXCLUDE: This works much like Data Pump Export but tells Data Pump Import what to leave from the dump file.
![]() INCLUDE: This parameter is another way of controlling what objects are put into the target database.
INCLUDE: This parameter is another way of controlling what objects are put into the target database.
![]() FLASHBACK_SCN, FLASHBACK_TIME: Use these parameters with the Data Pump Import tool only when connecting through a NETWORK_LINK. Data Pump Import can connect directly to a remote database across a database link and write the data directly into the target system. Use these parameters to pull data from the past.
FLASHBACK_SCN, FLASHBACK_TIME: Use these parameters with the Data Pump Import tool only when connecting through a NETWORK_LINK. Data Pump Import can connect directly to a remote database across a database link and write the data directly into the target system. Use these parameters to pull data from the past.
![]() NETWORK_LINK: You can connect from one database and import into another by setting up a database link and specifying it with this parameter. No files are created when this method is used. This parameter is very handy for logical recovery and cloning.
NETWORK_LINK: You can connect from one database and import into another by setting up a database link and specifying it with this parameter. No files are created when this method is used. This parameter is very handy for logical recovery and cloning.
![]() PARALLEL: This helps speed up your import.
PARALLEL: This helps speed up your import.
![]() REMAP_SCHEMA: This parameter is handy for copying the objects/data from one schema to another.
REMAP_SCHEMA: This parameter is handy for copying the objects/data from one schema to another.
![]() REMAP_TABLESPACE: Moves the objects into a new tablespace. By default, they go into the same tablespace they came from. This parameter is useful when used in conjunction with remap_schema and while moving data from one database to another.
REMAP_TABLESPACE: Moves the objects into a new tablespace. By default, they go into the same tablespace they came from. This parameter is useful when used in conjunction with remap_schema and while moving data from one database to another.
![]() SCHEMAS: This parameter gives a list of schemas to Data Pump to tell it what to import. By default, Data Pump imports everything in the file. In essence, you can have a full export but then pick and choose what you want to import.
SCHEMAS: This parameter gives a list of schemas to Data Pump to tell it what to import. By default, Data Pump imports everything in the file. In essence, you can have a full export but then pick and choose what you want to import.
![]() TABLES: As with SCHEMAS, you can choose from your dump file what to import.
TABLES: As with SCHEMAS, you can choose from your dump file what to import.
![]() TABLESPACES: You can choose what tablespaces you want import from the dump file.
TABLESPACES: You can choose what tablespaces you want import from the dump file.
Creating Oracle Directories
An Oracle directory is required for Data Pump. A directory is basically a portal to a location on the operating system.
Directories are controlled by both system and object privileges. You need a system privilege, CREATE DIRECTORY, to create one. If your user doesn’t own the directory, you need READ and/or WRITE object privileges on the directory to use it.
To create a directory, log in to the database as a user with appropriate privileges and type the following:
create directory my_data_pump_dir as '/u01/app/oracle/dumpfiles';
You should see this:
Directory created.
Using Data Pump with a Parameter File
A parameter file is a text file listing the parameters for the Data Pump Export or Import and setting the chosen values. Data Pump Export and Import parameter files are constructed the same way.
Follow these steps to run a Data Pump Export with this parameter file:
1. Type the parameter file into a text editor and save it to a directory.
This example is a parameter file that exports the DEPARTMENTS and EMPLOYEES tables of the HR schema:
# File: /u01/app/oracle/scripts/datapump/my_data_pump_parfile.par
DIRECTORY=my_data_pump_dir
DUMPFILE=my_data_pump_dumpfile.dmp
LOGFILE=my_data_pump_logfile.log
SCHEMAS=HR
TABLES=EMPLOYEES, DEPARTMENTS
COMPRESSION=ALL
2. Open a command-line prompt and go to the directory where your parameter file is saved.
3. Launch Data Pump Export with your parameter file:
<expdp parfile=my_data_pump_parfile.par>
You should see this:
Export: Release 12.1.0.1.0 - Production on Sat Jul 20 06:51:40 2013
Copyright (c) 1982, 2013, Oracle and/or its affiliates. All rights reserved.
Username:
4. Enter the username and give the password for the user you want to export with.
You should see something like this:
Connected to: Oracle Database 12c Enterprise Edition Release 12.1.0.1.0 - 64bit Production
With the Partitioning, OLAP, Advanced Analytics and Real Application Testing options
Starting "SYS"."SYS_EXPORT_SCHEMA_01": /******** AS SYSDBA parfile=my_data_pump_parfile.par
Estimate in progress using BLOCKS method...
Processing object type SCHEMA_EXPORT/TABLE/TABLE_DATA
Total estimation using BLOCKS method: 128 KB
...output snipped...
. . exported "HR"."DEPARTMENTS" 5.437 KB 27 rows
. . exported "HR"."EMPLOYEES" 8.726 KB 107 rows
Master table "SYS"."SYS_EXPORT_SCHEMA_01" successfully loaded/unloaded
******************************************************************************
Dump file set for SYS.SYS_EXPORT_SCHEMA_01 is:
/u01/app/oracle/dumpfiles/MY_DATA_PUMP_FILE.DMP
Job "SYS"."SYS_EXPORT_SCHEMA_01" successfully completed at 06:52:25
5. Create the user and the tablespace.
Make sure both users have the same privileges.
6. Create a parameter file that imports the data into a new user in its own tablespace.
In this example, HR2 is imported to its own tablespace, HR2_DATA.
Because this export is only a partial piece of the HR data model, you exclude constraints and triggers; they have dependent objects that aren’t in the export dump file. You don’t have to exclude them, but you get an error in the log file as Data Pump tries to create them.
Such a parameter file might look like this:
# File: /u01/app/oracle/scripts/datapump/my_HR2_data_pump_parfile.par
DIRECTORY=my_data_pump_dir
DUMPFILE=my_data_pump_file.dmp
LOGFILE=my_HR2_data_pump_logfile.log
EXCLUDE=CONSTRAINT
EXCLUDE=TRIGGER
REMAP_SCHEMA=HR:HR2
REMAP_TABLESPACE=EXAMPLE:HR2_DATA
7. Run the import:
<impdp parfile=my_hr2_data_pump_parfile.par>
You should see something like this:
Import: Release 12.1.0.1.0 - Production on Sat Jul 20 07:00:17 2013
Copyright (c) 1982, 2013, Oracle and/or its affiliates. All rights reserved.
Username: / as sysdba
Connected to: Oracle Database 12c Enterprise Edition Release 12.1.0.1.0 - 64bit Production
With the Partitioning, OLAP, Advanced Analytics and Real Application Testing options
Master table "SYS"."SYS_IMPORT_FULL_01" successfully loaded/unloaded
Starting "SYS"."SYS_IMPORT_FULL_01": /******** AS SYSDBA parfile=my_hr2_data_pump_parfile.par
Processing object type SCHEMA_EXPORT/USER
Processing object type SCHEMA_EXPORT/TABLE/TABLE
Processing object type SCHEMA_EXPORT/TABLE/TABLE_DATA
. . imported "HR2"."DEPARTMENTS" 5.437 KB 27 rows
. . imported "HR2"."EMPLOYEES" 8.726 KB 107 rows
...output snipped...
Job "SYS"."SYS_IMPORT_FULL_01" successfully completed at 07:02:53
By default, the log file is created in the same directory as your dump file. The log file is a text file that any text editor can read.
If the user is someone other than the schema you’re exporting or importing, you need one of these two things:
![]() DBA privileges
DBA privileges
![]() The DATAPUMP_EXP_FULL_DATABASE and DATAPUMP_IMP_FULL_DATABASE roles
The DATAPUMP_EXP_FULL_DATABASE and DATAPUMP_IMP_FULL_DATABASE roles
If you’re working as an administrator in a container database (CDB), you also need the CDB_DBA role.