Chapter 3
Anatomy of a Credit Crisis and Examples in the Real World
Economies have an uncanny ability to create spectacular booms as the country deploys savings from a loan/deposit ratio LDR of about 0.6 up to an LDR of 1. Those in power are lucky, as they ride a wonderful gravy train of credit creation, rising asset prices, and rising productivity (we will see later that new calculations of productivity are mostly predicated on credit creation; this is one of the dirty secrets of the modern age). A modern example of this has been the spectacular rise of Lula in Brazil. He rode a great wave of credit creation in the 2000s in Brazil and could do no wrong. He became a darling of the developing world.
Now that Brazil's LDR is at a dangerous level and there is simply no credit around, President Roussef is having a harder time. The Brazilian fiscal deficit at the end of 2014 is heading to US$10 billion. And the current account deficit is heading to US$80 billion, one of the highest globally. The same was true of President Yudhoyono when he became president of Indonesia. When the credit cycle is in your favor, you can do no wrong as a leader (for example, President Reagan in 1980–1988). When the credit cycle stalls and asset prices fall, you can do nothing right (President George H. W. Bush in 1992). President Lula was a hero in a great wave of credit, President Roussef is hanging on by her fingernails, and their policies are very similar. President Clinton's reign was one of spectacular credit growth from a base of a low LDR. President George W. Bush's second term was (and will be) cursed by the greatest implosion in credit in modern history as the LDR reached multiyear highs by 2008. Credit makes and breaks national leaders.
It is important to remember that within 12 months of the Asian crisis, every leader was voted out of office or chased out of town on a rail. And several political parties in power for decades collapsed overnight. Examples of political parties or persons who were gone within 24 months of the crisis include Golkar and Suharto in Indonesia, the KMT in Taiwan, and President Y. S. Kim in South Korea. Thailand's government collapsed. Opposition parties that had been out of power for decades rose to power. In Malaysia, deputy PM Anwar tried to assert his leadership but was thwarted. Mahathir was gone by 2003.
The 2008 global financial crisis was a repeat of this political turmoil. President Obama came to power in a landslide in 2008. The Labour Party was thrown out of power in the United Kingdom. In a 24-month period, governments throughout Europe collapsed, including Spain, Greece, Ireland, Italy, France, Iceland, and Holland. Right-wing parties were born and are on the rise in many of these countries. As the cost of capital falls to zero and labor wages remain sticky, there is an irresistible urge to replace labor with capital. This phenomenon always aggravates a financial crisis. Young unskilled labor, which is not ready for the technological booms that always follow a financial crisis, rebels when it finds itself uncompetitive and out of work. We will follow up on this in the chapter on financial technology.
Capital Cycles
The world is fundamentally unbalanced. When Asia's LDR was rising from 0.6 to 1.2 in the period from 1992 to 1996, the United States was recovering from the worst recession since World War II. It was digging out from the mess of the savings and loan (S&L) crisis. George H. W. Bush was defeated and Clinton came to power in 1993 with much to do—but the worst was behind. In 1998 to 2003, when Asia was collapsing, the West embarked on a very impressive boom, which culminated in the real estate bubble of 2006–2007. When the West collapsed in 2008 to 2011, the emerging markets embarked on a spectacular boom as these countries received zero interest rates from an exhausted Western financial system.
Figure 3.1 shows the interplay between the emerging markets and the developed markets over time. It has been a toxic relationship in which one reinforces the excesses of the other because both were rapidly attached to the idea that unfettered capital flows—no matter how overwhelming and ultimately destructive—were the ideal. So, the wholesale funding of one part of the world with excess liquidity poured it into the other part regardless of whether the recipient was ready or able to digest the flows in a healthy manner. In the 1990s, Western banks with little demand poured excess capital into Asia and then withdrew it just as things were getting tough. This made the situation that much more violent when the credit cycle stopped. This is a classic example of how capital flows—the other side of trade flows—are pro-cyclical.
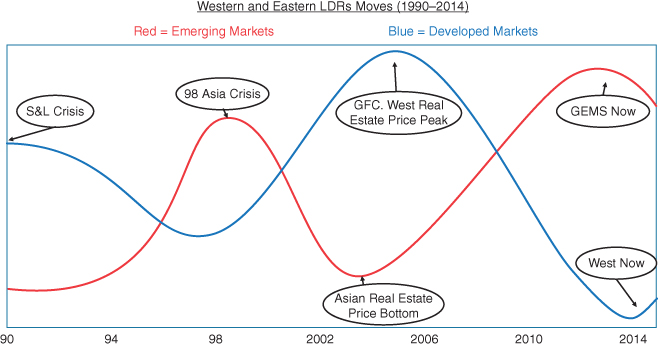
Figure 3.1 Western and Eastern LDRs: If LDRs Can Go as High as People Want, Systemic Instability Will Rule
Similarly, in the early 2000s, when Asia was on its back, banks like HSBC bought into Household Finance only to sell out at the top of the market in 2009 and 2010, thus aggravating the situation in the United States. Never mind that the United States was peddling fraudulent collateralized debt obligations (CDOs), which were funding the real estate boom. Many central banks with excess liquidity (including the central banks in Japan, Hong Kong, Taiwan, and China) bought these CDOs only to discover that these were problematic. They were doing this to keep their currencies undervalued (buying dollar-related assets to pull the dollars out of the system and prevent these dollars from buying local currency and increasing its value).
Figure 3.1 shows the problem. Only in the past three years or so have some countries awoken to the fact that it is okay to slow down capital flows and not be named a capitalist heretic and burned at the stake. More countries are restricting wholesale funding by refusing their own LDRs from exceeding 1. They are forcing banks to become wholly owned subsidiaries inside the country and allowing them to lend only what they collect in deposits. This is a healthy trend. As we will see later, when the LDR blows out to 1.1 to 1.3, the resulting crisis always falls on the taxpayer. And the government in power is almost always thrown out. Politicians and taxpayers, then, are peas in a pod when it comes to preventing excessive wholesale funding from blowing up an economy.
Before we go into the individual examples of countries and their fall from grace through credit crises and balance sheet recessions, let's try to lay out the anatomy of a crisis as it applies to just about any country. There are clear and unequivocal similarities among and between countries, whether in the developed or the developing markets. It goes something like this:
- Corporates grab for stand-by facilities. At the beginning of a crisis, the LDR actually rises after the crisis is in a full-blown stage. We see this most of the time. This is because as corporations realize that the party is over and pain is ahead, they quickly scramble to exhaust lines of credit. These lines of credit are contractual obligations between the bank and the corporation to provide funding on request. So, the corporations and financial institutions scramble to draw down as much as they can for the tough times ahead.
- Receivables/payables squeeze, followed by a sudden drop in growth. Following this period of drawing down as much credit as possible, the real squeeze starts when corporates try to extend their payables and take as long as possible to make payments. And they call around and browbeat their customers to cough up money. This is the process of “getting blood out of a turnip,” and it is usually the earliest sign of the crisis. The early signs appear at first in the short-term part of the interest rate structure. There is a tug of war, with corporations both demanding money from everyone else and at the same time delaying their own payments for as long as possible. This causes a squeeze and the scarcity of money to go around causes rates to spike.
- Banks pull lines of credit. This spreads to the other parts of the economy quickly. Banks finally wake up and begin to pull lines of credit. The old adage of bankers that “they give you an umbrella when it is sunny and take it away when it is raining” is too true. The scarcity of money to cover business costs and make interest expenses on an even larger pile of debt (after lines of credit are drawn down) becomes aggravated as banks withdraw lines of credit. When it rains, it pours. Many forces coalesce to worsen a situation if banks only could act to counter a liquidity squeeze. All too often, they tend to either cause it or aggravate it.
- Wholesale banks withdraw lines and things worsen fast. Then it gets really nasty. A short-term liquidity squeeze spreads into the economy, and the supporting cables of the financial bridge snap one after the other. At first it is worrying, but people (forever optimistic, for what choice do they have?) just assume the bridge will hold. After a few months, however, the wholesale banks (forever behaving like a knitting club and passing along the local gossip) act in unison to pull large lines of international credit. As we have seen over and over again, the pulling of these very large lines of international credit (which are present only after the LDR exceeds 1 and only after asset prices have been bid up by the exhaustion of local savings) causes significant and sudden damage. The pulling of large lines of credit—often hundreds of millions of dollars at a time—has a pro-cyclical effect and worsens the liquidity squeeze. Governments that signed up for unfettered and free flows of capital have no choice but to see this capital walk out the door overnight.
- Domestic confidence tumbles and deposits exit. The next part of the crisis is the loss of domestic confidence, as the crisis in the short-term part of the financial system spreads to the long-term part of the funding structure by way of the exodus of wholesale funding. At this point, a few things happen. Some wealthy individual depositors and corporates decide that they want out completely and withdraw their deposits, convert them to foreign currency, and move them to another location. It is a well-kept secret that in the case of Thailand, domestic entities all the way up to the top of the government were also converting their local deposits into foreign currency deposits before the Thai baht was devalued on July 3, 2007. In the case of Russia today, it is the locals that are also causing the currency to collapse as they are exiting into dollars. (It is a fascinating mark of our times that many of the people looking to get their money out of Russia are doing so through bitcoin!) While it is all too convenient to blame foreigners, it is often the locals who initially trigger a capital outflow event that leads to currency collapse. This was also particularly rampant in both Greece and Spain at the height of the global financial crisis. In the case of Greece, more than 20 percent of local currency was converted into foreign exchange and left the country to places like London and New York. The same was true in Thailand in 1998. The fact is that the United Kingdom decided not to be a part of the euro that saved it. London was one of the biggest winners globally as capital from the Olive Belt exited Spain, Greece, and Italy and went to London deposits, houses, apartments, and other Sterling assets.
- Bankers try to protect their fiefdom and cover up. At the early part of the crisis, local bankers do not see it coming. As someone who worked inside some of the biggest wholesale banks globally, I promise you: They never see it coming. A few might, but they do whatever they can to squash the naysayers or research analysts who want to warn the group. At first, these bankers honor their commitments to draw down lines of credit. As time passes, their internal financial controllers begin to see a tightening of conditions and then see a marginal withdrawal of credit. Bankers themselves panic and add to the problems. They make poor decisions and try to protect their fiefdoms only to make matters worse. They try to deceive their internal auditors, doctor documents, and tell their colleagues to keep their mouths shut. They try to push the problem under the carpet and do anything to keep the central bank or regulators from knowing the truth.
- Lending falls, and savings and lending fall more—the vicious cycle. This is the chain reaction of spiraling as the withdrawal of credit causes an automatic reduction in lending, which causes a reduction in deposits. Increasing withdrawals of deposits to be used either to cover financial problems or for the purposes of capital flight aggravates the problem. When deposits stop coming in or recede, there is an automatic cessation of lending—for lending comes from deposits and vice versa. Panic generally ensues, and bankers try to do what bankers do best—cover their own behinds. They have stern conversations with their customers to “come up with the funds” or else. Bankers inadvertently cut their own throats, because they force their customers to use up savings to repay debt. Pressure is exerted and threats of pulling all credit lines ensue. If available liquidity is used to repay debt and future debt is stopped, the liquidity squeeze intensifies as less savings leads to less lending and less lending leads to less savings. This is a vicious cycle from which it is hard to emerge.
- Currency collapse. This part of this unwind of the excess credit buildup is the collapse of the currency. As local depositors see the exodus in wholesale funding, and the liquidity squeeze causes paralysis in the financial system, it becomes hard to conduct business. Activity stops because the leverage machine has suddenly come to a halt. If it is hard to fund (pay for) inventories of tires, textiles, sugar, and payroll, business slows down and people are fired. Confidence begins to unravel, and after a few months, panic sets in and corporations (domestic and international) decide to leave the country. At this point, strikes may occur and there may be some violence. People lose their homes, cars, businesses, luxury items, and the like. Bitterness and recrimination rule the roost, and the political system becomes dysfunctional, since all there is to do is point fingers. Politicians are hopelessly confused by the unwinding of the financial system and often resemble deer in the headlights. It is interesting to see in so many crises how long it takes for the currency to finally crack. The currency can go sideways for a year to 18 months before it suddenly falls apart.
- Central bank intervention. This part of the crisis is the need for the federal government and the central bank to replace the liquidity that is leaving at a rapid pace. This is where we go back to the all-important quotation of Alan Greenspan. Asked what the most important role of a central bank is, he once basically said that central banks buy time. At this point in the crisis, central banks enter and first try to stop the bleeding. They intervene in foreign exchange markets to stabilize the currency. They intervene in the interbank market and try to introduce liquidity. Often, they need to intervene and backstop the credit system by buying assets, which would otherwise contribute to a spread of panic. The Federal Reserve did this by actively intervening in the mortgage-backed securities market and buying more than US$1 trillion in mortgage-backed securities. We will see in the chapter on central banks that once a crisis is in a full-blown stage, it becomes necessary to step in. Of course, the central bank can do much to prevent the mess in the first place, but—alas!—central banks actually work for the bankers, and not for shareholders or taxpayers.
- Government collapses. The tenth part is the collapse of government. By the time a financial crisis reaches full-blown proportions, the central banks have intervened to stop the bleeding and provide some normalcy in credit markets, but the economy is a mess. As a result, governments are forced to both engage in deficit spending for public works and other projects and also help to recapitalize the banks. Inevitably, however, politicians can't help themselves and get involved in sweetheart deals as a quid pro quo for helping the bank. Of course, taxpayers are disgusted that those politicians are helping the very same people who have been busy repossessing homes and cars. But when they find out that the bankers and the politicians have been scratching each other's backs by allowing such things as predatory lending, deceptive mortgage practices, sloppy or nonexistent appraisal processes, or outright fraud, the electorate goes berserk and throws out the entire party. We will discuss this in the chapter on lending and politics.
At this point, confidence is shattered, the banking system is at a virtual standstill, and the population is burning mad. Arrests at this point are common. The point is that expectations are so bad that anything will work. At this point, the smart politicians and central bank governors will step up to the plate. At this point, no one cares about anything except “trying anything.” This is where greatness comes from. It is a matter of the right timing and right place; it is not a matter of the right person. From here, there is nowhere to go but up. A new government does not have the taint of scandal, so it can make bold moves.
The Winners after a Crisis
Here are a few examples. President Obama's administration in the early days of 2009 and 2010 made some very bold moves by passing a huge stimulus package and deepening the policies imposed by Secretary of the Treasury Paulson. He kept on the same people against popular pressure. He created continuity, but brought creative people in who were not afraid to “try anything.” David Cameron's government made very aggressive and bold moves and succeeded as well. Ireland's government made very brave and painful moves at first and these have paid off in spades. Ireland was the first to exit the deep recession and has been rewarded by investors. France's new government did not make any bold moves, and there has been a series of bad governments. The same goes for Italy and Spain. The political choices are all bad, but the politicians who make the boldest moves at the bottom often reap the greatest benefits. Those who dilly-dally are soon out.
Thailand
Thailand is a terrific example of a country that has had among the most remarkable boom-and-bust scenarios in the world over the past 15 years. I was in Asia in the early 1990s, and there was a great love affair with Thailand at the time. Investors poured billions of dollars into the “Land of Smiles” in the early 1990s through equity markets. The credit market took off, as we can see in the left side of Figure 3.2. The LDR peaked at 1.15, meaning that Thailand was being forced to look for international lending from wholesale banks in order to cover the deficit internally. (Any LDR above 1 means that all savings has been deployed into the economy through credit, so the country must resort to outside activity.)
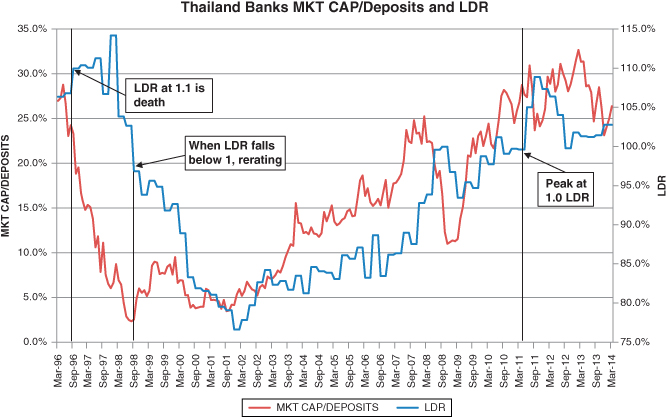
Figure 3.2 Thailand Banks Market Cap/Deposit and LDR: The More Extreme the LDR, the Greater the Pain
The problem here is that by 1996, the LDR had already passed 1 and the listed banks smelled a rat. As the U.S. banks did later in 2006, the Thai banks peaked in the summer of 1996, a full year before the whole crisis got out of hand and the Thai baht collapsed. At that time, a host of Pollyannas said that everything was okay and a minor economic downturn was underway. Again, this prognosis by economists was the right call if they completely ignored the extent of the credit creation relative to savings (both individual and corporate).
By the early spring of 1997, the listed banks had already fallen 40 percent and, remarkably, there was an air of calm. I know of one large fund that made a US$500 million bet on the banks at this point. They thought the banks had fallen enough but were also blind to the realities of the credit cycle. This was a very expensive lesson, for this fund walked out of Thailand with a US$400 million loss. They did not understand the extent of the deleveraging required. The lesson in the unwind of leverage cost them an 80 percent loss. Leverage bites!
As the bank stocks kept falling and the LDR hovered at 1.15, the pressure on the currency was too great. Why? We see over and over again that by the time all of the savings of a country (both corporate and individual) have been deployed, all of the assets of a country have generally been scooped up, and there is little value left over. This makes a lot of sense since locals would have used the boom to purchase plant, equipment, houses, vacation homes, urban condominiums, agricultural tracks of land, and other assets such as jewelry, luxury cars, and boats. By the time the LDR passes 1, the excesses are already baked into the cake with credit. The suckers, wholesale funders who entered Thailand after the LDR exceeded 1 (banks like Standard Chartered, HSBC, Citi, Bank of America, among others), did so when prices had already been bid up and all of the domestic credit had been disbursed.
By the summer of 1997, the currency could not take it anymore. Think of the currency as the price tag of a country. In mid-1997, Thailand was a low-end manufacturer with a Switzerland price tag. The currency had to give. When it gave, a chain reaction of mass destruction was set off. In this type of situation, three things happen.
First, cash buyers are the only ones left when the credit window shuts. When I give a loan of $90,000 for you to buy a home and you put down $10,000, the value of that loan directly relies on the loan to keep the price up. If credit is suddenly cut off, the only other person who can buy my home from me is someone with cash. So, this person without leverage can only buy my home from me at a fraction of the price—hence, the destruction to asset prices when credit is cut off. Economics fails to take this into consideration.
Second, a devaluation of the currency destroys people who have borrowed foreign currency. Take this further and say that the person borrowed $90,000 in U.S. dollars and did not hedge it. They converted this $90,000 into local currency (the Thai baht at the time had a prevailing rate of THB 25/US$1). They bought a home with THB 2.25 million. They put down THB 250,000 (US$10,000) for a total of THB 2.5 million. When the Thai baht finally collapsed under its own weight (the price tag of the country could not in any way justify the underlying fundamentals of industrial output), it finally went to THB 50/$1. This meant the person had to pay back the mortgage in dollars, which had become THB 4.5 million when the devaluation of the currency had been taken into consideration. The unhedged foreign debt payments for all obligations ballooned.
Third, as and when the currency falls, wholesale lenders into a country, like rats, leave the sinking ship. At the same time, the devaluation of the currency caused a panic (as all sudden devaluations do) and foreigners pulled out their money. Economic activity then slowed (after the fact), and it became harder for individuals and firms to create revenue. On top of this slowing activity, the absence of credit caused a fall in prices (after the fact) for goods and services, and people had a harder time creating revenue to service debt.
This chain reaction caused by excessive domestic credit (and high levels of foreign credit) brought about a chain reaction that was mostly blind to all—except to bank stocks. Banks' stocks had seen this coming a long time before. By the time the crisis was a full-blown implosion in the late summer of 1997, the combination of the dynamics above (difficulty in creating revenue to make interest payments, higher principal repayment given the absence of future credit to prop up assets, and the need for more cash to repay foreign exchange obligations loans at a dramatically lower rate) caused a total meltdown in the economy. It is all predicated on credit dynamics, which are missed by basic economics.
What Happens in Thailand Does Not Stay in Thailand
The aftermath of this catastrophe is that bank stocks finally stopped falling (not surprisingly) when the LDR fell below 1. At this point the savage devaluation did have some benefit. Thailand became very competitive again, and there was a lot of new trade as well as inflows of equity to buy cheap assets. This is what is known in common parlance as a “reset.” Bank stocks like to see the LDR below 1. What happened after that is a common phenomenon (currently happening in the United States) where people have an economic form of “shellshock” and lack confidence to start a new firm with debt. They pay down existing debt. They are trying to wiggle out of bankruptcy. They distrust banks. And as we shall see in the chapter on politics and banking, there is almost always a change of government that is populist in nature and that has to raise taxes to pay for the banking crisis. These tax increases tend to discourage investment for a period.
Furthermore, interest rates tend to fall dramatically after the crisis dies down (as they did in the United States from 2009 until now) and the cost of capital falls dramatically relative to labor. Wages do not adjust down as quickly as capital does, so many people find themselves underemployed or out of work. The smart ones can reinvent themselves and, for example, close the overpriced beauty salon and open a toy exporting company to take advantage of a weak currency. Too many people are stuck in a “middle-class” trap and have a wage level that is not matched by a level of expertise appropriate in a new economy. This dynamic always brings resentment and bitterness, especially from young men and women who have had a taste of the good life and are now suddenly cut off from the upward climb of wealth.
From 1997 to 2003, Thailand was in a mess very much like Europe today. This is because during a period of deleveraging, banks not only do not have any new credit to distribute, they are also withdrawing credit from the system; therefore asset prices are falling. Businesses are shrinking. And consumption is flat at best. The only parts of the economy that were growing were the government (by deficit spending) and exports (after a savage devaluation of the baht). Growth was sluggish and unemployment was high, especially for youth. By late 2003 and early 2004, after a seven-year belt-tightening experience, the country had replenished its savings and the banking system could begin to lend again. Bank stocks began to move and the LDR was rising. Banks make money by lending a quantity of loans at a price that is the difference between the deposit rate and the lending rate. This spread was high, and the quantity of lending was high. So Thailand was once again in “fat city.” The economy and the stock market were on a roll. What happens during a financial crisis, however, is that between five and seven years go by, and a generation of young people either drops out of the workforce or cannot afford school—or both. This generation suddenly finds the economy booming again, yet lacks the skills to engage the system and find solid employment. This disenfranchised class of youth can create a problem for governments. It happens all the time and is happening currently in Spain, Greece, and Italy.
This dynamic started in 2005 in Thailand and has been smoldering for many years. The new economy of Thailand favored the asset holders, who still had access to credit when the economy imploded. These are usually the wealthy urban established families. The rest will tend to slowly drift away as the economic iceberg cracks apart. We will see in the chapter on politics and banking that this rich/poor gap must be addressed through creating new industries, new sources of productivity, better education, or some direct or indirect form of redistribution through taxation. Otherwise, the pocket of youths who have been cut out of the economic future of a country will turn to violence; hence the ongoing violence in Thailand. This very definitely had its roots in the 1997 crisis. Thailand has not been the same since 2005, when an increasingly violent populist impulse across the country began to raise its ugly head. A sudden absence of credit to the middle class causes all sorts of nasty problems for a society.
Brazil
Like Thailand in the early 1990s, investors had a passionate love affair with Brazil when President Lula came to power in early 2000s. Investors were initially uncertain about just what kind of industrial policies he was going to follow. It was unclear whether he would lurch to the left and pursue protectionist, socialist, collective policies to support the poor and move toward economic nationalism. It turns out that he was pro-markets and pro-reforms. In that sense, he welcomed private enterprise and entrepreneurialism.
What he had up his sleeve, however, was a banking system that at the time was one of the most liquid systems in the world. See Figure 3.3, and notice that the LDR was 0.7. This means that for every R$7 of loans there was R$10 of deposits. To get to the ideal target of an LDR of 1, the banking system could conceivably double and still be in the safe zone. This is exactly what happened.

Figure 3.3 Brazil Banks Market Cap/Deposits and LDR: In Definite Danger Territory
Between 2003, when Lula came into power, and 2010, at the peak of his power and popularity, the banking system reached an LDR of 1.2. Brazil had generated a spectacular credit boom and was also a beneficiary of the demand for iron ore, coal, and commodities from China. Since 2012, however, Brazil's economy has been sputtering, despite the torrent of activity for the World Cup in July 2014 and the Olympics in July 2016.
In addition, look at the red line. We see over and over again that the greatest rallies in banks always occur as a country is deploying its savings and creating credit from the level of 0.6 or 0.7 all the way up to 1. See in the case of Brazil that bank stock prices kept on increasing as the LDR increased up to 1. It was almost the same line. It is wise to use market cap/deposits (a more pure form of the price-to-earnings ratio, or P/E) to remove the noise that many book values of banks contain. Market cap is the pure form of price. Deposits are the pure form of value for a bank. After all, a bank's value is kept only insofar as it creates confidence for depositors to conclude that their money will be safe tomorrow.
By 2008, however, the Brazilian banks smelled a rat, like Thailand did in 1996, and peaked when the LDR breached the safety zone of 1. They rallied for a bit after that, but fans of technical analysis will notice a perfect “head and shoulders” formation, which the banks formed throughout 2009–2010. The banks have never been the same and have traded in a sideways, choppy manner ever since. The banks have been dead money—and for good reason.
Brazil now stands as one of the major economies that have the largest LDRs globally. And this does not count the debt levels in the national development bank (BNDES). The LDR currently stands at 135, far higher than the LDR at the height of the Asian crisis in 1997. Furthermore, the BNDES went on a lending spree in early 2014, presumably to fund construction for the World Cup. The institution lent out more than US$20 billion in one quarter between January and March 2014.
As of this writing the 2014 World Cup, hosted by Brazil, has been a success, but the country is sorely cash-strapped and it is increasingly clear that it does not have enough resources to finish the facilities for the Olympics, which are to be held in two years' time. There has been discussion of moving the Olympics to another country, but it is too late in the process to do so. In addition, the Olympics has tended to be a kiss of death for a country. There is a long tradition of post-Olympics recessions/downturns.1
The banks are very likely to be a bad investment for a considerable period. This may prove to be a period of plenty in capital markets as Brazil is forced to liberalize the listing process and remove the multi-decade cobweb of bureaucracy that covers the stock exchange. We can be hopeful, but my experience is that the country is now controlled by a powerful party apparatus that has given birth to an extreme form of bureaucracy bordering on psychotic. In addition, there are levels upon levels of corruption that may hamstring the country for years to come. Brazil may need a new government that can break up the monstrous bureaucracy and tackle corruption at all levels. Let's not hold our breath for this one.
Indonesia
Indonesia is an exceptional example of a country that not only weathered a severe storm in 1998, but came out of the crisis with its democracy intact. We cannot say the same about Thailand. It is difficult to overestimate how severe the damage was when Indonesia hit the wall in 1998. The currency went from IDR2,500/US$1 to IDR25,000/US$1. The economy came to a halt and shrank more than 15 percent. If one tries to collect the data to reconstruct the banking system in 1998–1999, it is virtually impossible since the banking system came to a complete standstill and most of the banks in the system collapsed.
When the country emerged from the economic ashes in 2002, banks like Bank Niaga had 90 percent of their assets in central bank notes. Think about it. It had no loan book for the private sector, and its lifeblood depended solely on the sovereign credit rating of the government. The currency slowly began to appreciate and the economy slowly began to recover. If we look at Figure 3.4, it is remarkable to see that the LDR for the banking system by 2003 was 0.3. I have been looking at banks for 20 years and I have never seen an LDR of 0.3. This tells us that Indonesia in 2002 was pretty much a cash economy and the credit system (five years after the crisis) was still virtually nonexistent.
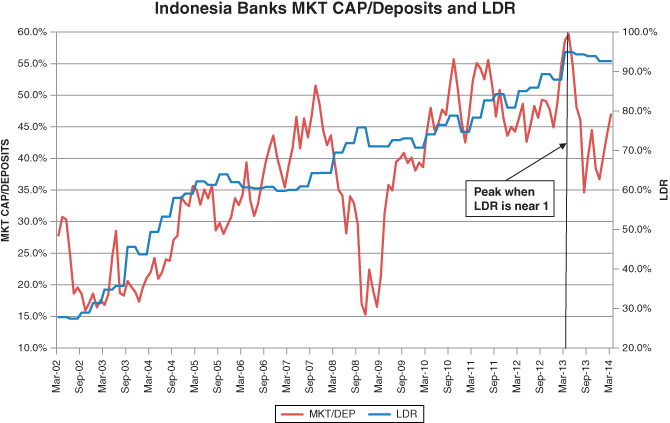
Figure 3.4 Indonesia Banks Market Cap/Deposits and LDR: Bumping up against a Ceiling
The United States
As noted above, while Asia was recovering excess liquidity found its way into the United States in 2002 and peaked in 2007. The banking system was full of wholesale lending. Banks like J.P. Morgan lent money through the wholesale market to Lehman Brothers in order to fund the enormous CDO machine. Lehman was creating obscure real estate securities and then selling them to central banks with too many dollars. Lehman was its own country within the United States and was entirely dependent on wholesale funding. This dependence was an imbalance far worse than anything that we saw during the Latin American debt crisis in the 1980s. All it took was one phone call from J.P. Morgan in September and Lehman was gone.
It is here that many people say that the banks don't really matter because of the size of the corporate paper market and disintermediated credit products. The facts do not bear this out. By 2008, the corporate paper market was indeed large, but credit generated by the banking system was just shy of US$4 trillion. At the time of the crisis, this was one third of GDP—a very sizable portion. The proportion of bank debt to total debt for most countries globally is about 70 percent to 80 percent of GDP. These bank debt numbers matter!
Figure 3.5 shows that the United States in 2008 was a carbon copy of Asia in 1997. First, it is interesting to note that at the peak of the boom in credit, most banks have a market cap/deposits of about $.35 to $.40. The United States had exactly that. Second, the U.S. banks also peaked out at an LDR of 1.15, similar to Thailand and other countries who experienced economic downturns. Third, when the LDR of the U.S. banks passed 1, this was in the second quarter of 2007. Arguably, this was the last quarter of the old normal before the system cracked. By the summer of 2007, strange noises were heard as the financial ship began to creak under its own weight and began to list. The ratings agencies woke up from their corrupt slumber and began slashing ratings on CDOs. Many economists—including economists within the Federal Reserve—said everything was okay.
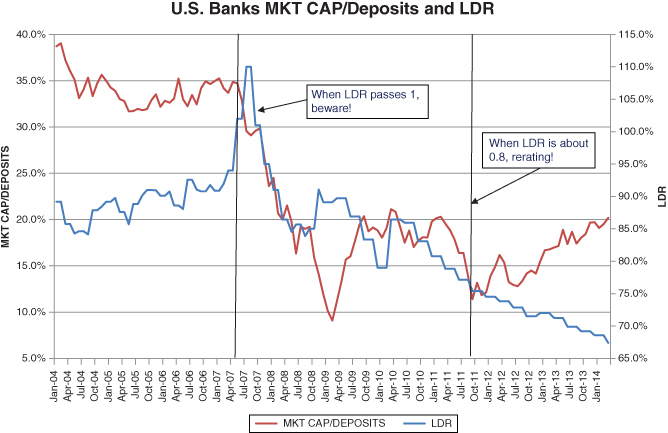
Figure 3.5 U.S. Banks Market Cap/Deposits and LDR: Turning a Corner for a Multiyear Credit Run?
During this time, bank stocks were doing what they do when the LDR breaches 1 and rises to 1.15–1.2: They fell, and fell hard. By early 2008, when many economists were still saying everything was all right, the LDR was peaking and bank stocks had fallen 30 percent to 35 percent for many banks. Then something strange happened, which is a hallmark of any financial crisis. Just before the worst of the damage hits, the LDR will have a spike. This is because many corporations will see trouble suddenly hitting and will start to feel like water is coming in over the deck. They all have standby facilities that banks are obligated to grant given certain conditions. Smart banks and corporations exhausted these facilities to gather liquidity before the real problems hit.
After these standby facilities are exhausted, companies are forced to act and the real pain starts. This is the balance sheet recession that my old colleague Richard Koo talks about. When individuals, corporations, and banks are all hit with an exhaustion of credit given the exhaustion of the domestic savings system, this is the time (and it is precisely the worst timing possible) when wholesale institutions reserve their right to pack up (literally) overnight and bring their money back home. The United States was no exception and endured a quality of pain similar to that experienced by the Thais and South Koreans in 1997.
At this time, all institutions that are entirely dependent on wholesale funding have an instant-death experience. In Thailand, it was a famous company called Finance One. Finance One in 1996 had one of the largest market caps of any financial institution in Asia and was a real estate darling of Thailand. It had not one cent of deposit liabilities and was completely funded from wholesale funding from banks. By 2009, it was no more. Anglo Irish Bank in Ireland was also a real estate darling and had few if any deposits. It was a foreign-funded bank. In 2008, it collapsed. In the United States, the victim of the withdrawal of wholesale funding was Fannie Mae. Fannie Mae was completely funded from mortgage-backed securities, many of which were bought by foreigners. It did not matter whether the portfolio was good, bad, or indifferent. The point here is that underlying property can only hold up if there is adequate liquidity (or funding or deposit liabilities, for they are all the same meaning). We can all have a view of value, and it is often said that beauty is in the eye of the beholder. But beauty and value are only as good as the liquidity that stands behind them. When that liquidity disappears (and wholesale liquidity disappears faster than any form), real estate values will fall apart, especially when the LDR is about 1.15–1.3. This situation happens over and over again, yet people never learn. We will see in the chapter on LDRs and asset values that there are uncanny relationships between property and the trends in the LDR.
In the case of the United States, the Federal Reserve was smart and stepped in to provide a new kind of “wholesale funding” that had never been tried before. It used its balance sheet to buy the mortgage-backed securities that foreigners were selling in order to prevent a complete meltdown in property prices. It backstopped Fannie Mae's balance sheet, which at the time was more than US$4 trillion. It owned more than one third of the U.S. housing market and was in danger of completely collapsing. The Treasury guaranteed the creditworthiness of Fannie Mae, and the Fed stepped in as a wholesale lender and backstopped the balance sheet. Federal deficits then exploded to the highest levels since World War II. We will see in the chapter on federal deficits and the LDR that the reduction and burn-off of the LDR down to about 0.8 is almost matched dollar for dollar in an increase in federal deficits. The fact that only a few governments globally restrict the LDR to 1 after myriad evidence of the damage to economies when the LDR exceeds about 1.15 is evidence of the folly of man.
Replicating the figures of the emerging markets above, the U.S. financial system collapsed from a value of market cap/deposits of $.35 to a low of about $.05. This tends to mark the low for a banking system, and the U.S. banks were no exception. This number of $.05 is not a special number, but it seems to be where the collapse stops and government intervenes to keep the ship from capsizing.
The United Kingdom
In the case of the United Kingdom, we again see in Figure 3.6 the same phenomenon with the trends in LDR and the way in which the peak and trough in the LDR virtually dictates a high degree of accuracy. In addition, the LDR trends are clearly a leading indicator of signs to come for banks and for economic activity. The LDR and tangible leverage are not on the radar screen of any modern school of economics, so we clearly conclude that economics do not tell us much about the effects of a balance sheet recession brought on by a banking crisis. Economics does not seem to give us any leading indicator of the problem, let alone any signs that the problem is worsening or ebbing.
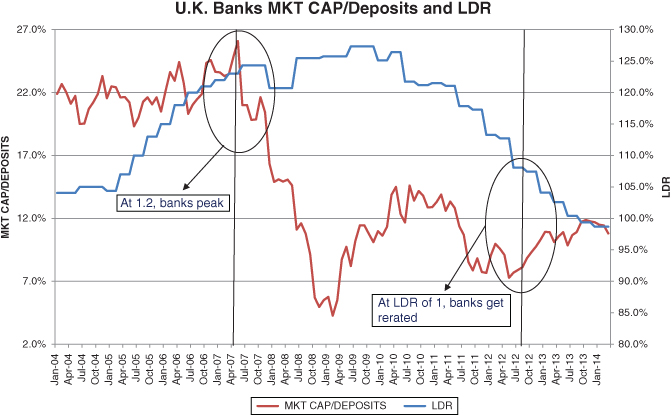
Figure 3.6 U.K. Banks Market Cap/Deposits and LDR: More Pain Ahead with Asset Sales and Deleveraging
Stop me if you have heard this one. The LDR in the United Kingdom peaked at 1.2 when the market cap/deposit of the banks was about $0.25/$1 of deposits. The U.K. banks were trading in a choppy manner prior to this event and were giving negative signals. There was a blowout for a few months when irrational exuberance got out of hand. The market cap/deposits indicator collapsed to about $.05/1 of deposits. There was a 100 percent rally from the $.05/$1 level to about $.1/$1 or so, and then the banks tended to retest the old lows. This happened within 24 months, and then the banks slowly crept along the bottom until the bank stocks sensed that the LDR was falling below 1. At that point, there had been extreme pain in the economy as banks shrank lending and people saved more. This dual process caused the banking system to reliquefy so that the banks could lend again. Economic activity could stir. Confidence could return. The government could stand back from economic activity and reduce deficits.
For all that to happen, the U.K. government had to come in and recapitalize the banks through nationalization. The government became the largest shareholder of RBS. In addition, the government had to pump the economy with deficit spending to compensate for an absolute shrinkage of credit. It had to create economic activity where there was an outright shrinkage of economic activity caused by a recession (a receding) of credit. This recession of credit is now commonly thought of as a balance sheet recession. I simply ask: Is there any other kind? The answer seems to be no. But since economics does not include credit in its calculations of counting economic activity, someone like the esteemed Rickard Koo of Nomura has to come along and develop a new name for something that has always been there as a root cause of economic downturns, but which was never counted. This is absurd but true.
We have seen these developments in the previous examples. I wanted to use the United Kingdom to bring home the point. It is all like clockwork, and there are few exceptions. In this way, the economic implosion of advanced economies like the United Kingdom or the United States in the 2000s was a carbon copy of the economic implosions of developing economies like Thailand or Indonesia in the 1990s. The Asian crisis and the global financial crisis were one and the same. It seems that the developing and developed world take turns bringing each other down because of the total absence of discipline or order in the wholesale market. One causes the other to have an LDR that explodes above 1 to 1.2 or 1.3 at the wrong time when asset prices are too high. Then that system implodes and rates collapse. This causes a boom in other parts of the world, and money in the part of the world that is on its back with a broken system goes to the other, healthy part of the world, causing asset prices to blow out by way of unrestrained wholesale lending, which causes the LDR to blow out to 1.2 or 1.3.
The Absurdity of Wholesale Lending: This Is a B-A-D Business
The complete willy-nilly movement of wholesale lending allows one part of the world to enjoy a good time through an asset bubble and unsustainable LDRs. This situation is brought on by other parts of the world with excess liquidity (given that they have a broken banking system), who dump their money into assets in a madcap and ill-thought-out strategy to make money. The absurd thing about wholesale funding is that, by its very nature, it comes in at the top of the market. People only ever need wholesale money from international banks when the domestic savings base has been exhausted and all of the assets within a domestic economy have already been bid up.
Wholesale banking is a bad business pure and simple. Look at the lumps that Standard Chartered has taken in South Korea from lending to the Republic of Korea in the 2000s, when the LDR was already tapped out and asset prices were already high. How does Standard Chartered expect to make money on lending into a red-hot economy when there is very little additional marginal leverage to drive up asset prices? Demand is one thing, but it is clearly leverage that drives up asset prices. We will see this in the chapter on the effects of leverage on property and currencies.