Chapter 1
A Few Simple Concepts That Anyone Can Understand
After 25 years of writing equity and fixed income research for a wide assortment of investment banks (Swiss, American, Dutch, Chinese, and Japanese), I became baffled by the way in which the vast majority of professional institutional investors who were my clients displayed a blind spot when it came to trends in credit. This is because they were fed volumes of analysis from economists who were almost all trained in the modern economics of the dynamic stochastic general equilibrium model. This is especially true for any economist who has worked for a central bank and then jumped ship to work for a bank. They assiduously look at inflation, valuations, capital formation, consumption trends, interbank rates, and the like.
This model adapted macroeconomics to microeconomics and tried first and foremost to discover where prices allow markets to clear from the point of view of the firm in a near-perfect world of pure competition. It assumed that all agents are identical. It assumed that markets are rational. It assumed that everyone is acting in their best interest and that this interest is best for all. It assumed that people essentially borrow from themselves.
There was no room for banking in this model. There was no room for Fannie Mae (which happens to control 50 percent of the mortgages in the country). There was no room for rationality. And as Nobel laureate Joseph Stiglitz pointed out, “Finance is uninteresting if the person can only borrow from himself… There can't be information asymmetries (apart from acute schizophrenia).”1 In other words, people do not borrow from themselves. They borrow from banks.
Alas, we are not the same. We are not rational. People do not behave the same way as a firm. Governments always create inefficient oligopolies that they can manipulate and control (i.e., telecom companies, defense contractors, banks, energy companies, port authorities, etc.). These oligopolies create distortions in wages, credit, growth, and the allocation of capital. Central banks are a great example of a government-manipulated oligopoly. And we borrow from others, often way too much.
The Error of Our Ways
So, we see that the model did not take into consideration credit excesses, the blind greed of bankers, irrationality, and behemoth mortgage entities like Fannie Mae. It did not take into consideration the many senior executives in banks who had no interest in the common welfare and were merely creating leverage in order to create revenue that they could turn into profits. It did not take into consideration the vast swell of frenzied irrationality that has persistently shown up in financial bubbles throughout history.
No wonder I was baffled in dealing with many economists who seemed blind to the dangers I saw coming over the horizon. I was looking at the world from the point of view of the banks and the financial system. Economists were looking at the world through the lens of income, output, inflation, and rationality. It was clear in my mind that the underlying capacity of a country's banking system to create credit is the cause of all the other variables mentioned above. These other variables are a mere outcome of the ability of governments and central banks to create credit.
This blind spot exhibited by so many money managers—and the erroneous information they received from the community of economists—made me wonder if I was wrong. And then I started to discuss the issue with very smart MBA students who had economics degrees. As I mentioned earlier, these discussions with economics majors in my MBA classes reinforced my suspicion that credit as a means for causing a structural shift in demand was absent not only from the formulas taught to economics majors but also from the investment process of most global investment houses.2
Why is this? It may come as a great surprise to many that, according to a recent paper by the IMF, “most (economic) models currently used for macroeconomic policy analysis…either exclude money or model money demand as entirely endogenous, thus precluding any causal role for reserves and money.”3 How can something as fundamental as the way in which credit and money interact be left out of economic models? This is a question that Joseph Stiglitz has been asking for the past several quarters. His point is that standard economic models provide a grossly insufficient model for anticipating credit crises because of “the lack of attention to credit and the institutions providing it.”4
To put a fine point on the failure of economics (in the crisis of 2008 and, in my experience, many other crises) because it ignored credit growth, Raghuram Rajan of the University of Chicago said:
The fault of the economics profession…was to ignore the plumbing. Economists could afford to do that…because the plumbing didn't back up. Now that the plumbing has backed up, you find that loans aren't really made in a pure, pristine market. Things can break down.5
The Mechanics of Economics
And things did break down. Let's boil down the problem to its fundamental parts and see what caused the breakdown. Economics is a study of how markets clear. It is the study of the scarce allocation of resources by seeking out theorems and proofs about how the price of goods and services relates to the quantity to be produced at a given price. This equilibrium price determines how supply of goods meets demand for the same goods. These inputs try to model income, demographics, technology, tastes, money supply, leading economic indicators, and such to predict supply and demand, and voilà! Here's the problem. These modern models that try to predict a clearing price for goods and services in an economy do not take into consideration the way in which credit affects demand.
The field of economics only took into consideration a small subset of conditions and dynamics that affect demand. As a result, there was a large blind spot, which has been causing a wild overshoot of demand—and a resulting slingshot of collapsing demand in the aftermath of a credit downturn. This is the so-called black swan event, which seems to “come out of nowhere” and happens once in a blue moon. In this book, we will show that these black swan events:
- Are predictable in that there are very definite and repeatable circumstances that can foretell credit crises
- Happen like clockwork, in that there is a time line in which the behavior of bankers (local and international) brings about a chain reaction of events that affects multiple asset prices with similar patterns
- Are a direct function of the credit cycle and have little to do with the concept of an economic cycle
- Can be seen a mile away if credit conditions are given “primus inter pares” status with other traditional economic indicators
As an example, bank stock prices are a pretty good indicator of problems to come, yet these have never been included in any model. Take the case of Citi. Its stock price peaked in 2005 and was falling a full two years before the crisis became a full-blown meltdown. Similarly, Lehman Brothers peaked in 2006 and was falling for 18 months before the implosion. No one was talking about that. The equity market was giving us a very good signal of the coming problems, yet none of this was factored into any economic model.
If the reader is still in disbelief that so many of these models that were designed to predict dangers in the economy did not even consider credit as a central parameter, let's look at the analysis of Bill White, the chief economist for the Bank of International Settlements. Considered the sanctum sanctorum (the Holy of Holies) of the international banking community, Mr. White makes the case loud and clear that the model used by the Federal Reserve does “not see debt as a source of danger.” He goes further with a savage comment and says that “in most of these models, debt isn't even there.” He takes a swipe at the academic community (which presumably includes the Chicago School) and says that “in academic models, the financial sector isn't even there.”6
The growing groupthink was that if the “important” people say that it is not there, it must not be important. And if it is not there, it can't do any harm. This is like a child who put his hands over his face. What he can't see because his hands are over his face is not there. It is dangerously naïve, but this description is absolutely accurate in my 25 years of experience of being inside banks. This is a classic example of Rule #1 in leadership: Don't walk into water over your head! The psychological weaknesses of the human mind are as important as the mathematical issues are when it comes to debt-fueled bubbles and all their destructive power. (Please see Chapter 8, in which we explore the psychological weaknesses of humans and why we seem to get suckered into all kinds of absurd financial bubbles over and over again.)
This is precisely why it was understandable for then–Fed Chairman Greenspan to have said that we are in a glorious and everlasting “Great Moderation.” However, he forgot to look at the explosive growth in mortgage debt, which was funded with highly volatile offshore funding from German Landesbanks, central banks, and other large institutions that could pull their money at a moment's notice. And they did.
Economic Blinders
If you still find it unfathomable why many of the economic and policy elite failed to see the crisis of 2008 coming (or for that matter the Asian crisis of 1997, the Russian default in 1998, the meltdown in Turkey in 1999, etc.), there is more evidence. Not only did major economists and policymakers not see the oncoming crisis, but also they did not detect the recession that was already underway in 2007. One study by the IMF, for instance, shows that not one official economic forecast anticipated a recession in 2009. Yet there were recessions in 49 countries in 2009—almost one in four countries in the world.7
In late 2007, there was even some noise from the Fed about inflation creeping back up. This is astonishing, since I was at Lehman Brothers in the Asian Research department and there was deep anxiety about the situation. By the end of 2007, anyone with half a brain in any investment bank knew the implications of the leverage unwind that was inevitable. In a book that he edited called Essays on the Great Depression, former Fed Chairman Bernanke said that the number-one cause of debt-fueled deflationary depressions is that policymakers do not understand or appreciate the very large levels of debt that lurk underneath an ostensibly healthy economy prior to the onset of the unpleasant deleveraging process. In this context, it is all the more surprising that he did not hit the five-alarm button to warn his colleagues of the coming problems.
By the middle of 2008, there was still a kind of delusional sense that we were out of the woods, and some in the Fed thought about actually raising interest rates just before the real collapse came a few months later. Some of the members were actually concerned about inflation. Dallas Fed Chairman Fisher was raising the alarm bells on inflation only a few months before the worst collapse in the banking system since the Great Depression in 1929.
The Greenbook, which came out in September 2008 when all the evidence of a coming meltdown was obvious, said growth in 2009 would be 2 percent and growth in 2010 would be 2.75 percent. This is all the more delusional when they could have picked up any research on credit from any of the Wall Street banks (including Lehman Brothers Credit Research, which was raising alarm bells all over the place) and seen that credit spreads were blowing out all over the place. They could have seen that (widely traded) credit default swap prices for auto loans, mortgages, corporate debt, high-yield debt, and commercial property had all collapsed to levels never before seen in modern financial history. Why didn't anyone at the Fed raise alarm bells on this?
To their credit, people like Governors Yellin, Bernanke, and Rosengarden thought that the economy could weaken more than people expected. But the overall consensus was for more growth and a possibility of inflation. Few if any thought of lowering rates below 2 percent in the summer of 2008.
Like a cup of scalding hot coffee being knocked off a table onto someone's lap, the financial crisis fell into the lap of the Fed with suddenness and pain. Fed Chairman Bernanke acted quickly by offering credit guarantees and the TARP program. By December—only three months after saying growth in 2009 would be 2 percent—the Fed Greenbook forecast a collapse in growth of 4.7 percent for 2009. All along policymakers consistently underestimated the pernicious effect of deleveraging throughout the economy. Banks had to call in loans for homes, cars, commercial office buildings, and businesses. Without liquidity and leverage, the economy could no nothing else but shrink.
Again, what is the core intellectual blind spot that caused all and sundry to get it wrong? Modern economics looks to a supply-and-demand curve that explains how markets clear at a certain price. They have as an assumption that credit (the right amount of credit for all occasions, by the way) is just there. Markets will clear because they are rational. But they do not take into account the fundamental notion that virtually all important choices in human life (when to marry, buy a home, go on vacation, go to university, expand a business, go to the hospital, have children) are predicated on the availability of credit. How can economics just leave this out? For decades, the science of economics has treated financial markets as a “harmless sideshow.”8 MIT economist Olivier Blanchard said, “We thought of financial regulation as outside the macroeconomic framework.”9
The Corporate Example
Credit creation can make or break the balance sheet of the corporate sector and, therefore, the income statement. We should call the income statement the “outcome” statement, as it is a derivative of underlying trends in credit. In this way, the price-to-earnings ratio (P/E) and earnings per share (EPS) of a stock are meaningless and tell us nothing (we will see later that they may be a contra-indicator for investment timing and cause people to lose money!). To focus on earnings and EPS without an eye on credit and the way that credit affects national liquidity and the balance sheet of a company is to miss the big picture. Furthermore, focusing on GDP data, money supply, leading economic indicators, and fiscal positions is a waste of time without proper attention to the extent to which an economy is stretched too thin when it comes to the availability of credit and the savings that funds that credit.
People borrow from a banking system whose capacity to lend is determined by how much these same people save. People go to banks to borrow their savings. Corporations do the same thing. Borrowings are loans (assets of a bank) and savings are deposits (liabilities of a bank). The savings of people and corporations create credit, and credit creates money supply. The ratio of bank loans to deposits (or savings) is the loan/deposit ratio (LDR). This can reach a low of 0.5 ($50 of loans for $100 of deposits) or so. This is the beginning of a credit cycle that makes for glorious asset price appreciation for a considerable period of time, usually for four to six years.
A country that has its foot on the accelerator and is allowing credit growth to far exceed savings growth is running large current account surpluses. Domestic liquidity is sloshing around at an accelerating rate. This country can gun the engine of growth with credit up to an LDR of about 1.1 or 1.2 until they encounter trouble because the growth in credit has far exceeded the growth in savings. Examples today of highly liquid banking systems are the Philippines, Thailand, Indonesia, Singapore, Hong Kong, China, and much of Africa.
When countries have low LDRs (and accompanying current account surpluses), it is hard for companies to lose money because there is plentiful future credit available. This is the same thing as saying that savings can easily be turned into loans. These loans can in turn become more deposits and a virtuous cycle occurs, as long as central banks prevent sudden spikes in credit growth.
When this happens, foreign wholesale lenders want to get in on the act and fill the gap as domestic savings are exhausted and a country is required to look for overseas borrowers to keep the party going. Bankers inside a country see foreign money as “other people's money.” Foreign bankers see a country that is liquid as a “low risk, easy pickings” lending spot. The combination of these two characteristics creates circumstances in which domestic bankers look to exploit “dumb” foreign money (joint ventures) and foreign creditors (capital inflows) are looking to “make a killing” in a credit-rich environment. This creates a boom. This is the same thing as saying that capital inflows from international banking sources are pro-cyclical.
These foreign bankers make good developments really good—and they make adverse developments become really bad. These international flows are not a balancing mechanism. Rather, they are steroids for an aging athlete, because international money, when it comes in, usually arrives late in the game when the cycle is aging. We will see that it allows for an unnatural extension of a cycle.
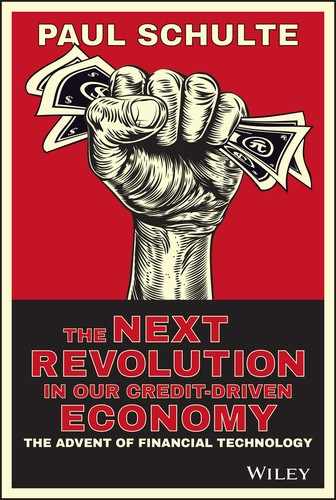
When this happens, stock markets will tend to have good rallies and housing prices begin their rise. Politicians can do no wrong in this kind of environment. When savings has been consumed through borrowings, the loan/deposit ratio is 1 ($100 of deposits has been turned into $100 of loans). The current account is almost always in balance (by definition). Figure 1.1 explains the idea. It shows a line of best fit in a snapshot of the world just after the crisis. The United States is at the upper left, since we included the government-sponsored enterprises (GSEs) in the total LDR. This is something economics forgot about.
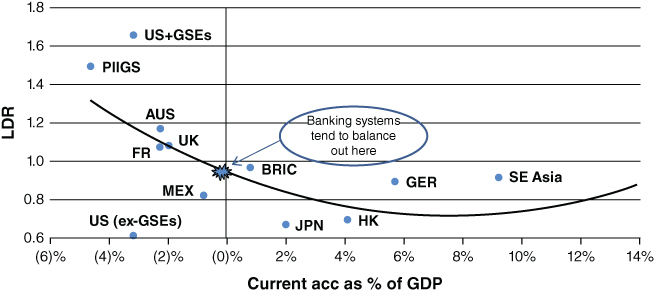
Figure 1.1 Global Credit System in 2010: United States Deleveraged and BRIC (Brazil, Russia, India, China) Releveraged
Source: China Construction Bank
The GSEs (Fannie Mae and Freddie Mac) were not funded by deposits, but by mortgage-backed securities, some of which were issued to overseas financial institutions (mostly foreign central banks). This caused a massive mismatch of assets and liabilities in the housing market. And this was the stealth rise in the LDR, which at its peak rose to above 115. In this case, central banks were the “foreign banks” that were lending to the United States in a way that aggravated the upside rise of asset prices. The situation suited them because they needed to buy dollar assets in order to keep their currencies undervalued and export cheap goods for Pier One Imports and Walmart stores in the United States.
Painful Reality
Another example was the countries of Southern Europe. Being used to rates above 10% for years, they were all forced to bring their rate structures to 3% to match Germany when they entered the European Union. So their LDRs shot up spectacularly since these countries could now get money in a sudden “half-off” sale. So the LDRs went to dangerous levels, far surpassing the usual danger zone of 1.2–1.3. At the worst, they went to 1.8. No wonder the depression in southern Europe (and subsequent unemployment rates of 50 percent for youth) was so severe.
The important point in Figure 1.1 is that the line of best fit finds its way through the Y-axis at exactly 1 while the X-axis is at 0. The natural resting place of credit is an LDR of 1 and a current balance of zero. This is a country that does not borrow from anyone else and that has deployed its entire savings into loans. It is a self-contained world that funds itself and is not reliant on or a slave to fickle and flighty wholesale funding from foreign banks who can leave tomorrow at 9:00 A.M. if they so please. This may sound like pie-in-the-sky thinking, but I think there is a groundswell of activity among regulators to: (a) restrict the absolute LDR level to below 1; (b) restrict the amount of lending a bank can do to its capacity to raise deposit liabilities in the country (subsidiarization); (c) restrict the amount of funds to be used in leveraged mortgage activity; and (d) force banks to capitalize in-country and not allow the capital to leave for an extended period of time. Does this sound like capital controls? It is absolutely not. It is called prudent banking policy.
As this LDR approaches 1, liquidity tightens a bit and there is a tendency to see rates getting tight and rising slightly. We will see later that many central banks are catching on to this phenomenon and are now capping their own country's LDR to 1. There is always a tendency to increase the LDR in any way for one simple reason. It seems to be a human trait that “more is better than less.” And as things get going in a boom (as the LDR climbs toward 1 and credit is being deployed to make asset prices increase), no one wants to stop the party. Humans seem to favor chance over prudence. We all love to live on a chance. Credit fuels this tendency.
The opposing force here is central banks and governments who are—one by one—imposing a cap of 1 on the LDR. Examples of this are South Korea, Hong Kong, Singapore, and China. This is not autarky, and it is not a form of capital controls; it is prudence. At this point, however, bankers have had the bright idea to escape these lending caps and try to borrow from other countries that have excess savings. Then the local loan/deposit ratio can go to 1.1 or 1.2 or, as in the case of Spain before it blew up in 2008, a staggering 1.7 at the peak. This means that Spain was borrowing 50 percent more offshore than it had locally through its banking system. It should come as no surprise that, at the time, Spain was using one tonne of cement for every man woman and child for real estate development. On a per-capita basis, this was more than a third larger than China and multiples larger than the United States, Japan, or Korea. (No one was asking any questions.)* Australia and Brazil are current examples of countries whose LDRs are 1.2–1.3 and that are now encountering trouble with growth as their savings pool is tapped out. Australia has a better history of prudential regulation, while Brazil is getting deeper into the red. How on earth will it pay for the Olympics? The current troubles with Petrobras, the Brazilian national oil company, are symptomatic of the excessive dollar borrowing. Petrobras has USD 91 bn of dollar debt, two times larger than the average dollar debt of the seven largest oil companies.
Incidentally, similar LDR numbers of 1.2–1.4 were seen in Thailand in 1997 prior to the crisis and Turkey in 1999 (before it blew up). The United States and Ireland also shared a similar situation in 2007. How come people never learn? An LDR of 1.2–1.4 is usually the endgame for a country, since this is where we tend to see ratings downgrades, financial scandals, excessive greed, and foreign banks that, as usual, react as lemmings and pull their money at the same time.
If the presence of credit can change our decision-making process for weddings, homes, and universities for our children, then the absence of credit can also have catastrophic consequences for basic life decisions. Why do governments over and over again allow wholesale banking (excessive foreign borrowing by domestic banks) to derail an economy and wreck millions of lives? Why don't they use simple regulatory guidelines to extend a cycle by moderating numbers like the LDR? Why do we never hear about these simple criteria in the discussions on Bank of International Settlements (BIS) rules designed to keep the banking system afloat and healthy?
How Political Chaos Is Created from Runaway Greed
Governments have a clear incentive to do this because we will show that governments that end up with banking systems that overheat with LDRs of 1.4 almost invariably are kicked out of power when the financial system finally overheats and blows up. Or they are forced to implement violent tactics and implement various forms of martial law in order to stay in power. Furthermore, chaotic political change has a tendency to slip into civil war or wars with neighbors. Politicians, bankers, and central banks allow this devolution into chaos to happen over and over again because they refuse to create a few simple rules of the road to manage the credit cycle.
David Shambaugh talked about this in his interesting book, China's Communist Party. He shows that one of the major reasons for the fall of the Soviet Union was the collapse of the financial system.10 (See the accompanying PowerPoint documents, which summarize Shambaugh's thinking on this topic on the Wiley website). Banking systems that turn insolvent invite economic stagnation. In turn, budget deficits are created to accommodate the financial system as it tries to right the boat. Societal issues are impacted, such as when unemployment rises. Governments do not have room for extravagant subsidies and people become angry as the quality of life dwindles. Life becomes harder and there are fewer opportunities. When young people do not see a way out of their unemployment, they can turn to religion for comfort and they simultaneously abandon political parties. The rise in the Religious Right in the United States is a very understandable phenomenon in this regard. Another example is of the Brazilian financial system, which has been stuck in recession given that its LDR is 1.30 and there is just no credit left to distribute. There has been a large movement in evangelical Christianity in the country as young people give up hope of any progression in society. This is being exacerbated by the collapse of the Brazilian oil company Petrobras, whose shares have plunged more than 75% in 2013–14.
Let's get a sense of this cycle in historical terms to see just how long it takes to turn off (and then reduce) the excess leverage once the LDR gets to catastrophic levels of 1.3–1.4. Let's take a look at the timeline for the Asian crisis. The LDR of the Far East peaked in 1997 at 1.25 (The U.S. LDR peaked in 2007 at 1.16 and the U.K. LDR peaked in 2007 at about 1.2. The pattern repeats itself over and over again.) It took many years for the LDR to get back down to safe levels of around .75. In the case of Asia, it took about seven years. In the case of the United States, it also took about seven years. In the case of Europe, banks are a very big part of the economy, and southern Europe reached extremes that are almost unsurpassed in modern times. We put GIIPS (the five countries of southern Europe—Greece, Italy, Portugal, and Spain—plus Ireland) on Figure 1.2. We can see that the credit excesses of these countries make the Asian crisis pale in comparison.

Figure 1.2 GIIPS LDR: Deleveraging Process of GIIPS More Severe Than Asia in 1997
Source: China Construction Bank
The trends in loan/deposit ratios need to be put into a global context because this folly we call wholesale banking is a global redistribution of money in which countries with low LDRs (China in 2005) can lend money to countries with high and unsustainable LDRs like the United States or Spain in 2006. Asset prices of the lenders will almost always do better than the asset prices of the borrowers, especially when the LDR is in the area of 1.2 to 1.4 (i.e., when the party really starts going and the “hard stuff” is brought out just before the crashing hangover).
Indeed, it is a perverse phenomenon that asset prices seem to accelerate faster between an LDR of about 1 to 1.3. This is usually a time when sane investors who understand credit would become alarmed and sell, probably too early. Asset markets seem to be happy to ride the tiger of wholesale bank funding from overseas fickle financiers, often without realizing they are driving at full speed toward the canyon of exhausted credit. The ride from an LDR of 1.0 to 1.2 tends to be glorious. But the ride from 1.2 to 1.4 is disastrous. Why governments—for their own sake, and one would think more importantly, for the sake of their people—do not step in and restrict excessive wholesale borrowing is a staggering mystery.
Tangible Leverage Is the Other Vitally Important Factor
On top of this, there is one other simple number we will look at and that is tangible leverage. Tangible leverage is simply assets minus intangibles divided by capital minus intangibles. Intangibles usually arise when banks make an acquisition and have to put the value of the bank above and beyond the cash price on the balance sheet. The actual value of this “intangible asset” is zero and is usually a high number when a bank paid too high a price for another institution. You cannot buy a cup of coffee with an intangible asset—it is a filler. For instance, Deutsche bank has a great deal of intangible value because of its acquisitions over the years. These tangible leverage levels can range from low and healthy levels like 10× (a healthy $10 of capital for $100 of assets) for Thai banks and Indonesian banks in 2013 to the Swiss bank in 2008 at 50× (a suicidal $2 of capital for $100 of assets).
When a country's loan/deposit ratio is at 1.3× and the tangible leverage is at 30–40, I submit (and will prove it) that corporate earnings do not matter one whit. The stock market will be doomed and all stocks will fall, with better companies outperforming the worse ones. Few will see positive stock price movements. When the banking system cracks at levels of 1.3× on the LDR and 30–40× on tangible leverage, everything will be damaged as the deleveraging process unwinds. It gets very ugly, indeed.
When a country has a high LDR of 1.3 or so and tangible leverage north of 30–40×, the fuse has been lit and the macroeconomic explosion is only a few months away. Governments in these countries will be out of power within 24 months or so of the explosion of the banking system. Banking systems like those in Indonesia with a low level of leverage and low LDRs have a free ride for a considerable period of time. In fact, the deleveraging of Western banks had an effect of speeding up the deployment of leverage in places like Indonesia (for the simple reason that Western countries had to lower rates to zero and Asian countries with linked dollar exchange rates were forced to accept lower rates). The politicians in these countries can do no wrong. President Yudhoyono of Indonesia has been riding a virtuous wave of credit growth. But their wave may be cresting about now, seven years after the global financial crisis.
While the LDR for the West was at an unsustainable level of 1.2, the tangible leverage for the West was at a dangerous level of around 30. We showed earlier that the solution to a lower LDR was either lower loans (default, liquidation, or inability to renew loan agreements, all of which are painful) or raise deposits (save more or spend less, both of which involve painful decisions). There are no good solutions for banks or people when the LDR comes down. The reduction in the LDR is more of a public event between the bank and the public. The bank must force pain on the public by forcing property prices to fall. It must force pain on the public by repossessing cars, houses, jewelry, vacation condos, and other valuables.
The public must do something that is very difficult. It must force an increase in savings just to stay even. Costs must be cut with no discernible benefit. This involves great pain, including pulling children out of good schools that their parents can no longer afford. It requires cancellation of credit cards, postponement of vacations, willingness to accept humiliating unemployment benefits, cancellation of health clubs, and a general lowering of the lifestyle to which one has become accustomed. It may even cause a couple to decide not to have a child. These decisions cause embarrassment, loss of face, and sometimes outright poverty. Hence, we often see the wrath of voters who throw out any government that contributed to the banking crisis. They also have second thoughts about traditional political party affiliations. Alternative parties (often extreme) gather interest to vent the rage of people who see themselves slipping backward helplessly with no hope of regaining the old wealth.
When Debt Becomes a Dirty and Dangerous Word
The solution to a lower tangible leverage is slightly different but also requires painful solutions. It is a shared pain between bank managers and shareholders. And it often requires secret deals between the government and the bank. These deals often involve sweetheart deals, corruption, criminality, and the illicit use of public funds to bail out what is considered a “systemically important” institution. Lowering assets means reducing loan books by turning away past customers, writing off bad debt, shuttering a loan book for new customers, adding more low-returning cash, or liquidating securities holdings. These are all bad choices because they involve a very dangerous phenomenon we do not often see, and that is an outright shrinkage of debt.
Shrinking debt is very dangerous for a society because it involves deflation. Deflation causes asset values to fall and the real value of debt to rise, so people incur higher debt payments in real terms as their home value falls and their income falls. In response, they spend less. Deflation causes wages to fall, so people feel less safe and spend less. Deflation builds up expectation of falling prices, so people delay purchases and spend less. If deflation is allowed to take root, it becomes a phenomenon like in Japan in the last few years, and people keep on saving more and spending less and saving more and spending less. A sense develops that prices will always be lower tomorrow, so there is no need to hurry and buy anything. The only economic actor remains the government. This is very dangerous, as it leads to a buildup of debt that requires low interest rates to service. Low interest rates create an incentive for governments to generate low levels of growth and implement policies, knowingly or not, that reinforce deflation.
So governments are faced with the problem as identified in Figure 1.3. If tangible leverage is to fall to avoid an economic collapse, governments need to prevent a violent shrinkage of the loan book (assets) in the midst of a crisis. They must also prevent the capital base from getting too small. So, they need to do two things. They need to renew confidence and find buyers for more capital for the bank. This is complicated by one important factor. In the midst of a crisis, loans on the book are going bad because, ironically, the banks have stopped lending to their customers to repay debt (is the world anything other than an ever-greening of old loans by new debt?). When this debt starts to go bad, it must be written off the balance sheet. At the height of most crises, about 8 percent to 10 percent of a bank's balance sheet needs to be written off. This must be written off against capital. So, while the bank managers, shareholders, and government officials are huddling to find new capital, the capital itself is shrinking due to losses from bad loans.
Figure 1.3 Methods to Decrease Leverage: Sell Assets or Increase Equity—Both Are Painful
Source: Nomura
Figure 1.3 shows the gargantuan problem that was staring policymakers in the face back in 2009. Global leverage at the time was about 30× (of course, leverage should never have been allowed to get this high, but that is a discussion for a later chapter). This means banks had about $100 of assets and about $3 of capital. This was a buffer to cover losses of 3 percent—not the 8–10 percent that was to come down the pike as the crisis really got going. So, the system had to be backstopped. If the dam was about to break, a stronger and higher dam needed to be constructed quickly or the system would stop functioning. Figure 1.3 shows just how big the “new” dam needed to be if the world was going to keep functioning.
It was apparent that the world needed to see leverage fall to a minimum of 20 in order to become sustainable again. There is a simple formula: Assets have to fall and/or capital needs to rise. There is no other way to do this. It needed to happen quickly, and it needed to happen in the midst of large losses from the write-off of incrementally new bad debt. So, the math was simple. We pick two levels of leverage. One is 20× and the other is 15×. As it turns out, the United States chose a far more painful route and got its leverage below 15×.
Europe is taking its time and does not have the political will (or structure) to implement quick and painful measures. In the case of the global banking structure, we can see that getting to leverage of 20× (the left axis) requires that banks find about $600 billion. Hence, banks like Deutsche Bank, BNP Paribas, and Société Générale have high leverage seven years into the crisis. In fact, in the first half of 2014, the asset size of Deutsche Bank is above the level of 2009.
Indeed, the United States was able to bring down leverage quickly through the TARP program provided by the U.S. federal government. This was smart, but it was one of the major reasons that the Republicans lost the White House and the Senate in 2008.** European banks have not been able to get this capital either from the federal governments or from the European Central Bank (ECB); it took another route. On the right axis, we can see the reduction of debt needed to reduce leverage. The ECB did a smart thing by not taking this debt on its balance sheet (which would be against the law). Instead, it guaranteed trillions of dollars of this debt and allowed it to remain on the balance sheet of banks throughout Europe. So, the United States chose to recapitalize the banks and write off bad debt. And the European banks chose to attack the problem by way of the assets. In the midst of this extreme pain, every major government in Europe was brought down (except Germany, which still holds the purse strings).
European Bank Woes
The U.K. government took a midpoint solution. It nationalized the Royal Bank of Scotland (RBS) and took an 80 percent stake in the bank after its collapse. It forced RBS to close many businesses and shrink its balance sheet. It has had a strong voice in the background of Barclays and has been using moral suasion to get Barclays to give up on its unprofitable investment banking business (Barclays balance sheet is still one of the largest globally, and years of painful deleveraging are ahead.)
The crippling torpedo to the U.K. economy came from the real estate lender Northern Rock. It was mostly funded from wholesale borrowing. The cost of the collapse of Northern Rock to the U.K. people was a whopping 6 points of government debt as a percent of gross domestic product (GDP). This equates to tens of billions of dollars in government bailout funds (which caused the Labour Party to lose to the Tory party in a devastating electoral defeat). All too often, the general public concludes that the government is in bed with the “banksters” and does not care about the “little people.” They take the view that the interest of a small and incompetent elite pay off the government for private favors. This opinion spreads not only to the federal government (parliaments and congresses) but also to the central bank. The bankers get bailed out for being reckless. They keep their wealth. And the middle class ends up paying higher taxes. They feel like they are subsidizing reckless behavior, poor risk management, and outright corruption as the increasing debt level in Figure 1.4 shows. It is no surprise that governments fall after they support bailouts.

Figure 1.4 U.S. and U.K. Public Debt: Government Debt Levels Rose Precisely to Bail Out the Banks
Source: Nomura
Ken Rogoff's book, This Time Is Different, is valuable because he articulates a very important point.11 His extensive research shows that each time there is a financial crisis, government debt/GDP rises by an average of 50 points of GDP. This matches my research, but as we will see, there are extremes where a much higher LDR of 1.5 to 1.7 will cause an inordinately large increase in debt/GDP. On average the LDR of a country in a banking crisis will get to 1.2 and then snap back to about 0.75, with a resulting rise in government debt/GDP of about 50 points.
So, this sharp rise in government debt, nationalization, moral suasion—and very substantial increases in central bank purchases of government debt to keep rates down—have all contributed to a midway solution to the problem. The U.K. government would like to exit the RBS ownership with a profit, but this remains to be seen.
Following the Numbers
We will also notice that there is a kind of natural resting place historically for banks. We showed that from the point of view of “liquidity,” the natural resting place for the LDR was 1.0. Historically, there is also a resting place for leverage. In our statistical work, there is a place where the stock prices of banks continue to peak and fall, and that is tangible leverage of around 20×. After a bank reaches 20× in its tangible leverage, the stock price seems to fall. The market sniffs out trouble and sees that every incremental dollar of income with leverage above 20 is not worth the risk. That said, the summary of this chapter can be seen in Figure 1.5. Consider it as a snapshot of 2012.

Figure 1.5 Return on Equity and Tangible Leverage: The Rule of 1 and 20: Maximum LDR of 1 and Tangible Leverage of 20
Source: China Construction Bank
Interestingly, Deutsche Bank has been one of the worst performing banks globally, as it has been forced to roll back leverage and raise capital. It has made great progress getting its leverage back to a safer level in the 20s compared to suicidal leverage of almost 50 in 2008. But that means it has had to reduce assets (surrender businesses, shrink loans, retreat from geographical regions) or increase capital (have very expensive rights issues that irritate shareholders). Its capital increase in mid-2014 was a rights issue that alienated investors.
Barclays, too, is in the same boat and has been a terrible performer, as it has tried to cut costs and reduce leverage. It has been forced to essentially give up its investment banking business and reduce its geographical presence. Additionally, both banks (and many others) have tried to make up for lost revenue by engaging in questionable business lines for which they have been forced to pay significant penalties to regulators and prosecutors. These questionable business lines include fraud, high-frequency trading (which is tantamount to front running), tax evasion, smuggling, trading with the enemy, and many other felonious activities. In 2015, John McFarlane will assume the reins at Barclays and very likely take a knife to many divisions. McFarlane was chairman of Aviva when it was in crisis. He closed divisions, fired top management, suspended bonuses, and implemented a housecleaning from top to bottom. The same thing will happen to Barclays, and it is likely a foretaste of things to come for many global universal banks.