Chapter 7
How Bankers and Policy Rescuers Affect Stocks, Foreign Exchange, and Property
Do banks really have that much of an effect on asset prices given the other forms of credit? The answer, of course, is yes. Look at Figure 7.1. We saw this in a previous chapter and it is a vital chart for understanding the investment cycle. Global liquidity is like the phenomenon of high and low tides. There is never more or less water in the world in any one day; it is just that the moon's location affects the water. When the moon is passing over Asia, water levels in Asia are pulled up by the moon's gravitational force. Water levels in the Atlantic Ocean on the other side of the Earth are pushed lower.
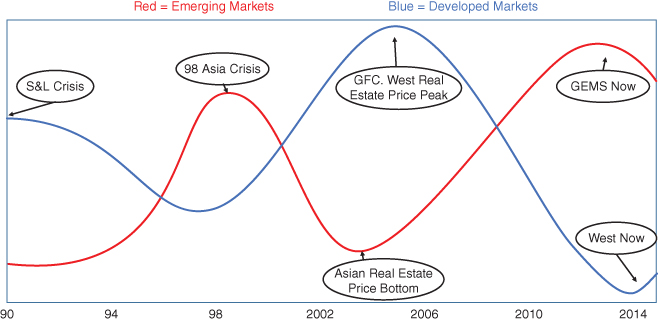
Figure 7.1 Western and Eastern LDR Movements (1990–2014): Uncapped LDRs Create Massive Instability
Figure 7.1 is a vital chart that shows this effect. Right now in 2015, rates in the West are zero, and there is an extreme low tide of credit. The Western countries are together experiencing a deleveraging of balance sheets, which is necessary to correct the extreme and unsustainable imbalances caused by the global financial crisis. Some countries in the West are moving back to normalcy more quickly than others. In general, however, here is an extreme low tide underpinned by zero rates, which are necessary to help banks and businesses have wider spreads between cost of funds and returns on assets. As we mentioned earlier, equilibrium is achieved by a falling loan/deposit ratio (LDR), which can get to about 0.8, and a falling leverage level, which can get to about 12–14.
At the same time, Asian and other emerging markets are having a high tide because their currencies are tied to the U.S. dollar and their banking systems are healthy. As a result, they are receiving inappropriately low interest rates. Their rates need to correspond to U.S. dollar–based rates or their currencies would rise rapidly in value. With low rates and a liquid banking system with low leverage, they have been on a bonanza; their LDRs are rising from 0.8 to 1, and their leverage levels are rising from 13–14 times to 17–19 times. Australia, a case in point, has seen a large increase in leverage and a very high LDR of 1.2. As can be seen in Figure 7.2, Australia is a classic example, compared against Spain. As Spain collapsed in both LDR and leverage levels, Australia has risen. In turn, Australian property prices have risen by about 50 percent since 2008, and Spain's property prices have fallen by about 50 percent.
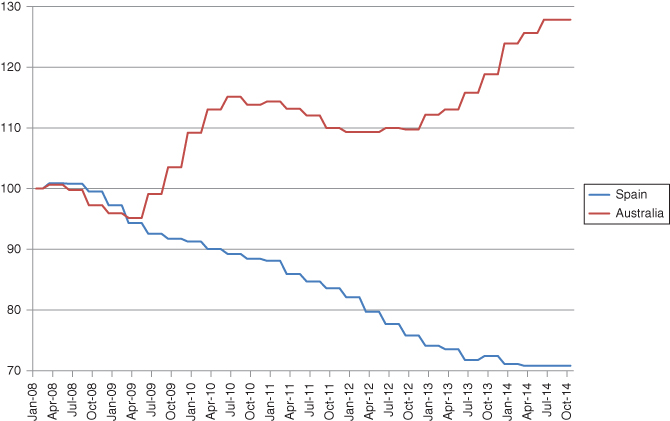
Figure 7.2 Spanish and Australian House Prices: High Australian LDR in Funded Boom while Falling LDR in Spain Caused Falling Prices
Spain's prices fell off a cliff as the LDR fell back to 1 from 1.7. This meant that Spanish banks were closing out loans and writing off bad debt while Spanish savers had to increase savings and forgo luxury activities, as well as watch property prices dive. In this environment, rates in Europe and the United States had to be cut to accommodate the pain. As this happened, Australian rates also fell, since the Australian dollar is very much tied to the euro and the U.S. dollar. So as rates were cut, Australian banks had a chance to increase leverage and keep the LDR high. Leverage for the banks went from 15 in 2008 to 21 by 2014. Subsequently, housing prices rose substantially.
At this point in the cycle, Australian prices are among the most expensive globally, and Spanish prices are very cheap. An average apartment in Barcelona or Madrid is about half of the price of an apartment in Sydney or Melbourne. Many Chinese entrepreneurs are wandering around Spain now, buying up properties. At the same time, they are lightening up on Australian properties. The differential between Australian and Spanish prices is becoming irresistible, so we may be seeing a moving of the low tides toward Australia and the high tides toward Spain. At this point, I am much more of a buyer of Spanish property than Australian property; the same goes for banks as well. As we shall see, property and banks tend to move together, but the banks tend to move 6 months or so in advance of property—on the way down and the way up.
Similarly, China has had a polar opposite experience compared to the United States in the past few years. Figure 7.3 shows the powerful advance in Chinese property while U.S. property prices collapsed. This is exactly what one should expect. While the average prices of U.S. houses fell 30 percent and have only been recovering recently, the average prices of Chinese homes are up 30 percent. In fact, they are up much more than this in cities such as Beijing, Shanghai, Guangzhou, and Shenzhen. This is because China had a liquid and functioning banking system in 2008, which was then given zero rates. We cannot forget that more than 70 percent of China's total trade is with the United States, so the currency is, for all intents and purposes, linked to the U.S. dollar. I have heard very solid bank portfolio managers say that China is the 13th district of the Federal Reserve.

Figure 7.3 Chinese and U.S. House Prices: Rising PRC Leverage Created Price Boom; Falling U.S. LDR Caused Fall
As with Spain and Australia, I would rather own U.S. property than Chinese property now. This is not because China's property sector is about to crash. This kind of thinking is muddled, in my view. The point is that I think the currency has peaked. In this sense, a big move in the Chinese yuan renminbi (CNY) for the Chinese—who have been able to amass large amounts of wealth—means that the world is very likely not going to get any less cheap.
My argument is that the government does not want to see the CNY strengthen beyond 5 to the U.S. dollar. So the government will, over the course of the next few years, accelerate capital outflows, and real estate around the world will appear absurdly cheap compared to the stratospheric levels of prices in Beijing and Shanghai. Think about being able to buy 8 or 9 apartments in Barcelona for the price of just one apartment in Shanghai. The same is true for Los Angeles, even for houses near the beach. A nice apartment in Santa Monica with a view of the ocean is still a fraction of the price of an apartment in an upscale neighborhood in Beijing or Shanghai. Plus, there is a sense in which property acts as a store of value for Asians that is not apparent to Western economics. This is historical in nature, but many Chinese people prefer property over investment any time. In addition, mainland Chinese have had a terrible experience with their own stock (it is down 60 percent from the top) market but have managed to make fortunes in property. As a result, they will go with what they know and have had good luck pursuing.
Figure 7.4 is a favorite of mine because it shows very nicely how the financial system works. The countries with the high tide discussed above are the ones that are moving from the bottom left to the top right. The countries with a low tide need to have low rates to accommodate a drop in the LDR through painful deleveraging.

Figure 7.4 Schulte Bank Valuation Model: Uncontrolled LDRs Cause Constant Cycles of Instability
This really shows the theme of my book in terms of price action. The X-axis is a pure valuation parameter that cuts out all the noise of intangibles, capital structure, and other cost structures. When we get down to the pure essence of what a bank's value is, we can reduce it to the faith of a depositor who places his cash in that bank that the cash will be available on the next day at 100 cents on the dollar. The ultimate value of a bank lies in its deposit franchise. The value of a bank does not lie in its ability to raise vast amounts of long-term debt from capital markets. Therefore, that is the denominator of the number of the X-axis. The numerator is market cap. This is purely the value that Mr. Market places on the bank today. As we have demonstrated amply in this book, the stock prices of banks are a smarter beast than other stocks, in my opinion. They have an uncanny way of sniffing out problems several quarters before the problems arise. So, market cap/deposits as a way to get to the pure essence of a bank's franchise value and the value that the market (the stock price) places on this is an excellent way to look at banks.
We see a world where the market cap/deposits goes round and round in a cycle. I submit that any economic model must be built around credit indicators like this, or these economic models have absolutely no value whatsoever. (This is the main lesson of the global financial crisis and so many other crises that economists have completely missed.) The market cap/deposits for the banks usually go to a high of about 30 percent (or 30 cents of market cap for every dollar of deposits) at the top of a cycle. This is simply doing an aggregate of market cap for all publicly traded bank stocks and looking at it against all deposits for the banks (these numbers are easily retrievable from any number of websites). It corresponds to a bank passing through a peak of 1 on the LDR. After this, bank stocks will fall, since Mr. Market realizes that the use of wholesale funding is more risky than using deposits to fund loan growth. After this, market cap/deposit will glide down to about 20 percent and hold there. When a full-blown crisis starts, the LDR is usually about 1.2–1.3 for a period of time that could range from 12 to 18 months. This is the peak of asset prices (property and currency values included). Prior to the crisis hitting in a full-blown way, stocks will have another leg down and hover at about 15 percent of deposits.
When the banking crisis hits and credit stops, what is generally intensifying the crisis is the sudden withdrawal of wholesale funding from banks that are scared out of a country because these bankers observe credit downgrades from ratings agencies, isolated defaults, falling property prices, or a weakening of the currency. In general, though, we harken back to the immortal words of John Maynard Keynes. Bankers, he says, are always ruined together. They are “ruined in a conventional and orthodox way along with their fellows, so that no one can really blame them.”* In other words, bankers almost always go over the cliff together. Thus has it always been.
At the peak of a financial crisis, investors should watch these market cap/deposit numbers like a hawk. These numbers will tend to collapse to 5 percent to 7 percent at the peak of a crisis, when the panic is at its most extreme. At this point, it is probably prudent for investors to start bottom fishing. Politicians at this point are dragged into a rescue because they are presented with a fait accompli by bankers, which goes like this: The banking system is collapsing. All credit will stop soon. Social disorder will take over if you do not step in and do something. Politicians on the right (call them the Austrians) will say that a cleansing is “long overdue” and banks that extended themselves too much need to shut. Politicians on the left (call them the Keynesians) will say that fiscal deficits are needed to provide some boost to the middle class as unemployment rises. Thus is the debate we have seen for a century. I submit it is all noise, since the banks will not function again until bad assets are pushed overboard. LDRs need to adjust downwards from 1.3 or so to .85 or so, and tangible leverage needs to adjust downwards from 30× or so to 15×. The laws of gravity of financial systems are such that whether you use a mix of Austrian or Keynesian economics, a recovery will not come about until liquidity has been restored to the banking system. So, why is the banking system left out of the economic modeling of cycles? It beggars the imagination. Furthermore, we saw in the previous chapter that Keynesian deficit spending is nothing other than foam on the tarmac as the damaged economic airplane comes in for a landing. The foam prevents a large and deadly fire as the damaged plane lands. Keynesian economics does nothing to fix the plane in the air. In other words, Keynesian economics may be a necessary evil, but it is a subsidiary and accidental element to a much larger and powerful adjustment of the credit system. It is a palliative, not a cure. It is preventative medicine for a chronic injury that might prevent further deterioration.
So, as governments intervene, it tends to be at the level of 5 percent to 7 percent of deposits. This was the case with both the U.S. and U.K. banks in 2008, for instance.
LDRs and Determining Currency Values
To bring home the point, Figure 7.5 shows up another important data point about the effect of excessive LDRs on currencies. LDRs are an important way to determine the extent to which currencies are overvalued, and Figure 7.5 shows the relationship. Countries with a low LDR are those that have not yet fully deployed their deposits. In other words, the banks have not turned all their deposit liabilities into loans. So, there is scope for creating more credit for citizens of various jurisdictions, and the value of real estate and other assets can be inflated. The fair value of the foreign exchange rate should reflect this.

Figure 7.5 LDR versus Fair Value of Foreign Exchange: As LDR Rises, a Country's Asset Prices Rise as Leveraged Buyers Splurge
Source: China Construction Bank
The most accurate reflection of any foreign exchange rate is justifiably based on some form of purchasing power parity. A basket of goods in one country should, more or less, be the same as a basket of goods in another country, as expressed in that country's currency. This is called purchasing power parity (PPP). That is the principle of Figure 7.5. The X-axis shows the fair value of a country's exchange rate based in PPP. The Y-axis shows the LDR. It should be seen as no surprise that the higher the LDR, the great is the overvaluation of the currency, because after all of a country's domestic savings are used up, additional wholesale borrowing from international banks drives up values for assets to unsustainable levels. This is because the ability to drive up asset values (homes, buildings, cars) by any additional value depends on any extra additional money from the outside world. This money has come in only after all of the domestic savings of a country have been deployed into leverage to drive up asset prices. Do you think that international wholesale lending is going to find bargains after locals with far better knowledge and intelligence have picked over the assets? I very much doubt it. This is the problem with wholesale lending. They are, by definition, latecomers to the party. This is part of the problem that wholesale lending bank Standard Chartered faces in 2015. It got caught holding the bag in China commodity warehousing, Indonesian coal companies, and Indian energy deals, among others. They lent into the peak of the commodity boom and are now paying the price with a 50% drop in the stock price in 12 months.
The result of Figure 7.5 is that Brazil and Australia are the most exposed currencies globally. They have both been accidental beneficiaries of China's infrastructure buildout and both have shipped billions of tons of coal, iron ore, and other commodities. China's physical infrastructure is now built out, and Australia and Brazil have borrowed heavily against future commodity production from the ground. This is a problem for both countries, because cities such as São Paulo, Sydney, Rio, and Melbourne are among the most expensive cities in the world. Something has to give, and presumably that something will be the currency. This is because the financial systems of both countries take time to deleverage, adjust prices, and replenish savings. This is not a good place to be for equity investors.
The Best Indicator for Value for Financials
Do price-to-earnings ratios (P/Es) tell us anything about bank stocks? If you try to find a correlation of P/Es and other fundamentals for any time in the credit cycle, good luck. It is highly likely that you will find nothing but a random scatterplot of dots on a chart of P/Es relative to just about anything. P/Es simply do not matter when it comes to banks. This is because the stock prices of banks have far more to do with capital structure than with earnings. Bank stocks seem to be more interested not in how much money banks make as much as how they make money.
Stock prices have a way of sniffing out “unsafe” earnings that are high but unsustainable. In this way, the absolute amount of earnings per share (EPS) is an irrelevancy. And the state proves that out. See Figure 7.6 for a snapshot in time. It shows the P/E of banks globally against the LDRs. P/Es and other measures create the same conclusion: P/Es have correlations close to zero with most criteria in bank stocks.
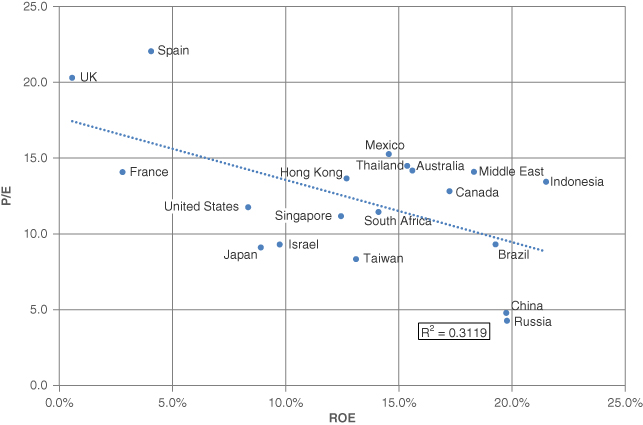
Figure 7.6 P/Es and ROE for Banks: P/Es Have Nothing to Do with Bank Valuations and Should Never Be Used
In Figure 7.6, we see a phenomenon that I have noticed for many years: As the return on equity (ROE) goes up, the P/E goes down. This is, prima facie, somewhat surprising. As the ROE goes up, one should expect a bank stock to fetch a higher multiple. After all, the capacity to create earnings on a certain equity base is actually accelerating. The reason the P/E falls and the stock is derated as ROE accelerates is simple.1 The only way to “goose” earnings for a bank that has exceeded its normal ability to create an ROE of 12 percent to 14 percent is by wholesale borrowing as the LDR exceeds 1.
Again, this is the theme of this book and the proof of the folly of thinking that wholesale funding is a legitimate way to create shareholder value, belied by the way that stocks behave after a bank has achieved an artificial ROE of about 18 percent to 20 percent. Not only are P/Es an unreliable gauge, but when banks move to wholesale borrowing as the LDR exceeds 1, the P/Es bend backwards and decline. This shows that wholesale banking causes a derating of a bank stock and destroys shareholder value. So beware of banks with low P/Es and high ROE. They are cheap for a reason, and often correctly are ferreting out danger.
What about ROE as a Measure in Itself?
Many people use ROE to look at bank stocks, but this also belies a big problem. Many banks in the world are funded in their capital structure entirely by retained earnings. ROE offers false signals, because as banks engage in wholesale borrowing, the capital structure changes to a more dangerous type of funding. By definition, as the LDR passes 1, banks must borrow through long-term loans, and this becomes part of the capital base. So, the ROE rises, and at the same time, the quality of earnings goes down because it is predicated on debt that is international in nature and can leave tomorrow. ROE does not take this into consideration. That is why, even though P/Es have a low correlation, the overall correlation is actually negative. In other words, as the ROE goes up, the P/E tends to go down.
The bottom line? P/Es are largely irrelevant in analyzing banks and will, more likely than not, tell you counterintuitive information. The better the ROE, the lower the P/E. This is because an ROE above 15 percent usually is generated by dangerous and unstable wholesale funding, which Mr. Market rightly concludes is very risky and, therefore, merits a derating.
As with All Living Corporations, Return on Capital Is Everything
This is why the banks like Credit Suisse, Deutsche Bank, and Barclays are problematic these days: They are not funded predominantly by deposits but mostly by long-term debt. Deutsche Bank is not really a bank; it is a financial holding company funded by long-term debt. Only one-third of its balance sheet is deposits. Two-thirds of its balance sheet is long-term debt. The same is true for Credit Suisse. If you add the long-term debt to the equity, you arrive at the return on capital (net income divided by total equity plus long-term debt). Of course, deposit liabilities are not included in this calculation. This is an entirely reasonable, accurate, and sensible return on capital calculation, which, as we will see, is the precise way to measure value for a bank. After all, the long-term debt is a real liability of the banks and must be included in the capital structure. Deposit liabilities are what makes a bank a bank. People have trust and confidence that the money they deposit today will be theirs for the taking tomorrow. The bank gets to keep these deposits as long as the bank maintains full faith and credit of the depositors. The bank is not obligated to return it at a certain date. This is obviously true of checking deposits that sit around bearing zero. Long-term debt, on the other hand, must be returned to bondholders when the debt matures. It does not belong to the bank but accrues interest while the principal must be returned to investors. This is the difference between deposits and principal. One is capital and one is deposits. The difference is clear for all to see. A bank is like any corporation. Long-term debt and equity are the capital base from which the bank grows its earnings.
This is an important difference. Principal is a true debt liability that has covenants and a host of legal obligations that simple deposits do not. Indeed, most banks have no long-term debt and massive long-term debt is a very new phenomenon in the history of banking. The difference between deposits and principal is vital to understanding why the European banks are stuck in the financial quicksand from which the ECB is trying to extract them. Vast amounts of long-term debt need to be refunded to keep the assets alive. Without relief from the ECB, the market is telling us that the long-term debt funding of these banks is problematic. Finance companies (non-bank financial institutions) do not rely on deposits and usually blow up in a crisis as short-term funding (6 months to three years) is pulled while long-term assets (five years to 30 years mortgages for house and buildings) need to be funded. If this debt is pulled, the assets must be sold and a domino effect occurs. This is why the ratings agencies are forced to play a game of keeping investment ratings on banks that are trading like they are going out of business. If the banks are downgraded to junk status (BBB+ or below), institutions such as insurance or pension funds that hold the debt of the banks (not the deposits) very often must sell the debt as a fiduciary obligation to their shareholders. Thus, central banks must enter the fray and prop up the balance sheet of the banks by buying the debt. This is way beyond the protection of shareholders. It is the protection of equity shareholders, bond holders, and the viability of the pension and insurance system that fund themselves through vast holdings of bank debt. There is a lot at stake, which is why so many “Austrian” economists and free-market purists hold their noses and agree to this form of socialist economics.
Furthermore, common sense matches the opinion of the market. As can be seen from Figure 7.7, this is the problem with the world. Five members of the G7 have broken capital structures. This does not include the Swiss banks, which also are in that square and have problematic capital structures. Over the years, these universal investment banks accumulated insufficient equity capital through retained earnings and, at the same time, accumulated long debt (they issued hundreds of billions of dollars of debentures to pension and insurance funds) to fund their balance sheets. This caused a collapse in the return on capital, which precisely explains the appalling valuations being attached to the equity valuations. As an example, Deutsche Bank at the end of 2014 was trading at 0.5× book. This is one of the worst valuations globally, and reflects its terrible returns on capital.

Figure 7.7 Return on Capital versus Price/Book for Global Banks: Return on Capital Works! The Banks at the Bottom Left Are the Broken European Banks
Similarly we can see that the banks in Japan, France, Italy, and the United Kingdom are all creating returns on equity that are very poor, indeed. The average for this group is less than 2 percent. (Notice that the U.S. banks have achieved some degree of liftoff, with accelerating returns on capital at 4 percent, and are being rerated.) But the U.K. and European banks have returns below 2 percent at a time when the cost of capital is still 6 percent or 7 percent. This is not a sustainable equation. The fundamental understanding of markets (and one that I think reflects reality) is that if the return on capital is greater than the cost of capital, stocks rise. If the return on capital is below the cost of capital, stocks fall. This explains perfectly the situation in the European banks now.
Indeed, Figure 7.7 tells us that bank stocks are being driven by return on capital. The greater the return on capital, the higher the price/book the bank receives. This seems axiomatic. Right now, the Indonesian and Filipino banks have among the highest returns on capital globally and also have some of the healthiest LDRs globally. Thai, Malaysian, and Hong Kong banks are right on the line and follow this trend. One of the exceptions is China, where the banks are offering high returns on capital, high dividend yields, and strong bond price performance but have been languishing for two years due to the impression that they have higher non-performing loans than they are admitting. Time will tell if that is really the case.
If we bring this down to the stock level, Figure 7.8 shows a fairly uncanny relationship between returns on capital and valuations of price/book. This makes great sense and is a robust way to examine whether to buy banks. In Figure 7.8, for instance, we might conclude that Metro Bank is somewhat overvalued. And we might conclude that Bank Mandiri is undervalued. Funds that do pair trades could sell banks that are on the left side of the line and buy banks on the right side of the line. This is based on a mean reversion idea that return on capital, over time, is an ideal way to examine valuations on banks.

Figure 7.8 Return on Capital versus Price/Book: Global Emerging Market Banks Don't Have Bonds, so ROE = ROC
In conclusion, P/Es are as likely to deceive as they are to assist when it comes to buying or selling banks. They can create a perception of cheapness (especially at the top of a cycle, when ROEs are high), but this could be a honey trap and lead to losses. ROE by itself tells us little unless we incorporate the capital structure of a bank, which may have large amounts of long-term debt. This is why return on capital is ideal. We showed that returns on capital and the price/book have fairly uncanny predictive ability. There are anomalies among and between banking systems, but return on capital in alliance with price/book is very helpful. In periods of extremes on the upside and downside, the best parameters to look at are market capitalization/deposits and LDR. This gives a sense of valuations in the extremes of the bubble, which usually tap out at 30 percent or so and offer selling opportunities. And they offer buying opportunities when the market cap/deposits bottoms out at 5 percent to 7 percent, when there is panicky selling. This is actually a great buying opportunity.