Chapter 6
Central Banks Are Carrying the Greatest Load and Will Dominate Outcomes
One new phenomenon in this crisis is the role of central banks. On top of negative credit growth, massive central bank intervention is another phenomenon that no one who is alive in the West has seen before. For 20 years, Asia analysts have been watching as the Bank of Japan has tried in vain to alter asset prices by expanding the balance sheet. We submit that central banks cannot alter the path of asset prices; they can only slow the path. As Alan Greenspan said many years ago when someone asked him to define the role of a central bank: “Central banks can only buy time.” We will look at how central banks enter the picture and act as a kind of quasi-banking entity to stabilize asset prices. We will show that without active and aggressive “writing off” of bad assets and bank recapitalization, central banks are simply too small to have any real effect on the financial assets.
Why Have Central Banks Become So Involved in the Solution of the Global Financial Crisis?
A loan is like a tube of toothpaste. Once the toothpaste comes out of the tube, it is impossible to put it back in. So it goes with a loan. When a loan of $100 is given to a borrower, only two things can happen. Either the borrower pays it back in full with principal of $100 and interest of 6 percent (which is $6), for a total of $106 after one year, or the banks have to write off the loan below its initial value of $100 and try to collect some collateral that the borrower has offered up. The banks needs to find something else of value equal to $100—property, cash, stocks, or similar. The banks can also sell the loan to someone else, but the loan still remains someone else's obligation. It does not go away. Someone is always on the hook for a loan.
Here's the problem with the 2008 global financial crisis: All of the debt that was distributed to borrowers (mortgages, corporate loans, individual loans, margin lending) was so vast that there was not enough cash, stocks, property, and so forth to repay the banks. The Western banks had obligations in excess of US$55 trillion of debt. The gross domestic product (GDP) of the United States and the Eurozone combined is about US$30 trillion. As this unwind of leverage came apart, the amount of collateral being called in (with the result that prices were being pressed down or depressed as things were being sold all at the same time) was in danger of creating a deflationary catastrophe similar to the Great Depression.
Since there is no one on Mars or Venus to buy these assets, banks called the central banks and told them of the problem. If the central banks did not buy these assets, a deflationary spiral would have been created that would have become hard to pull back from (figure 6.1). This is because if loans were called in, the underlying assets would have fallen in value because there would be no one else around to buy them with leverage. Only cash buyers would be around. What you can buy with cash and what you can buy with a loan are very different. A cash buyer would only be able to afford to buy these assets at a fraction of their value. Also, it is very likely that the major central banks in the United States and the United Kingdom, the European Central Bank (ECB), and the People's Bank of China (PBOC) were all talking to each other at the same time, probably in the summer of 2008. They needed to provide standby credit facilities in the early summer of 2008, but it was becoming clear that other means would be necessary.
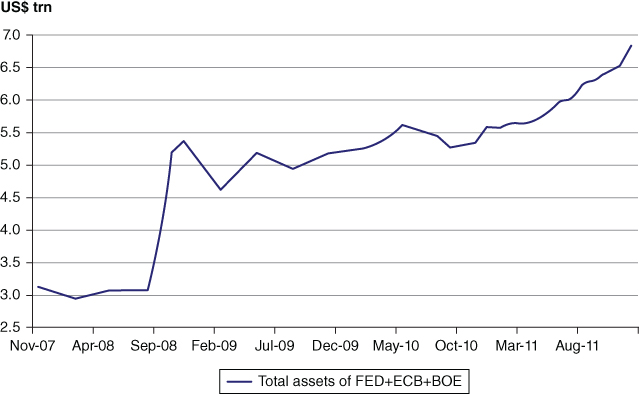
Figure 6.1 Central Bank Total Assets: They Had to Absorb Assets Being Thrown Overboard by Banks
Source: China Construction Bank
If some other entity did not buy the loans (we can think of buying a loan as “funding” a loan, for this is the same thing), it is likely that banks would have been put out of business because of the write-offs of bad debt that would have resulted. It is also likely that systemically important institutions such as Fannie Mae would have collapsed and caused a spiraling down of property prices, bringing about a collapse in the U.S. mortgage market. So, the Federal Reserve, the Bank of England, and the ECB all huddled together to find a solution. They needed to find a way to embark on a major extraordinary bailout of the financial without creating panic and a downward spiral of depression.
To give you an idea of how big central banks are in the scheme of things, Figure 6.2 shows the total assets of central banks relative to other assets. For instance, as of mid-2014, the assets controlled by central banks were almost US$15 trillion. Contrast this to other assets and we can see that the central assets are six times larger than all of the hedge funds put together. They are also six times larger than all of the sovereign wealth funds put together. In fact, if you put all of the private global private equity funds, the global hedge funds, and sovereign wealth funds together, they would still be one-half of the central banks' assets. So we need to consider that these central banks decide the course of assets for some considerable period of time. The problem is that these central banks, whether we like it or not, are fickle political creatures and respond to the flotsam and jetsam of political demands. This makes the art of investing in this age of financial crisis very difficult.

Figure 6.2 Total Assets by Industry. Central Banks Are Still the Heavyweight. Could Private Equity Morph into Investment Banks?
The way that central banks got so large was by purchasing two major asset types. The first was risk assets that could not be bought or “funded” by banks. The risk assets that were most at risk were mortgages. So, the Federal Reserve bought more than $1 trillion in mortgages. The second type of debt that did not have sufficient numbers of buyers was government debt, which was being issued both to stimulate the economy and to assist in the bailout of the banks. If the Federal Reserve did not do this, there was a risk that the supply of government debt being forced onto the economy would have caused a collapse in prices (and a spike in yields), given that the supply of debt available would have swamped any reasonable demand. A spike in yields would have been another shock to the already damaged real estate market.
The point is that a new source of demand was needed outside of existing market players, since the existing players had too much debt and insufficient collateral and were in no condition to absorb even more debt. It was mathematically impossible to solve the problems without a new source of demand for all the debt. So the central banks stepped in and acted in ways that were historically unprecedented. A purchase of debt on this level had never been tried before. Central banks had to act, or the entire banking system would have imploded. And the central banks of the United States, the United Kingdom, and the Eurozone had to act in concert, because the financial system was a complex global web of transactions in which Bank of America was trading with the Royal Bank of Scotland (RBS) and Deutsche Bank at the same time. An unwinding of one system in one country would have brought down the entire system.
As it turns out, former Fed Chairman Bernanke envisioned such a scenario in a book that he edited, called Essays on the Great Depression. Bernanke is considered an expert on the Great Depression, and he also contributed a chapter to the book. In this chapter, he outlined exactly what he thought should be done in the event of a debt buildup that could result in a depression if it were not handled correctly. Bernanke was pretty clear on what informed his views on depressions. The main cause of deflationary episodes, he surmised, was that policymakers tended to underestimate the level of debt in an economy when trying to implement measures to clean out the system or to allow excesses to be cleaned out or written off. If the levels of debt are larger than anyone thinks, the process of purging the system of bad debt and “resetting the clock” can backfire and result in a wipeout of bank capital and a freezing of the credit system. Indeed, this is exactly what happened in the Great Depression.
In Table 6.1 we outline Bernanke's 10 Commandments to avoid deflationary depression, as derived from the book (indeed, the actions he and others implemented were a carbon copy of those from Essays). These are the thou shalts of policymakers in order to prevent a collapse in land values, the wages of labor the bank capital required to fire the engine of credit. In his writing, he errs on the side of regulatory forbearance (or liberality) when it comes to debt forgiveness. Others on the right side of the ideological spectrum (for the sake of simplicity, let's call these the “Austrians”) prefer quick and sudden pain to clean out the system. Bernanke would say that this is naïve, because it would cause an automatic shutdown of the system and create a self-perpetuating downward spiral from which it would be difficult to exit.
Table 6.1 Bernanke's 10 Commandments from Essays on the Great Depression
| In order to prevent debt deflation, THOU SHALT… | Start Date | |
| I | Raise capital through government | October 2008 |
| II | Guarantee assets, deposits | October 2008 |
| III | Run large fiscal deficits | March 2009 |
| IV | Guarantee GSEs | September 2008 |
| V | Slash rates/commit to low rates | January 2008 |
| VI | Purchase long-term assets/treasuries | March 2009 |
| VII | Depreciate the U.S. dollar | Ongoing |
| VIII | Guarantee and purchase high-risk assets | Ongoing |
| IX | Offer explicit (asset) inflation target | Ongoing |
| X | Renegotiate debt between banks and borrowers | Ongoing |
Source: Nomura
The 6th and 8th commandments, which we discussed above, are only part of the whole plan; these involve not just buying government debt but explicitly buying risky assets to help put a floor under the private sector credit system, in particular, the real estate market. All of these measures are designed to prevent deflation in the event of a debt meltdown. The other commandments serve as a means to restore confidence and allow economic activity to resume:
- Guaranteeing deposit liabilities in order to allow depositors to have some relief about keeping their cash in the bank
- Running deficits to restore confidence and create jobs
- Offering a long-term commitment to low rates to reassure investors
- Offering an explicit inflation target to allay the fears of those who were afraid of deflation
The all-encompassing philosophy of these actions of the past six years is to avoid deflation at any cost. Deflation has insidious effects on debt. The simple reason is that if I owe 100 dollars in 12 months, and I also still need to pay 6 dollars in interest, deflation means that my wages go down and the value of my house goes down. I am poorer and I feel poorer. In addition, I have a harder time paying back the same amount of dollars, because the 100 dollars does not go down in value. It actually goes up in “real” terms in deflation, producing a perverse effect of making debtors get poorer just by standing still. This is what happened to the United States in 1929 to 1934. It got poorer just by standing still because policymakers allowed a debt-laden economy to endure deflation without providing any support or relief to debtors. This was suicidal and proved to be utterly destructive to land, labor, and capital. Arguably, the deflationary depression lasted until December 8, 1941, when the war effort ramped up and unemployment fell dramatically. On Friday, December 5, 1941, the unemployment rate in the United States was 20 percent. Deflation is a nefarious animal and should be avoided at just about any cost.
Where are we in 2014? Table 6.2 shows where we are now. The amount of debt purchased by the combined central banks of the Federal Reserve, the Bank of England, and the ECB are now about 30 percent of GDP. This amounts to about US$13 trillion. Consider that before the crisis, each of these central banks had puny amounts of risky or government assets. In the specific case of the Federal Reserve balance sheet, it was a mere 6 percent of GDP. It now stands at more than 30 percent of GDP. On the asset side of the balance sheet, we can see a picture of a swelling of government bond holdings as well as risk assets, almost all of which are mortgage-backed securities. (It is important to mention here that the “real” definition that Bernanke envisioned was not merely buying government bonds but buying risk assets such as mortgages. Some pundits say that one of the reasons that Japan never recovered from the morass of debt deflation was because the Bank of Japan was not quick enough to engage in the outright purchase of risky real estate assets. Since history never reveals her alternatives, we will never know.)
Table 6.2 Central Banks and Their Weight as Percent of GDP
| Country | GDP($BN, IMF '14 EST) | Central Bank Balance Sheet ($BN) | Central Bank Balance Sheet/GDP | Reserves/GDP | Currency in Circulation/GDP | Bonds/GDP |
| United States | 17,438 | 4,172 | 23.9% | 15.6% | 7.0% | 12.5% |
| China | 9,761 | 4,801 | 49.2% | 32.0% | 10.1% | 13.5% |
| Japan | 5,228 | 2,038 | 39.0% | 18.4% | 15.6% | 31.3% |
| Europe | 13,203 | 3,034 | 23.0% | 4.2% | 9.9% | 0.0% |
| UK | 2,627 | 661 | 25.2% | 18.8% | 3.7% | 23.7% |
The liability side of the Fed balance sheet is slightly harder to understand. It is the way in which every single nickel of the assets must be funded or “paid for.” In the past, the liabilities of the central bank were almost entirely composed of notes and coins. All of the money pouring forth from an ATM is a liability of the Federal Reserve. Prior to 2007, there were almost no other liabilities. Table 6.3 shows the composition of the Federal Reserve in mid-2014.
Table 6.3 Fed Balance Sheet: Voluntary Reserves Is “Unused” Money; Fed Owns 15% of Housing Market
| Federal Reserve Balance Sheet (USD BN) | |||
| Bonds and notes | 2,181 | Deposits | 2,720 |
| MBS | 1,570 | Money in circulation | 1,215 |
| Premium on securities held | 193 | Others | 180 |
| Others | 227 | Total capital | 56 |
| Total assets | 4,172 | Total liabilities and capital | 4,172 |
In 2008, when the bank bailout package was passed by Congress, there was one vitally important sentence that made all the difference to just how large the balance sheet could become. The one sentence said that for the first time in the history of the Federal Reserve, it could pay interest on deposits. As such, for the first time, there was an incentive for banks to deposit money in the vaults of the Federal Reserve. These are called voluntary deposits or voluntary reserves. These are deposits that are mostly electronically deposited. They are, for all intents and purposes, used by the Fed to buy government debt. In fact, the growth in money supply is in sync with nominal growth, so the vast majority of the growth in the balance sheet of the Fed has been caused by customer deposits in banks (which are cash on the asset side of the balance sheet of the bank) to be transferred into the liabilities of the Federal Reserve balance sheet. It is just cash going through a lot of machinations without doing anything except funding a buildup of government debt.
It is important to remember that the voluntary deposits that received interest did not exist (they were not legally capable of existing) before the global financial crisis. So, before 2008, 90 percent of the liabilities of the Federal Reserve were nothing but “notes and coins in circulation.” This is basically money in the ATMs. Now, we can see that notes and coins (1) are less than 30 percent of the entire balance sheet and (2) have been growing only slightly higher than nominal GDP in this entire period. So, the notion that the government is printing money to buy government debt is wrongheaded and muddy thinking.
Because the money used to “buy” government bonds is actually voluntary deposits from banks, which would otherwise have that money sitting on their own balance sheets collecting virtually nothing, the ability of an extra dollar to make a difference in additional GDP growth or credit activity is actually falling. This is the idea of the money multiplier effect. Cash that is doing nothing in a bank is transferred to the Federal Reserve to buy government debt, which is being used to accommodate a deleveraging of the financial system and stabilize asset prices. Hopefully, the activity caused by government debt has some auxiliary effect in creating activity through infrastructure buildup or defense activity. The point here is that the Fed is not creating money out of thin air. It is borrowing existing cash from banks that are scared to lend. In this way, the activity is understandably neutral at best and deflationary at worst. The cash is just “round tripping” and not creating an extension in the private sector.
This is a slightly more elaborate argument, similar to the chapter discussing loan/deposit ratios (LDRs) and Keynesian economics, that demonstrates why deficit spending during financial crises does not work. The excess cash available is pushed into buying treasuries while the balance sheet of the bank shrinks back to a sustainable level. Until this is done, the ability of an extra dollar to generate activity is hampered, because the real power to drive up asset prices and wages comes from leverage. Until the banks reach an equilibrium (an LDR below 1 and leverage below 16), the system will limp along; government debt simply is a bandage for the bleeding caused by the exit of leverage from banks. As and when banks resuscitate their balance sheets, the system can return to normal. At that point, deficit spending will no longer be needed. In fact, deficits will tend to drop and turn to surplus precisely because banks are now driving up asset prices, consumption, and employment. Government spending is very definitely second fiddle. We can see here that the banks are definitely the dog wagging the federal tail. It is not the other way around.
To drive the point home further, while the banks are offering over deposits to the federal reserve (of the Bank of England or the ECB for that matter), they are offloading debt (shrinking assets) by:
- Closing out the loan to a creditor and telling them to look somewhere else for credit;
- Writing off the loan against income or writing it off against capital in the case of losses; or
- Restructuring the loan and selling it to another bank in the form of a securitized loan or some kind of financial product; and
- Placing bad assets in a bad bank that is to be auctioned off in a safe and stable manner. This is, of course, capitalized and managed through the beneficence of government debt.
Banks are also trying to find new ways to lend money, but they are in defensive mode and are trying to cut costs, so they often spin their wheels. (We will see in another chapter that while the banks are spinning their wheels, entrepreneurs enter and find new ways to allocate capital, lend money, or manage risk.) Once a loan is distributed, either the borrower pays back the money, or his assets are seized, or the bank writes down the loan. There is no other way for this to play out. That is why banking crises are so pernicious. They truly are balance-sheet recessions in that there is no other choice except for the collective balance sheet to “recess” or “recede.” There must be shrinkage, and this only causes asset prices to fall.
What can we say the central bank is doing while all this is occurring? The central bank is accommodating a deleveraging of the banking system while funding a buildup of debt. As we shall see, both of these activities are fundamentally unhealthy over time, but the central banks have no choice (figure 6.3).
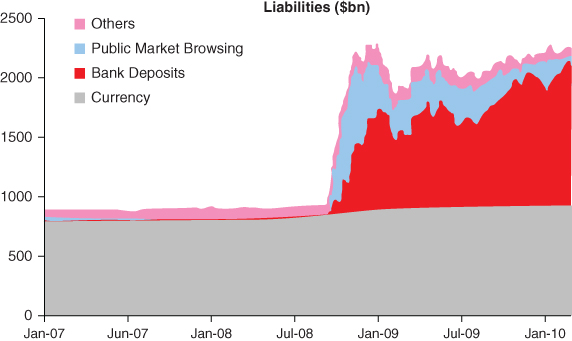
Figure 6.3 Federal Reserve Liabilities: Big Change from Mostly Currency to Mostly Risky Assets
Source: Nomura
Once again, it is important to keep in mind that the liabilities of the Fed in this new age of banking are not the creation of money. This is a common mistake of those who say that the central banks are printing money to get out of the problem. It is the furthest thing from the truth. This money is not printed but recirculated. It is not new money but old money that finds its way to the central bank and collects 25 basis points.
Why would banks put their money here? They do not have any other use for it. Banks do not want to lend, and people do not want to borrow. The credit engine in the United States, while now functioning better, is still weak and sick. We should think of excess reserves as oil in the oil pan of a car. A car has a system that requires oil to lubricate the engine, but sometimes there is only a need for a certain amount of oil. The remainder of the car's oil, which is in excess of what is required, drains to the bottom and is not used.
These excess reserves sit across from the government debt and mortgage debt assets purchased in quantitative easing by the Fed and are funded mostly by these excess reserves. The obvious question here is what happens to the assets of the central bank when the liability excess reserves (which are assets of the banks in the form of cash) are needed to create loans? This is the $64,000 question. Never in modern history have so many excess reserves been sitting idle in the central bank. If banks suddenly get into the mood to lend, these deposits could be withdrawn by the central bank and then the assets have to shrink.
In the specific case of the Federal Reserve, we will show that the essential role of the U.S. central bank is to stabilize Fannie Mae (FNM) and Freddie Mac (FMAC). The private banks in the United States have terrific LDRs at .62 percent and solid capital bases of about 16× leverage in a remarkably short time. The reason real estate prices are soggy, however, is because Fannie Mae owns half of the mortgage market in America and funds itself through the brain-dead mortgage-backed securities market—not through deposits. So, banks are doing well and are looking for new lines of business, and their stock prices are showing it. But the real estate market may crawl along the bottom for a considerable time until Fannie Mae and Freddie Mac are recapitalized or are somehow rehabilitated. As of this writing, 20 percent of U.S. homes are still “under water” (i.e., the amount owed on the mortgage is higher than the value of the home).
There is one risk here. Figure 6.4 shows what happened in 1994 when the U.S. economy finally recovered from the savings and loan crisis of 1989. While banks were licking their wounds from 1990 to 1993, they were very busy buying government bonds rather than lending money to the private sector. See Figure 6.4 to see this buildup. The purple from 1989 to 1993 shows the buildup of government debt to bail out the savings and loans and help out the economy after it entered a recession due to the drop in asset prices. By 1994, the economy exited the slowdown and a boom ensued. Banks no longer had an appetite for government debt and were inclined to create risk assets such as car loans, mortgages, construction loans, and loans for manufacturing; hence the price of bonds dropped as many players sold at the same time. Consequently, yields rose and caused a crash. Knowing when the risk appetite for banks is returning is the key to getting bond prices right. The United States was exiting the slowdown as 2014 drew to a close, but the Federal Reserve may need to keep rates low, since Europe's banks are in terrible shape. This may keep yields lower for longer.
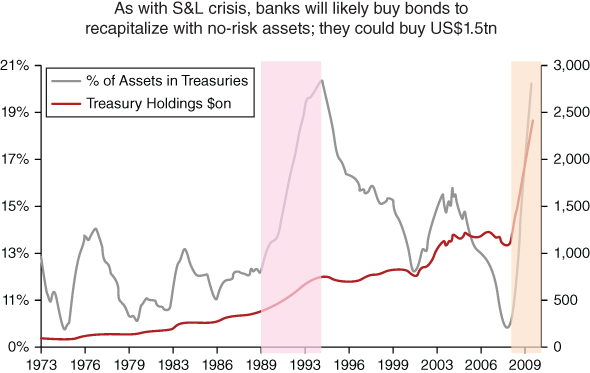
Figure 6.4 Bank Holdings of Government Debt: The Fed Had to Take Debt on Its Balance Sheet or Rates Would Have Spiked
Source: Nomura
When the all-clear sign does in fact appear, what happens to our current configuration as the preference for risk shifts? Figure 6.4 shows us that as the banks moved away from holding government debt to lending once again to the private sector, the holdings of government debt went from 20 percent of the balance sheet back to 11 percent of the balance of the banks. Guess what happens to prices of something when suddenly no one wants it? The prices of government bonds fell hard, and bond yields rose dramatically. This was the big bond crash of 1994, when yields on the 10-year bond shot up by several hundred basis points and caused the great bond crash of 1994.
Cut to 2015, and many people are asking what happens to bond yields if massive government holdings at the Fed (funded by cash provided by the banks) can no longer be “funded” or paid for by the banks. What if the banks want to turn this cash into risk assets, such as loans to consumers or businesses? What is the interplay (the tug of war) between this cash that may seek to exit holdings of government bonds and enter a risk trade by way of a loan for a car or for machinery?
This problem is made all the more problematic in 2015 and 2016 because the locus of much of the bonds at stake is in one place. The Fed is a monopolist of government bonds. It has been the sole buyer of these bonds (the opposite of a monopolist, which is the sole seller). It can dictate terms to the seller of bonds (i.e.., the government). If it suddenly goes into the market and is forced to sell government bonds when the banks are in a mood to lend and offload their balance sheet or cash and sovereign risk (while the private sector is in a mood to expend or spend), no one is around to buy these bonds. Both the banks and the private sector are engaging in risk-taking behavior. There are concerns that a bond market crash could ensue. Table 6.4 shows that the big three central banks combined hold government debt on their balance sheets that is equivalent to about 25 percent of GDP. This is a big number, and it is a very risky poker game. If one central bank starts to sell its bonds because the economy is healing, this could bring about a crash in the country, which is still building up its government debt load (loose monetary policy). Table 6.4 shows the levels of debt and what we are talking about in dollar equivalent. Central banks have total assets of about $16 trillion. This is about 25 percent of GDP. And the Federal Reserve alone has more than $2 trillion of government debt. It absolutely will move markets if it decides to offload some of these bonds.
Table 6.4 Central Banks Comparisons Globally: The Column at Extreme Right Shows Risk Profile (U.S. Best Balance Sheet)
| Country | GDP($BN, IMF '14 EST) | Central Bank Balance Sheet ($BN) | Central Bank Balance Sheet/GDP | Reserves/GDP | Currency in Circulation/GDP | Bonds/GDP |
| United States | 17,438 | 4,172 | 23.9% | 15.6% | 7.0% | 12.5% |
| China | 9,761 | 4,801 | 49.2% | 32.0% | 10.1% | 13.5% |
| Japan | 5,228 | 2,038 | 39.0% | 18.4% | 15.6% | 31.3% |
| Europe | 13,203 | 3,034 | 23.0% | 4.2% | 9.9% | 0.0% |
| United Kingdom | 2,627 | 661 | 25.2% | 18.8% | 3.7% | 23.7% |
There is, of course, a delicate interplay when it comes to understanding where the cash that banks want back and the same cash that the Fed needs to fund government bonds will end up. Some say that excess reserves just won't move that quickly—and can't. (Peter Stella is a retired expert on central bank balance sheets from the IMF and claims that this fear of a sudden move away from central bank deposits to risk-taking lending is overblown. Conservative economists say that hyperinflation is right around the corner. Then again, they have been saying this for years.)
The correct answer is that there has never before in modern history been a circumstance where trillions of dollars lying at the Fed, which are funding trillions of dollars of government debt held by the Fed, suddenly are unwound and leave to fund risky assets. The market has many self-correcting mechanisms. For example, if there is a sudden surge in demand for loans for cars or machinery and interest rates suddenly rise (because banks force the Fed to sell bonds and turn the cash into risk assets), then rates may spike and in turn squash newfound risk appetite.
Table 6.5 is illustrative of the size of the issue, in that it is an addition of all the major central banks' balance sheets put together. It is easy to see how many government bonds are currently sitting on the balance sheets of these banks by looking at the asset side. The U.S. Federal Reserve has the largest absolute amount of bonds on its balance sheet with about $2.2 trillion. This is about 15 percent of GDP. In contrast, the Bank of Japan has about $1.6 trillion dollars of Japanese government bonds (JGBs) on its balance sheet, which is a whopping 32 percent of GDP. This may rise to 50 percent of GDP if the full force of Abenomics is brought to bear as planned.
Table 6.5 Combined Central Bank Balance Sheet Globally: Central Banks Own $6 Trillion in Government Debt; ECB Has $1 Trillion in Bank Debt
| Central Banks Summary (USD BN) | |||
| Total government bonds | 5,759 | Voluntary reserves | 4,728 |
| U.S. Treasuries held by the Fed | 2,181 | Required reserves | 3,125 |
| U.S. Treasuries held by PBOC | 1,317 | Money in circulation | 4,424 |
| U.K. Bonds held by BOE | 623 | Others | 2,204 |
| JGBs held by BOJ | 1,637 | ||
| Bank debt held by ECB | 1,015 | ||
| Risky asset | 1,652 | ||
| Gold | 450 | ||
| Others | 5,830 | Capital | 225 |
| Total assets | 14,706 | Total liabilities and capital | 14,706 |
There are some interesting peculiarities here. Look at the liabilities side of this combined balance sheet. Voluntary reserves are about US$4.8 trillion. This is money in the West that is sitting idle by banks and deposited into the central bank for a pittance. This is happening because banks simply do not have the confidence to lend and because there is no appetite to lend. Think about it: 10 percent of GDP is just sitting and gathering dust. Western Central banks are desperately trying to get this money back in circulation.*
On the flipside, you have required reserves. Almost all of this is in China. China has been dealing with the opposite problem of a booming real estate sector that will not go down. It is dealing with an asset price surge that has forced the PBOC to force banks to hold their cash at the central bank in the form of deposits that receive about 1 percent. China can, if it wants, lower the required reserves, but it still is concerned about asset inflation. So the tug of war continues. China bottles up the excess liquidity of the world in the form of required reserves, and the West has almost the same amount of cash sitting around that it wants to circulate in the economy.
Furthermore, if the Federal Reserve does shrink its balance sheet, there is much concern around large fixed income funds like PIMCO. A sudden rise in yields across the yield curve could do great damage to the capital of the retirement holdings of older people. People who are holding the actual funds could see a loss of capital as the value of these funds drops. This is political dynamite in a rapidly aging population. Politicians will put immense pressure on policymakers to stop the carnage in the bond market. This may cause the Federal Reserve to implement policies to discourage banks from taking risk and, instead, reconsider holding government bonds. This is all terra nova for policymakers globally, and outcomes are uncertain. An unwinding of this vast proportion has simply never been tried before. Anyone who claims to know how this will unwind is as deluded as the person who predicted the outcome of World War I accurately in 1914. It is impossible to know, and there are myriad forces at play that can push things one way or another.