
Chapter 1
Global Demographic Trends
In this chapter I will analyze demographic trends globally, as well as trends in different parts of the world, specifically focusing on developed countries, middle-income countries, and developing countries.
Prior to the Industrial Revolution, all countries had a slow population growth that was coupled with high mortality and high birth rates. Because, in pre-industrial societies, the infant mortality rate was high and life expectancy was very low, parents needed to produce as many offspring as possible to make sure that at least one child would reach adulthood.
Let us define some commonly used terms. The birth rate is the number of births per 1,000 people, and the (total) fertility rate is the average number of children per woman, measured by adding up the number of children per woman in each age group at a given time in a country or region.
Over the last 200 years, as a result of the Industrial and Technological Revolutions, the world economy has grown tremendously. Average per capita income grew from just a few hundred dollars to a few thousand dollars globally. As people became wealthier, they had more resources, which in turn enabled them to raise healthy offspring. Advances in medicine and health also resulted in a plummeting infant mortality rate. As a result, life expectancy increased and the world's population grew very rapidly. Although it took some time, people gradually adjusted to the new reality, realizing that, with the lower infant mortality rate, it was no longer necessary to have as many children to ensure that some would survive into adulthood. Consequently, the fertility rate dropped as people became healthier and more affluent, much to the surprise of economists and sociologists, who expected continuous population expansion.
Usually there is a one-generation time gap between decreasing infant mortality and fertility rates. So, when a country begins to become prosperous, a substantially lowered infant mortality rate and a very high fertility rate tend to create a population explosion. Only after 30 to 40 years, approximately one generation later, does the fertility rate begin to decline. Even when the fertility rate falls below the replacement level, the total population will typically continue to grow for one to two generations, simply because people live longer. In most middle- to high-income countries, the fertility rate has dropped below the replacement level at some point in the past, but the total population is still growing, albeit more slowly. However, if fertility rates remain below the replacement level for one to two generations, the population will eventually begin to shrink. That decline will accelerate over time and, meanwhile, with fewer offspring and longer life expectancy, the populations of most countries will age rapidly.
The pattern of demographic transition described above is typical of a post-industrial country. Fertility rates in wealthy European countries began to decline long before the two World Wars, and many of them suffered a heavy population loss during the wars. After a post-war baby boom in the 1950s and 1960s, their fertility rates declined sharply throughout the 1970s and 1980s. By the 1990s their fertility rates had dropped below replacement levels, and it is predicted that their population will begin shrinking (once immigration from different regions is excluded) by 2020. Fertility rates in Russia, Eastern Europe, and Southern Europe have dropped below 1.4, which means that the 0–4 cohort is 30% smaller than the 31–34 cohort. Japan's situation is even worse, with its fertility rate dropping below the replacement level as early as the 1970s, and most recently to only 1.4. Japan was the first major country in the world with a shrinking total population. China had a population explosion during the 1970s and 1980s, as did many other developing countries, but now has a very low fertility rate of 1.3, partly due to its family planning policy. The country's population is expected to begin shrinking by 2030.
As industrialization and urbanization spread globally, more countries are experiencing low and declining fertility rates. India has a fertility rate of 2.5, much lower than it was 10 years ago, and still declining. The only exceptions tend to be the least-developed countries (LDCs) (such as Nigeria), which are still in the very early stages of their demographic transition cycle. Today, more than half of the people in the world are living in a country that has a below-replacement-level fertility rate.
Figure 1.1 shows the population forecasts for the world. The total world population is at 7 billion and counting. However, over the next few decades, the population of many countries—including China—will peak and begin to decline. Even India, which will soon overtake China as the most populous country in the world, will start to have a below-replacement-level fertility rate in 20 years, and its population will peak in 2090. By that time, the world population is likely to peak at around 10 billion people. After that, the world population will start to stagnate or begin to decline.
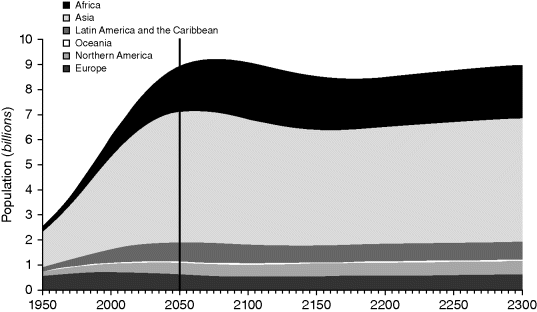
Figure 1.1 Population forecast in major regions of the world: 1950–2300
Source: United Nations, Department of Economic and Social Affairs, Population Division (2004). World Population to 2300.
These population forecasts are based on—and sensitive to—the predictions of future fertility. For example, if each woman, on average, has 0.2 children fewer (or more) than predicted, then the peak world population will be roughly one billion fewer (or more) than predicted. Declining fertility rates can sometimes be surprising in their swiftness; for example, in the 1970s, nobody predicted that China's fertility rate would drop from 5 to only 1.3 by 2010.
The inverse relationship between per capita income and the total fertility rate seems to be strong and universal (Figure 1.2).
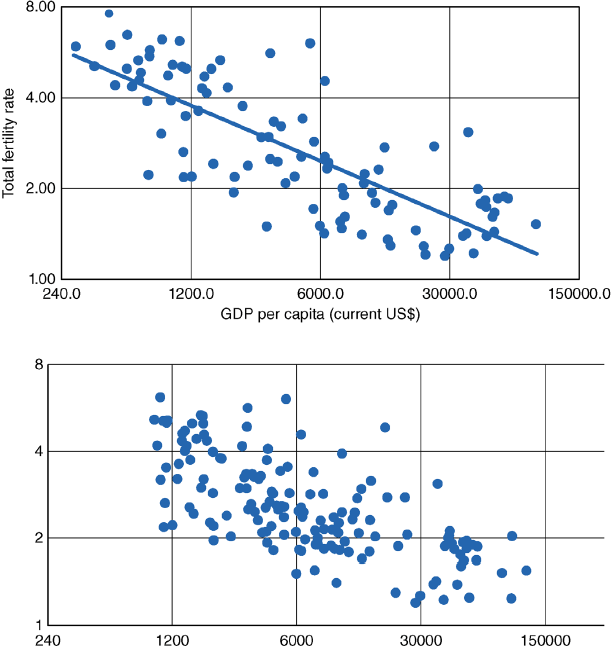
Figure 1.2 The relationship between fertility rate and per capita income in selected countries
Data Source: U.S. Census Bureau and the World Bank, 2015.
I have already mentioned that a decline in infant mortality is one reason why family size has decreased; the other reason is the availability of modern contraceptives. These are the two key factors behind the decline of fertility rates in middle-income countries (with per capita income between US$5,000 and US$20,000) and high-income countries. However, there is not a huge difference between high-income countries and middle-income countries in terms of infant mortality rate and access to contraceptives. One would therefore expect that as a country moves from middle-income to affluent status, the fertility rate should stabilize. What is surprising is that when a middle-income country moves up the economic ladder to become a high-income country, its fertility rate typically continues to drop.
Some high-income countries (and China) have a fertility level below 1.5, an ultra-low level. A 1.5 fertility rate means that each generation is 25% smaller than the previous one, which is clearly not sustainable in the long run. This has become a worrying social problem for many ultra-low-fertility countries, including Southern and Eastern European countries, as well as East Asian countries such as Japan, China, and Korea.
Factors behind Ultra-Low Fertility Rates
First of all, in high-income countries, education is highly valued but also very costly, so it becomes increasingly expensive to raise highly educated offspring. The vast majority of people out there wish not only to be parents, but to also be good parents. And, as a result, will avoid having children unless they are certain that they can assure their children a high-quality education. According to a report published in the Wall Street Journal in 2010, the cost of raising a child up until the age of 18 years in the United States is US$222,360, which is four times higher than the average annual income. This figure does not include college tuition. In rich Asian countries, where parents typically put a great deal of emphasis on their children's education, the cost is even higher, because parents usually not only pay for college tuition, but also invest a significant amount of money in tutoring, in order to give their children a competitive advantage in college admission.
Secondly, as a country transitions to a more service-oriented and innovation-driven economy, the education level and labor force participation rate of women increases steadily. In many countries, the college enrollment rate for women is on a par with or higher than that of men (Figure 1.3). In the United States and the United Kingdom, the number of female college graduates is almost 40% higher than that of men. China, though still a middle-income country, also has a higher number of female college graduates than men; moreover, the female labor force participation rate for urban Chinese women is over 60%, which is very high by international standards (Figure 1.4). Naturally, the more time women invest in education and career advancement, the less time they have for raising offspring.
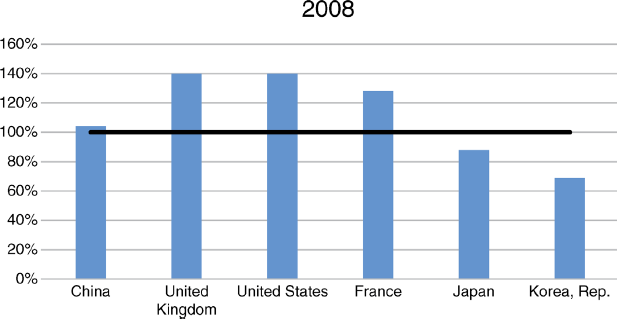
Figure 1.3 The ratio of female college students to male college graduates in selected countries
Data Source: World Bank, 2015.
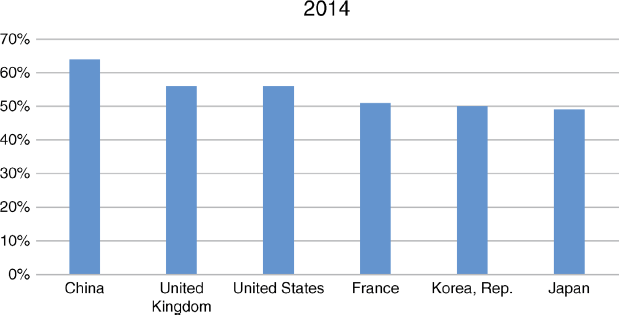
Figure 1.4 Female labor force participation rate (% of female population aged 15+)
Data Source: World Bank, 2015.
In economies based primarily on agriculture, support in old age is one of the main reasons for raising children. Because agricultural work is physically intensive, it is impossible to maintain productivity levels later in life. Having replacement labor available is an important consideration. In contrast, in high-income countries, the elderly rely mostly on their savings and public pension. Children do not, generally, contribute much to supporting their parents, even though they themselves are increasingly costly to raise. Despite governments providing free primary and secondary education, raising highly educated children still requires both considerable time and effort, as well as financial resources. So, from a financial point of view, raising children in a modern economy generates a negative return. Therefore, when high-income countries offer generous pension and medical benefits, the incentive to have children for support in old age decreases.
Lastly, the modern urban lifestyle offers many entertainment and leisure activities, leaving people with less time for raising children. For this and the other reasons mentioned above, it has become a general trend that urban young adults are delaying marriage as well as starting a family at a later age. Some even choose not to have any children, or to remain single for life.
World's Population Forecast by Country
The United Nations, the U.S. census, and the World Bank have all published various population forecasts. Though their assumption and forecast numbers are slightly different, the general patterns and trends are similar. The United Nations forecasts that the world population will continue to grow, but at a slower rate compared with the recent past. Ten years ago, the world population was growing by 1.24% per year. Today, its growth is 1.18% per year, or approximately 83 million people annually.
Most reports forecast that the world's population will grow to over 8 billion by 2030, and to 9 billion by 2050, peaking late this century or early 2100 at around 10 billion. The population ranking of countries will change. India and China will continue to be the world's most populous countries (each has roughly 18–20% of the world's population). However, it is expected that India will exceed China's population in just five years. Among the current top 10 most populous countries, five of them are in Asia (Bangladesh, India, China, Indonesia, and Pakistan), two in Latin America (Brazil and Mexico), one in Africa (Nigeria), one in North America (the United States), and one in Europe (Russia). Of those top 10 countries, Nigeria has the highest population growth rate, and will surpass the United States to be the third most populous country in the world by 2050. The following six countries are expected to have a population of over 300 million by 2050: India, China, Nigeria, the United States, Pakistan, and Indonesia (Figure 1.5).
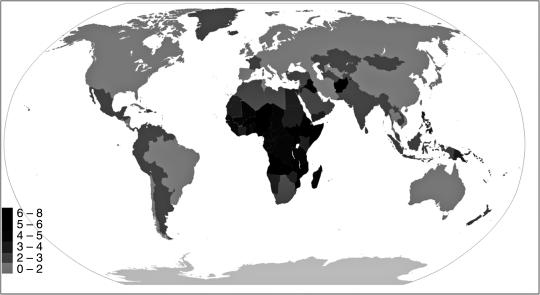
Figure 1.5 Fertility map of the world
Data Source: Central Intelligence Agency, 2015.
Least Developed Countries and Africa
According to the United Nations' World Population Prospects: 2015 Revision report, the 48 LDCs as a whole still have a high total fertility (4.3 children per woman in 2010–2015) and fast growing populations, with an average growth rate of 2.4% per year. Although this rate of population increase is expected to slow significantly over the next decade, the population of the LDCs (954 million in 2015) is projected to increase by 39% between 2015 and 2030, and to double to 1.9 billion people by mid-century.
There are 54 countries in Africa, and six of them have a population of over 50 million (Nigeria: 182 million, Ethiopia: 100 million, Egypt: 92 million, Congo: 77 million, Tanzania: 53 million, South Africa: 54 million). The highest rates of fertility among LDCs can be found in Africa.
The fertility rates of selected countries in 2014 were as follows:
- Angola: 6.1
- Burundi: 5.9
- Burkina Faso: 5.5
- Chad: 6.2
- Congo, Dem. Rep.: 6.0
- Egypt: 3.3
- Gambia: 5.7
- Mali: 6.2
- Malawi: 5.1
- Mozambique: 5.4
- Nigeria: 5.7
- Niger: 7.6
- Somalia: 6.5
- Zambia: 5.4
The current total population in Africa represents only one-seventh of the world's population, but because of its very high fertility rate, the continent's population size and share of the world's population are growing exceptionally quickly. From 2010 to 2015, the population in Africa grew by 2.5% each year. From 2015 to 2050, Africa is expected to account for more than half of the world's population growth. During this period, the populations of 28 African countries are projected to more than double. By 2100 the population of many countries, including Nigeria, will be five times larger. At the same time, the population of Africa is the youngest in the world, with children under the age of 15 accounting for 41% of the population in 2015 and individuals aged 15 to 24 accounting for a further 19% of the population.
By 2050, Africa's population will make up 25% of the world's population (currently only 14%); by 2100, Africa's population will make up 40% of the world's population, amounting to over 4 billion people. However, not all countries in Africa have high fertility rates. The wealthier, more developed Southern African countries, including South Africa, have a fertility rate of 2.3, only slightly above the replacement level.
Other Developing Countries
After the end of the Second World War, the population in developing countries experienced a very high growth rate. Between the 1950s and the 1980s, the population in developing countries grew by 95% while in the same period the population in developed countries grew by only 36%. The rapid growth in this period for developing countries was the result of declining mortality rates and still-high fertility rates between the 1950s and the 1980s.
Following the end of the war, the mortality rate fell sharply as a result of improvements in health care, including access to medical technologies and particularly modern immunization technologies, which reduced the incidence of—or outright eliminated—many infectious diseases. By 1960, the mortality rate in developing countries dropped to 17‰, and by late 1970 to 12‰.
The birth rate, however, only started to decline later. During the mid-1960s, the birth rate in developing countries was very high at 40‰, and only started to decline in the late 1960s. Between 1970 and 1990, the birth rate dropped from 37‰ to 30‰, and continues to drop today. Most countries have a fertility rate between 2 and 3, and some countries such as Vietnam, Iran, and Thailand have a below-replacement-level fertility rate.
The following are the fertility rates of selected developing countries in 2014:
- Turkey: 2.1
- Argentina: 2.3
- Mexico: 2.2
- Iran: 1.7
- Pakistan: 3.6
- Bangladesh: 2.2
- Indonesia: 2.5
- Vietnam: 2.0
- Philippines: 3.0
- Thailand: 1.5
Emerging Countries
Emerging countries here refers to those countries that are significantly poorer than developed countries, but are catching up rapidly economically. In the past, the four “Asian Tigers”—Korea, Singapore, Hong Kong, and Taiwan—experienced very high growth rates. Today, these countries have gone on to join the club of developed countries; consequently, they currently all have an ultra-low fertility rate (lower than 1.5).
During the early 2000s, when commodity prices were high, many resource-rich countries, together with China and India, were considered to be emerging countries. The largest emerging countries—Brazil, Russia, India, and China—are referred to as the BRIC economies. The fertility rates of BRIC countries are as follows:
- China: 1.3
- Russia: 1.7
- Brazil: 1.8
- India: 2.5
The general negative relationship between income and fertility rate still holds true here. Of the four countries, India was the poorest with the highest fertility rate, but its fertility rate has already dropped sharply compared with the previous 10 years. China, which is much richer than India, has the lowest fertility rate. Recently, the Chinese government changed its “one-child policy” to a “two-child policy” in an effort to boost fertility. However, the natural fertility rate in China, given its cultural and economic environment, will be similar to that of Korea and Japan, and will likely remain at an ultra-low level (<1.5) without any further policy intervention. I will discuss this topic in detail in Chapter 7.
The BRIC countries are diverse. Russia and Brazil, though rich in resources, suffered greatly after commodity prices collapsed in the mid-2010s. Only India and China's economy experienced continued growth. India's economy grew by 9% in 2016; it is likely to remain the fastest growing major economy in the world. Because of this, it is projected that its fertility rate will continue to drop.
Developed Countries
After the Second World War, and perhaps in direct response to the trauma of it, most developed countries experienced a baby boom with rapid population growth. However, soon after, the fertility rates fell. The United States experienced the biggest and longest baby boom period, between 1945 and 1965. Europe had a smaller and shorter baby boom, while Japan had almost no baby boom period, with the fertility rate declining immediately after the end of the war. By 1980, all developed countries entered a period of slower population growth. Presently, several countries, such as Japan, have a shrinking population.
Currently, no major developed countries have a fertility rate higher than the 2.1 replacement level. The countries with the highest fertility rate are France, the United Kingdom, Australia, and the United States, where fertility rates are slightly below the replacement level. The following are the fertility rates of the selected major developed countries:
- France: 2.01
- United Kingdom: 1.92
- Australia: 1.92
- United States: 1.87
- Canada: 1.61
- Italy: 1.43
- Japan: 1.43
- Germany: 1.38
- Korea: 1.19
Most developed countries have realized that low fertility is detrimental to economic development, and have implemented various pro-fertility policies with varying degrees of success. I will show in later chapters that Japan and Southern European countries seem to be in an ultra-low-fertility trap; as a result, their economies are likely to suffer in the near future.
Religion, Culture, and Fertility Rates
Culture and religion can also affect fertility rates. Figure 1.6 shows the relationship between fertility rate, income, and culture. From top to bottom, three regression lines show the relationship between fertility and income, respectively, for predominantly Muslim countries, for all countries, and for East Asian countries. (Predominantly Muslim countries are defined as those countries with a Muslim population that is more than 50% of the total population.) The negative relationship between fertility and income is robust, as all three regression lines are downward sloping.
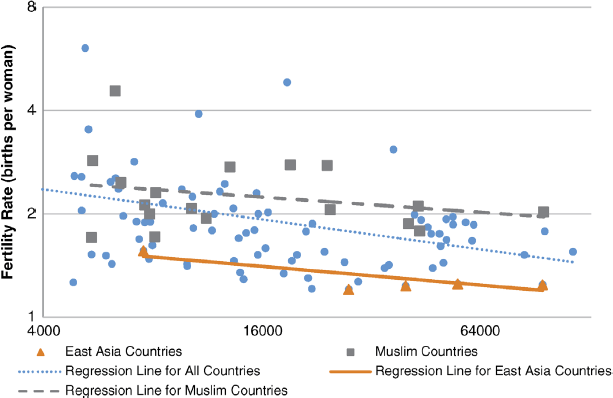
Figure 1.6 Relationship between religion/culture and fertility rate
Data Source: World Bank, 2015.
However, the regression line of predominantly Muslim countries is positioned higher than the regression line of all countries; in contrast, the regression line of East Asian countries such as Korea, Japan, China, and Vietnam is positioned lower than the regression line of all countries, and much lower than that of predominantly Muslim countries. In plain English, Muslim countries have higher fertility rates than other countries at the same level of income; countries in East Asia have lower fertility rates than other countries at the same level of income. The differences are quite striking. On average, at the same level of income, a Muslim woman produces 0.5 more babies than average, whereas an East Asian woman produces 0.5 fewer babies than average. This pattern, if it persists for several generations, will have huge implications for the long-term cultural and religious makeup of the world.
The West and Christian Countries
Predominantly Christian countries include most of the countries in Europe and the Americas, with populous countries such as the United States, Brazil, and Mexico. The West refers to European countries and affluent New World countries including the United States, Canada, and Australia. These Western nations were pioneers in industrialization and modernization; they are high-income countries whose population has expanded rapidly over the last 200 years, surpassing China around the turn of the last century. However, China overtook them when the country experienced a population explosion in the 1970s. Both the West and China are currently experiencing very low fertility rates, and they will be overtaken by India and the Islamic culture later in this century.
Predominantly Christian countries include the West and non-West Christian countries (mostly Latin America). According to a report issued in April 2015 by the Pew Research Center, as of 2010, Christianity had an estimated 2.2 billion adherents, nearly a third (31%) of the 6.9 billion people on earth. Islam was second, with 1.6 billion adherents, or 23% of the global population.
Muslim Countries
Predominantly Muslim countries comprise more than 50 countries around the world. Generally, they are poor countries, and have higher fertility rates than countries with the same level of economic development. The reason is that Islamic women have lower education levels and lower workforce participation rate when compared to other cultures. As a result, Muslim populations have grown much faster than the world average.
From 2010 to 2050, the world's total population is expected to rise to 9 billion, a 30% increase from today's level. During this same period, Muslims—a comparatively youthful population with high fertility rates—are projected to increase by 70%. In contrast, the number of Christians is projected to rise by 30%. If current demographic trends continue, the Muslim population will be as large as the Christian population by the late twenty-first century.
Though Islamic countries in general have a high fertility rate, Iran is an exception. Like many other developing countries, Iran's fertility rate was high between the 1950s and 1980s. But during the 1990s, as the country become richer, the fertility rate started to drop rapidly; by 2000, its fertility rate dropped below the replacement level. Recently, Iran started to implement a pro-fertility policy.
Recently, a growing number of Muslims have migrated to Europe. France, for example, has a significant number of Muslims from former French colonies, while Germany has many Muslim immigrants from Turkey. The Muslim population depending on various estimates currently accounts for 5–10% of the population in France and Germany. Muslim immigrants have a much higher fertility rate than non-Muslims. In France, for example, the fertility rate of Muslims (2.8) is 40% higher than non-Muslims (1.9). The difference in fertility rate means that the share of the Muslim population in France will double in two generations. This has generated many concerns about the Islamification of Europe. As discussed the higher fertility of Muslims is due to low level of education and workforce participation among women. The big question is whether Muslim women of Europe (and the world) will, given the opportunity, choose education and career over children and family in the future. We will elaborate on this topic in Chapter 9.
If we compare the major religions and cultures around the world, by 2100 Islam may possibly be the largest religion in terms of population as shown in Figure 1.7.
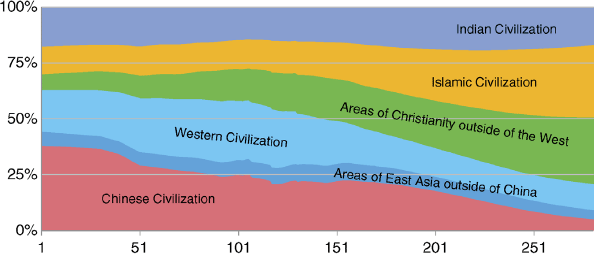
Figure 1.7 The relative population ratio of major world religions and cultures
Data Source: 1820–1950 data for China from Zhao and Xie (1988). 1950–2100 data for China estimated from the 6th National Population Census. The rest of the data is from United Nations, Department of Economic and Social Affairs, Population Division (2008). World Population Prospects: The 2008 Revision.
East Asian Countries
The countries in East Asia include Japan, Korea, China, Singapore, Taiwan, and Hong Kong. The people in these countries, either today or historically, were influenced by Confucian philosophy and Chinese written language. The ultra-low fertility rate in East Asia is closely connected with a culture that values education and the pouring of energy into offspring, which is consistent with the traditional Confucian teachings. Amy Chua, author of the popular book Battle Hymn of the Tiger Mother (Chua, 2011), is Chinese American and famous for raising her children in “the Chinese way.” Like her, many Asian American parents spend a lot of time and effort on parenting, in order to push their children to enter top-ranking colleges. This style of intensive parenting prevents them from having sufficient resources or time to raise a large number of children. As a result, Asian Americans have the lowest fertility rates among minorities in the United States. Similarly, in East Asian countries such as South Korea, Japan, and China, where college entrance examinations are fiercely competitive, parents spend not only a lot of energy on their children's homework but also a lot of money on cram schools, which are big business in these countries. East Asian parents seem to care more about the quality of the upbringing of their children than their number. As a result, East Asian countries have the world's lowest fertility rates.
The fertility rates of several East Asian regions are as follows:
- Mainland China: 1.24
- Taiwan and China: 1.07
- Hong Kong and China: 1.12
- Japan: 1.43
- Singapore: 1.19
- Korea: 1.19
Notes: Data regarding mainland China is from the National Bureau of Statistics of China; data regarding Taiwan is from Taiwan's Ministry of the Interior; data pertaining to all other countries and regions is from the World Bank.
Out-of-Wedlock Births
In most East Asian countries, out-of-wedlock birth is still a social taboo. The percentage of out-of-wedlock births in Japan and South Korea is only 2% and 2.1%, respectively, while the percentage of out-of-wedlock births in European countries is above 20%. The percentage of out-of-wedlock births in Nordic countries is nearly 50%. A very low out-of-wedlock birth rate in Asian countries would not be a problem if almost every woman got married but, in recent decades, many women have chosen not to marry or enter into a stable partnership. For example, 60% of women under the age of 30 in Japan are unmarried, and 32% of women aged 30–34 are unmarried. Assuming that 20% of women remain unmarried and therefore childless for life, and each married woman has two children on average, the total fertility rate will be only (1 − 20%) × 2 = 1.6.
The low fertility rate in East Asian countries will result in a rapid decline of their share of the world's population. Although East Asia (primarily driven by China's huge population) was the most populous region throughout most of the last millennia, it will soon be surpassed by other regions in the next few decades.
Aging Trends
The population of the world is generally becoming older as a result of low fertility rates and higher life expectancy. According to the U.S. census report on aging, in 2015 the elderly (age > 60) accounted for 8.5% of the world's population. By 2030 it is projected that the number will grow by 50%, representing about 12% of the world's population. By 2050 the percentage will be over 15%, and will continue to increase (Figure 1.8). Japan and Korea will be the “oldest” countries in the world, with a median age of 53 by 2050. Several countries in Europe with ultra-low fertility rates—such as Germany, Italy, and Spain—will also have a median age of over 50 by 2050, which is 7–10 years older than it was in 2010. By 2050 China will have a median age of 46, which is 9 years older than it is today.
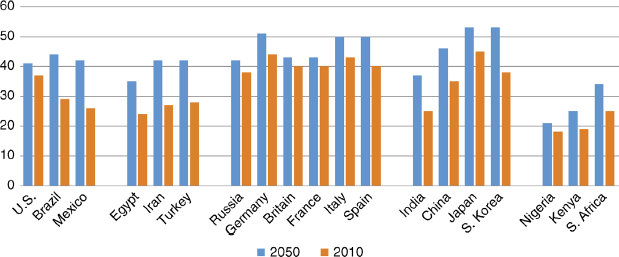
Figure 1.8 Median age forecast between 2010 and 2050
Data Source: United Nations, Department of Economic and Social Affairs, Population Division (2014). World Population Prospects: The 2012 Revision, Methodology of the United Nations Population Estimates and Projections, Working Paper No. ESA/P/WP.235.
The old-age dependency ratio measures the number of elderly people (age 65+) per working-age person (age 16–64). The old-age dependency ratio of Japan is expected to increase from 36% in 2010 to 72% in 2050, which will be the highest in the world (Figure 1.9). In 2050 Korea will have an old-age dependency ratio of 66%, four times larger than its 2010 ratio. Germany, Italy, and Spain will also have an old-age dependency ratio of over 60%, while China will have an old-age dependency ratio of over 40%, more than three times today's ratio.
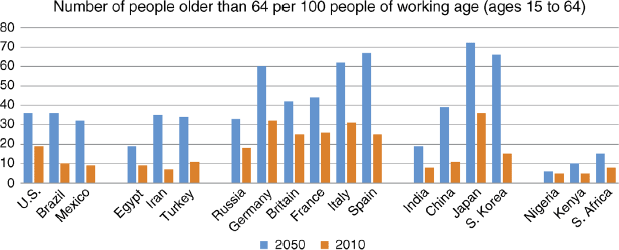
Figure 1.9 Old-age dependency ratios between 2010 and 2050
Data Source: United Nations, Department of Economic and Social Affairs, Population Division (2014). World Population Prospects: The 2012 Revision, Methodology of the United Nations Population Estimates and Projections, Working Paper No. ESA/P/WP.235.
Countries with an aging population and ultra-low fertility rates, such as Japan, Korea, China, Germany, Italy, and Spain, will face negative economic impacts. I will analyze the effects of an aging population in more detail in later chapters.
Urbanization
Another major trend in demographics is that with economic development, more people are living in cities (Figure 1.10). In 2008, more than 50% of the global population lived in a city. That number was only 30% in the 1950s. By 2050, more than 70% of the world's population will live in a city. In developed countries, almost 90% of the population will live in a city. This is a direct result of the growth of the industrial and services sector, relative to agriculture.
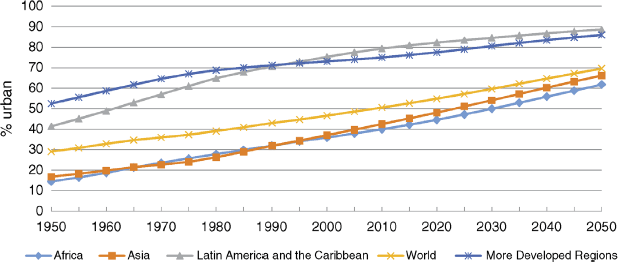
Figure 1.10 Percentage of the population living in urban areas by region between 1950 and 2050
Data Source: United Nations, Department of Economic and Social Affairs, Population Division (2008). World Urbanization Prospects: The 2007 Revision.
People are not just moving to cities, they gravitate to large cities. The growth of large cities is much quicker than that of smaller ones. People, especially high-skill workers, are attracted to large cities for a variety of reasons. One reason is that large cities have the economies of scale to provide better public services. But, more importantly, bigger cities have advantages in terms of generating innovations. I will discuss the relationship between innovation and large cities in later chapters.
Table 1.1 lists the population of the 10 largest cities in the world as of 2016. The largest metropolitan area is Tokyo with 37 million people, which is about a third of the total population of Japan. Even though the Japanese population is shrinking, the population in Tokyo is still growing. The largest cities in China are Beijing and Shanghai; their populations have doubled over the last 30 years, despite the tough policies of the Chinese government that restrict people from moving to large cities. The population of Shanghai and Beijing would have been much larger without such anti-migration policies. In the United States, the growth rate of New York, Los Angeles, and San Francisco is much faster than that of smaller cities. As a result, over the last 20–30 years, real-estate prices have increased significantly in these cities due to increasing demand and limited supply. Despite this higher cost of living, large cities continue to attract many highly educated young people and immigrants, making them centers of innovation and entrepreneurship.
Table 1.1 Top 10 largest cities in 2016
Data Source: Demographia World Urban Areas (12th edn). Retrieved November 17, 2016.
| Rank | City | Country | Population |
| 1 | Tokyo–Yokohama | Japan | 37,750,000 |
| 2 | Jakarta | Indonesia | 31,320,000 |
| 3 | Delhi | India | 25,735,000 |
| 4 | Manila | Philippines | 22,930,000 |
| 5 | New York | United States | 20,685,000 |
| 6 | Seoul–Gyeonggi–Incheon | South Korea | 23,575,000 |
| 7 | Shanghai | China | 22,685,000 |
| 8 | Karachi | Pakistan | 22,825,000 |
| 9 | Beijing | China | 20,390,000 |
| 10 | Guangzhou–Foshan (Guangfo) | China | 18,760,000 |
The metropolization of the world will be another potential fertility killer, as people in large cities have fewer children due to the high cost of living, the high pressures and time required to succeed in city careers, as well as urban lifestyles not necessarily encouraging the prioritization of procreation. Large cities in Asia, such as Beijing, Shanghai, Hong Kong, and Taipei, have the lowest levels of fertility in the world. In addition to metropolization, other social and technological trends are likely to reduce fertility further than projected by earlier forecasts. Women, with better education and jobs, are more independent than ever. The advent of modern entertainment, particularly computer gaming, is capturing an increasing share of young people's leisure time. The great demographic shift is just beginning, and is likely to be more dramatic than anticipated.