Chapter 3
Demographics and the Economy
In the previous chapter, I discussed the impact of demographic factors on innovation. In this chapter, I will analyze how demographics affect the many other aspects of an economy—including employment and old-age support.
Low Fertility and Old-Age Support
The demographic impact on old-age support is the most frequently mentioned effect of a low fertility rate. Holding the output of each worker constant, an increase in the number of the elderly or children relative to the number of workers will result in a decrease in output per capita and lower economic growth.
In traditional societies, children support their parents in their old age. In modern societies, private savings and public pensions are the main sources of support. A large portion of the fiscal revenue in developed countries is used to provide old-age support, including both direct pension payments as well as medical benefits. The public expenditure to support the elderly is financed via taxes collected from the younger, currently employed, generation. Therefore, in an aging society, as government expenditure to support the elderly increases, the tax burden and the fiscal deficit also rise. Figure 3.1 shows the relationship between aging and public expenditure as a percentage of GDP. As expected, the higher a country's dependency ratio is, the higher its public expenditure is as a share of GDP.
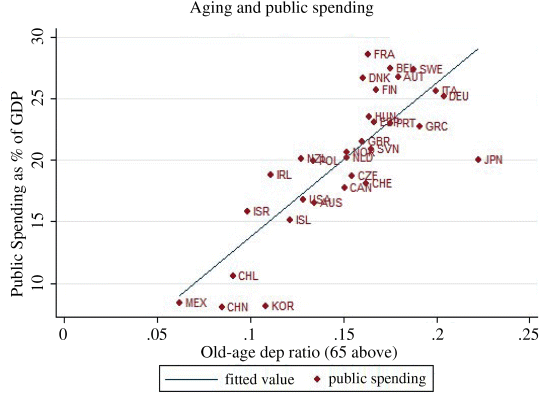
Figure 3.1 Aging and public spending
Data Source: World Bank, 2015.
To meet the growing demand for old-age support, governments have several options:
- Raise taxes.
- Increase deficits.
- Reduce benefits for the elderly.
- Delay the retirement age.
Raising taxes reduces the vitality of the economy, especially the vitality of the young entrepreneurial class. Increasing the deficit simply delays the problem, because the deficit will eventually have to be paid back through higher taxes. Reducing benefits for the elderly is typically political suicidal in an aging society, because older voters exert strong political influence.
Extending the retirement age is a popular solution to reduce the burden of old-age support. For developing countries, such as China, the retirement age will have to be raised significantly from the current level. Over the last few decades, life expectancy in China has increased from 60 to 75 years; as a result, the current retirement age of 55 is unsustainable. In Japan, the retirement age has risen from 55 to 65 years, but this is still not enough as life expectancy (currently at 80) continues to increase. The Japanese government can barely afford the enormous expense of old-age support, and its debt level is among the highest of all the wealthy countries, having reached 240% of its GDP. Japan is likely to increase the retirement age again to 70 years in the near future.
Many people think that since the average lifespan has exceeded 80, and the elderly are healthier than ever before, working until 70 is not a serious problem and may well be beneficial. Certainly the fiscal problem of old-age support can largely be solved simply by raising the retirement age. However, there is a side effect of having an increasing number of older people in the workforce. When the political power and resources are shifted to older workers, the vitality of the younger generations is blocked, and the whole society becomes more conservative. Consequently, innovation and entrepreneurship inevitably suffer. I, and many other scholars, believe that this negative effect of an aging workforce was the main culprit for Japan's economic problems in “the lost decades,” as explained in Chapter 2. I will examine this topic in detail in Chapter 6.
Low Fertility and Demographic Dividend/Deficit
Low fertility rates can generate a demographic dividend, but only in the short run. A demographic dividend is commonly measured by the dependency ratio, which is the number of dependents—including children and the elderly (age < 15 and age > 65)—per working-age person (age 16–64). The lower the dependency ratio is, the fewer children and older people need to be supported by each worker; hence, the higher is per capita income, resulting in a so-called demographic dividend.
China is a good case study, as its one-child policy caused an abrupt change in fertility and dependency ratio over the last 30 years. From 1985 to 2015, the number of children decreased rapidly as a result of the one-child policy, and the dependency ratio dropped from 44% to 37%. The Chinese economy has enjoyed a large demographic dividend in the last 20 years but this is beneficial only temporarily, as fewer children today will mean fewer workers 20 to 30 years later. By 2015, the number of workers peaked and the demographic dividend and dependency ratio reversed in China. From 2015 to 2040, the dependency ratio will rise from 37% to 60%. The rise in the dependency ratio, especially the old-age dependency ratio, will impose a heavy burden on public finances for pensions and medical expenditures, which will inevitably lead to higher taxes or a higher retirement age. Unless strong policy decisions are made, this could drain government funding and negatively impact economic prosperity in China.
Can High Fertility Lower the Per Capita Asset Level?
Another frequently mentioned issue is the per capita asset/capital level. A low per capita asset/capital level can lower the productivity and per capita income of a country. A number of factors can lower the per capita asset/capital level in the short run, such as immigration and high fertility. Here, assets refer to real estate, equipment, and infrastructure, such as roads and airports. During a recent visit to China, a friend from India commented that although the population density of the coastal region in China is similar to that of India, public places such as airports, train stations, and department stores are much less crowded than in India. This is because, although China is still a developing country, China's per capita asset level is much higher than that of other developing countries due to a very high investment level in assets and infrastructure over the last 20 years. If this visitor had come to China 30 years ago, he would have felt very differently, as the per capita level was much lower in China then. Airports and train stations in China in the 1980s were just as crowded as they are in India at present.
During public holidays, tourist attractions such as the Great Wall of China are very crowded. Some people attribute this to China's large population, but the real reason is the influx of visitors to these attractions during public holidays. For most workers in China, paid vacations are concentrated around the Chinese New Year and a few other national public holidays. Consequently, tourist attractions receive most of their visitors during these times, and are far less busy throughout the rest of the year. The tourist attractions have no financial incentive to expand facilities that would be underutilized for most of the year.
People often use a shoulder-to-shoulder image of the crowded Great Wall of China to illustrate the negative effect of a large population. In reality, a growing population is actually good for tourism development, because, in the long run, higher demand will lead to more investment to build more and better attractions. Historically, China was able to afford such magnificent projects—such as the Forbidden City and the Great Wall—because of its large population. Today, as travel demands increase, new sections of the Great Wall of China are being developed for tourism (Figure 3.2).

Figure 3.2 The Great Wall of China
Source: A picture of the Great Wall during the May Day holiday in 2016, taken by Jiaojiao Liu.
In that light, the negative relationship between population and per capita assets is short term. In the long run, more assets will ultimately be created by a larger number of people. The per capita asset level is not related to the size of the population, but is rather connected to the saving/investment rate. Moreover, there is an economy of scale in public investment in infrastructure. A common criticism of immigrants is that they make the roads more crowded, but with enough commuting demand, more roads and subways can be built. It is not a coincidence that the largest cities in the world often have the most efficient and densest public transportation systems.
I recently visited the island of Hawaii. Owing to its sparse population, the main roads of the island are four-lane roads along the coast. The average resident needs to drive 45 minutes to get to work. I asked a hotel worker why she did not live closer to the hotel. She said that the entire island only had one middle school, but the hotels were spread out. A few years ago, the government considered building an expressway, but could not afford to do so because of the low population density. The situation in Hainan Island, China, is quite different. Hainan Island is a popular tropical beach resort, similar to Hawaii. Although only twice the size of Hawaii, its population is five times larger and the number of visitors it receives (mostly from China) is six times greater than that of Hawaii. Owing to a higher density of residents and tourists, Hainan Island can afford to build a highway network and, more recently, a high-speed railway around the island.
To sum up, the per capita asset level is not related to the population in the long run, because assets are created by investment that is funded by savings. In the long run, the saving/investment rate and productivity determines the per capita asset level. Typically, high-growth countries such as China also have a high savings rate; as a result, these countries will eventually match high-income countries in terms of per capita asset level.
The assets discussed here exclude natural resources. Obviously, a higher population will lower the per capita level of land and other natural resources. In theory, this could lead to a decline in productivity. I will discuss the topic of natural resources in the next chapter. Today, one common argument against population increases (such as a greater number of immigrants being permitted to settle in a country) is that the additional population numbers will have a negative impact on the availability of public resources such as roads, hospitals, and so on. This argument is not defensible. Public resources are not natural resources, and particularly over the long term are created by the savings/investments of the population.
Can High Fertility Cause Unemployment?
There is a myth that a larger number of people in any given country will lead to higher unemployment figures. This is obviously based on the incorrect assumption that the number of jobs is fixed. Such an assumption could hold true in the context of a very short time span, because some jobs require some sort of capital investment. For example, waiters need to work in a restaurant, which cannot be built overnight. However, as more people demand restaurant services, restaurants will be built. Not only will there be more waiter/waitress jobs, but also more construction jobs, more maintenance jobs, and so on. Jobs are fueled by people, and jobs fuel other jobs. That is the basis of all economic growth.
Unless heavily regulated, the job market, particularly in countries with large populations, is very flexible and can adjust quickly to changes in wage levels. If there are temporarily more people who want restaurant jobs, the wages for waiters will go down, and restaurants will be able to hire more workers to expand or extend their business. Moreover, in a global market, low wages in one sector can often find an output market internationally. Following the reforms in China during the 1980s, there was a massive surplus of migrant workers. Instead of creating massive unemployment, the surplus workers kept wages low, and turned the Chinese manufacturing industry into an export powerhouse.
In sum, when more people enter the labor market, although it creates additional labor supply, it also creates more demand, and therefore more jobs. When an economy is open to international trade and has a flexible labor market, the presence of more people does not lead to higher unemployment. In fact, many low-fertility countries, such as Russia and Spain, have higher unemployment levels, as illustrated in Figure 3.3. Most economists agree that high unemployment is a result of inflexible labor markets and wage structures, not overpopulation. For example, high unemployment occurs when the minimum wage is too high, or when the unemployment benefits are too generous, or when firms are reluctant to hire permanent workers because labor laws make it difficult to let those who are unnecessary or unproductive go.
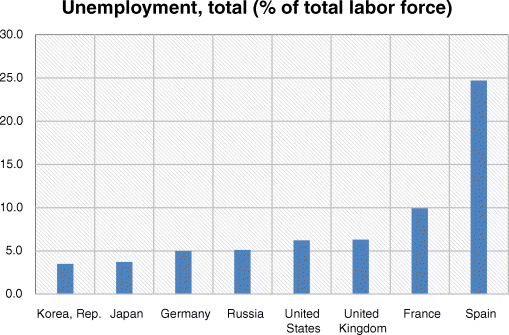
Figure 3.3 Unemployment rates of selected countries (2014)
Data Source: International Labour Organization, Key Indicators of the Labour Market database, World Bank, 2014.
The effect of immigration on unemployment is similar to that of high fertility. There is no evidence that immigration causes unemployment. On the contrary, immigrants, not being part of the established society or economic networks and often with little to lose, tend to be more entrepreneurial on average than the native population. Cities and regions that attract large numbers of immigrants typically tend to be more vibrant and have low unemployment rates. Recently, public opinion in both Europe and the United States has turned against immigrants. U.S. President Donald Trump wants to reduce the number of immigrants. Immigration is a complicated demographic issue, which has implications for inequality and most importantly for innovation capacity. I will examine immigration policy in detail in Chapter 5.
Robots, Unemployment, and Innovation
As artificial intelligence (AI) and robotic technology advances, a common concern is that robots will take the jobs away from humans. Yet historically, progress in automation and technology has simply led to the replacement of old jobs with new jobs. Many agricultural and manufacturing jobs were rendered obsolete by machines, but many service jobs have been created in turn. This time, many experts say that things will be different, because even service jobs such as drivers are in danger, and so are some professional jobs such as lawyers and doctors.
Unemployment as a result of a totally automated economy is not an economic problem. Would it not be a good thing if only a small number of highly skilled, creative workers needed to work three days a week, while the rest of the population could play all day whilst maintaining the same level of consumption and enjoying a better quality of life? Rather, it could be a social problem, because some (perhaps many) people would feel unneeded, unable to derive their self-worth from contributing to something. It could also be a political problem, with most voters not being tax payers. We should really call the problem “too much leisure,” instead of unemployment. But even this scenario is unlikely, because in the short run, a large number of service jobs would be generated in an economy. In the long run, even when most routine jobs are automated, there will still be many jobs connected to innovation.
First of all, service jobs are nowhere near replaceable by robot technology as it exists today. The computer may be able to beat humans at chess, but mechanical hands are still far away from the dexterity of human hands. In my estimate, it will be at least 30 years before a robot can do simple house cleaning jobs or replace airline stewards; even a driverless car is at least 10 years away from widespread use, because of legal and implementation issues. So, in the near future, service jobs will continue to grow rapidly, more than enough to offset the reduction in manufacturing jobs.
Second, even though computers can do some of the analytical work done by professional workers such as reporters, stock analysts, even lawyers and doctors, computers are more likely to make professional workers more productive rather than replacing them. Social interaction is and will remain an essential part of many professional jobs. It is hard to imagine a robot lawyer representing a defendant, because lawyers still need to make moral arguments and empathetic connections with human jurors (although, of course, AI can help with the analysis of cases).
Lastly, innovation-related jobs are likely to be reserved for humans. One reason for this is that it is probably too dangerous to allow non-sentient computers to innovate. Moreover, innovation frequently involves tastes, aesthetics, and moral judgments; for example, if the task is to evaluate a piece of music, a movie, or a new dish, we humans will probably always understand our needs better than robots.
To sum up, in the near future, there will be more service jobs. In the long run, there will be more innovation-related jobs. Some people say that innovation needs just a few smart people, not many people, but this clearly runs counter to the historical trend. As I have explained in Chapter 2, mankind has been devoting more human resources and capital to innovation, and there is no sign of this trend slowing down. Even though only a few successful innovations (including popular games and movies) make the vast majority of the profits, for every Google and blockbuster game, there are thousands of new startups trying to be next in line. All these new ideas are funded by personal savings and the massive venture capital industry. Moreover, in the future, more people will have the necessary skills and motivation to be involved in some kind of innovation activity, ranging from highly skilled jobs such as AI programming to less skilled jobs such as game testing and movie reviewing. More humans will have the necessary skills, partly because their analytical abilities will likely be enhanced by computers. More humans will have the motivation, because it is fun and rewarding to be involved in some kind of creative activity, even one as trivial as movie reviewing.
In the long run, innovation will not be just about solving a problem, but more about the exploring of the unknown. A person's taste for food and housing can be saturated, but humanity always has an appetite to explore new gadgets, new stories, new games, and new frontiers in space and elsewhere. The moment that human beings lose their appetite for exploration, human civilization will start to decline and eventually disappear. This, I am sure you will agree, would be a much bigger problem than “too much leisure.”
A Little Bit of Economic Science Fiction
I will use a little science fiction story to show that even with the arrival of robots, so long as young people have higher productivity or creativity than older people, more young people will raise the overall living standard significantly.
In 2100, robots have taken over almost all the jobs, even highly interactive jobs such as looking after the elderly. People live much longer, with the average life expectancy hovering at over 100 years. All products are very inexpensive and accessible and the only good remaining a luxury is long-distance travel, which now includes space travel.
Let's build a simple economic model. Assume a person's daily consumption of goods and services requires the work of an average robot (unit), and each elderly person requires one extra robot to meet his/her health care needs. The main jobs for young people are managing robots, including developing, producing, and maintaining them. Assume that every worker can “manage” 10 robots. In addition to providing daily goods and services, robots also provide long-distance travel services (i.e. flying airplanes and space ships, managing space hotels, etc.).
Let's hypothetically compare two countries in the world, one called Greenstock and the other Whitestock. Whitestock has 1 billion elderly people, but due to a low fertility rate it has only 0.5 billion young people and 0.5 billion children; a total population of 2 billion. It needs 3 billion robots (2 + 1) to provide daily goods and services. These robots require 0.3 billion young people to manage them. The remaining 0.2 billion workers are managing 2 billion robots who are working in the travel industry, providing tourism services. On average, each person in Whitestock consumes one robot worth of travel services.
As for Greenstock, there are the same number of the elderly (1 billion) but, in contrast to Whitestock, Greenstock has a higher fertility rate; it has 1 billion young people and 1 billion children; a total population of 3 billion. The daily consumption of its citizens requires 4 billion robots (3 + 1), which require 0.4 billion workers to manage. That leaves 0.6 billion workers to manage 6 billion robots in the travel industry. On average, each person in Greenstock has two robots to provide long-distance travel services, compared with only one robot in Whitestock. Therefore, the per capita travel consumption is twice as high in Greenstock, and the overall market size of the travel industry is three times larger than Whitestock's.
The above model shows that, as long as older people require additional services from young workers, an aging country will have a lower consumption per capita in other goods and services, such as long-distance travel, thus lowering the standard of living. Moreover, there will be more deaths than births in Whitestock, and the demand for robots will shrink every year.
Most of the new demand for robots will come from Greenstock. Greenstock also has more workers devoted to the research and development of robots, and therefore has a much higher level of innovation and entrepreneurship than Whitestock. With a higher standard of living and vitality, Greenstock attracts talented young people from Whitestock who wish to migrate. This leads to Whitestock losing a significant portion of its already small young population, creating a vicious circle.
Impact of Aging on Different Industries
Entertainment and Tourism Industries
The entertainment and tourism industries are sunrise industries, because they address humanity's mental needs. Physical consumption, like the demand for food, clothing, or housing, is satiated after a certain point, but mental consumption is only limited by the availability of time. As people become wealthier, more and more time will be spent on entertainment and travel activities. Moreover, older people will have even more free time to pursue these activities. Therefore, even with an aging population, the travel and entertainment industries will have a growing share of the overall economy.
The travel industry will grow faster than the entertainment industry, because travel products are relatively more expensive. This is because productivity in the context of the travel industry is held back by the physical need to move a person from one place to another. In contrast, the digital entertainment industry can scale quickly, because digital products can be replicated at almost zero cost. The total size of the digital entertainment industry will grow at a slower pace, even though it will also take an increasing share of leisure time. As a whole, across all ages, people will have more time and money to spend on the entertainment and tourism industries.
Health Industry
The health care industry will also be a fast-growing industry in an aging society, because the elderly live longer and will spend more money in order to prolong their lives and try to maintain their quality of life as they age. The latest technological progress in gene technology has made health care one of the most vibrant industries for innovation. The U.S. health care industry is the most expensive among developed countries, and the least regulated. It is also the most dynamic and innovative, with the best quality of care available. The U.S. health care industry already accounts for 20% of total GDP in the United States, and that share is still growing.
For most countries, a large portion of health care expenditure comes from the government budget and from public pensions. As a country ages, the ever more costly medical benefit imposes a heavy burden on government budgets, and can be financed only by higher taxes or later retirement.
Financial Industry
The essence of the financial industry is the trading of labor outcomes across time. Children borrow wealth from their parents and society, and pay it back when they become adults in the form of taxes. Governments collect taxes from workers to provide a minimum guarantee for old-age support, as well as some level of medical care. In an aging society, old-age support is costly and governments are likely to reduce the pension benefits. As a result, more people increasingly rely on private savings/investments for old-age support, which leads to a more prosperous financial industry in an aging society.
As shown in Figure 3.4, during the early years of a career, people usually have negative savings because they need to borrow money to buy their first house and raise children. People typically start to save for their retirement when they reach middle age. The savings rate peaks between the ages of 40 and 60.
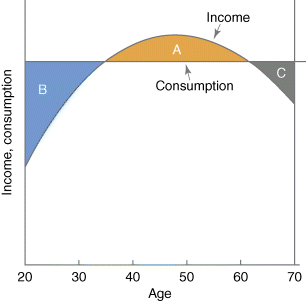
Figure 3.4 Relationship between income, consumption, and age
The sudden rise of China and its unique population size have exerted a significant influence on global capital markets. There is a bulge in the demographic pyramid of China. China's equivalent to the “baby boomer” generation of the West are those born between 1962 and 1991. The annual birth cohort size in China during this period was almost 40% larger than that in subsequent years, as a result of the strict enforcement of the one-child policy in the 1990s. From 1962 to 1990, there were, on average, 22 million births in China every year. In contrast, from 1991 to 2015, the average birth rate dropped to only 16 million births per year (Figure 3.5). This absolute and relative change in the birth cohort size is unprecedented. Many economists have not fully appreciated the economic impact of the one-child policy.
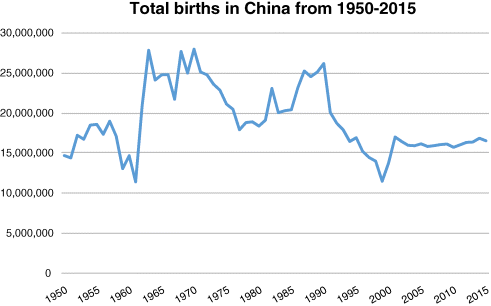
Figure 3.5 Total births in China from 1950 to 2015
Data Source: State Statistics Bureau, 2015.
Comparison between Chinese Baby Boomers and U.S. Baby Boomers
After 1991, when the one-child policy was strictly enforced, those Chinese born in the 1960s and 1970s typically had only one (or at most two) children and hence the economic burden of raising the young was not heavy. Moreover, with the rapid economic development of China during the last three decades, this generational cohort became affluent. Their rate of savings remained high as a result, which partly explains China's extraordinarily high savings rate over the last few decades. Let us do some simple calculations here. Typically, a person's savings peak around the age of 50. For the Chinese baby boomers born between 1961 and 1991, their peak savings years fall between 2012 and 2041. As shown in Figure 3.6, the household saving rate increased from 30% in 2002 to 40% in 2012; this is staggeringly high and very surprising, if one does not take into account the demographic factors.
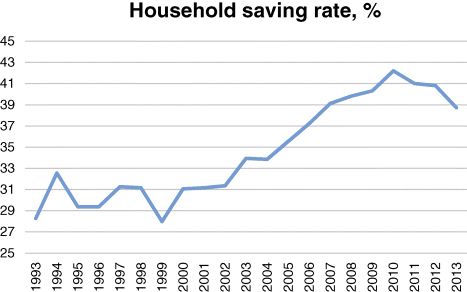
Figure 3.6 Household saving rate in China
Data Source: China National Bureau of Statistics, People's Bank of China, Haver Analytics, Barclays Research, 2013.
The Chinese saving rate will remain high until 2041, which will bring abundant capital into the international markets. Consequently, the real-estate industry and stock markets will continue to be very liquid, as China exports its excess savings. The Chinese baby boomers will need to invest their savings internationally, which means that they will need to rely on children in other countries for support as they age. This is the reason why it is inevitable that China will need to export a huge amount of capital to the world, which will fuel the price of capital and depress the interest rate for years to come. In recent years, the United States sold US$1.2 trillion of government debt to China. Macroeconomic theory suggests that a large capital outflow will inevitably lead to a large trade surplus. China's huge trade surplus can be partly explained by its unique demographics.
Real-Estate Industry
The real-estate sector is also heavily impacted by demographics. Although people from all age groups have housing demands, people generally buy homes between the ages of 30 and 45. People in most countries buy their first home around the age of 30, and switch to a larger home when they have children (Figure 3.7). By the age of 45, when their eldest child is about to go to college, they typically no longer require so much space and shy away from buying bigger homes. In fact, they tend to switch to a smaller home as their children leave the nest. Wealthy, older people may buy a second “vacation” home but generally, after the age of 45, people's housing demands tend to shrink.
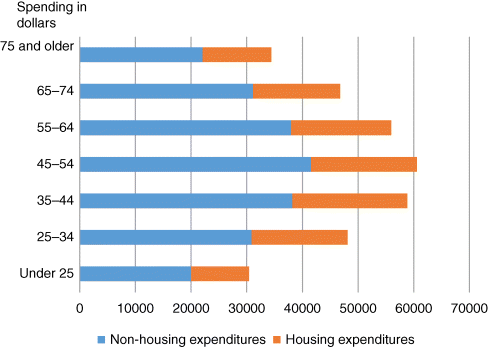
Figure 3.7 Housing and non-housing expenditures, by age of reference person (2013)
Data Source: U.S. Bureau of Labor Statistics, December 2015.
The baby boom generation in the United States was born between 1945 and 1964. Let's suppose that they buy homes between the ages of 30 and 45. We could extrapolate from this that there should be a housing boom between 2001 and 2005, followed by a decline in housing demand after 2006. In hindsight, the housing bubble and decline could have been predicted by the demographics; the subprime crisis was partly due to Wall Street's failure to fully take into account the demographics in forecasting housing market demand.
Japan is a developed country with no baby boom generation. Its birth rate began to decline rapidly after the Second World War. Given that the peak age of real-estate consumption is 45, we could have made a forecast that the housing demand in Japan would peak in the 1990s, which is consistent with the timing of the real-estate bubble bursting. Houses tend to have long lifespans, so the demand for new houses only comes from incremental housing demand. As we know, the total population of Japan is on the decline, so the incremental demand is actually zero or negative. The only exception is Tokyo, which is still growing due to the agglomeration effect. In all other cities, negative housing demand will keep the real-estate prices in Japan depressed for the foreseeable future.
Again let us apply the home-buying patterns described above to forecast the housing demand of the Chinese baby boomers. Since the Chinese baby boomers are a generation born between 1962 and 1990, housing demand in large Chinese cities will remain strong until at least the mid to late 2020s (not taking into account further agglomeration effects). Large cities, with vigorous innovation and entrepreneurship activities, will continue to attract the baby boomers, even after this period of time. While the real-estate market in China's first- and second-tier cities (top 30 cities) will remain strong, overall housing demand will peak in the mid to late 2020s and stagnate once this generation's housing demands begin to wane.
Manufacturing Industry
Most manufacturing industries—such as automobiles, furniture, clothing, household appliances, steel, and cement—are closely connected to the real-estate industry. Therefore, just as the real-estate industry is influenced by demographics, so many manufacturing industries will be similarly affected. Of course, not every manufacturing sector is the same, because manufacturing is a very broad concept. For example, aircraft manufacturing should, in my view, actually be classified as part of the tourism industry, and medical equipment manufacturing should be classified as part of the health industry. Generally speaking, for most large, durable commodities, the consumption pattern by age is similar to that of real estate (i.e. people buy most of their durable goods between the ages of 25 and 45). Consequently, as a country ages, the demand for durable goods will decrease.
Energy and Commodities
For energy and bulk commodities, the peak age of consumption is also from 25 to 45. China, as the largest consumer of energy and commodities, hit a demand inflection point around 2010, as the demand from its baby boomers reached the age of peak consumption (see Figure 3.8 for a graph depicting the trend in number of young Chinese aged between 25 and 45). Similarly, and connectedly, steel and iron ore demand in China peaked recently.
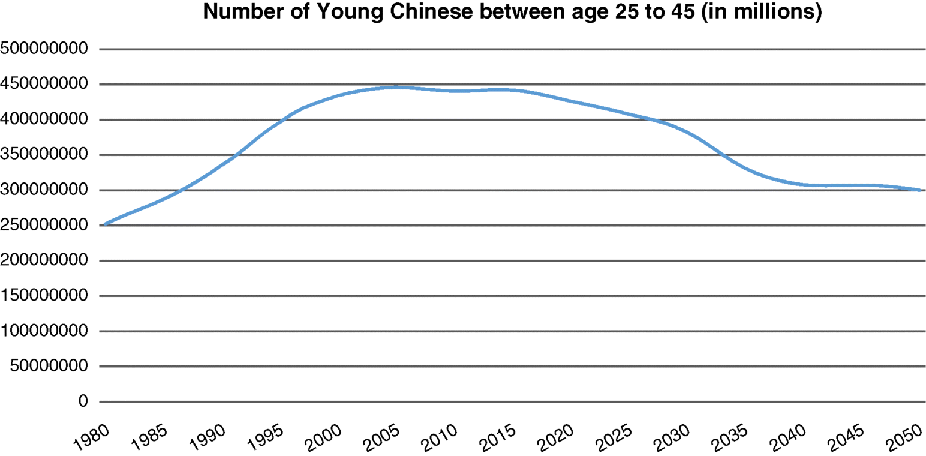
Figure 3.8 Growth in young Chinese aged from 25 to 45
Data Source: World Bank, 2015.
After China, the next country with a similar scale of demand is India. With the economic takeoff in India, global demand for energy and commodities will reach a peak between 2040 and 2070. After 2070, as the global population enters a period of stagnation and aging, the demand for commodities will decline, along with their price, as well as their economic significance. The competitiveness and wealth of each country will be increasingly dependent on innovation.
Demographics and Macroeconomy
For many sectors (health care being one very big exception), the peak age of demand is between the ages of 25 and 45. Young workers in their 20s are big consumers, and yet their productivity and wages are still low. So, in general, whenever there is a large cohort of 20-year-olds in the economy, the aggregate demand is robust relative to the production capability, thus causing inflation. The logic above accurately accounts for the high inflationary rates in the 1970s and 1980s in the United States, when the baby boomers were entering the workforce (Figure 3.9).
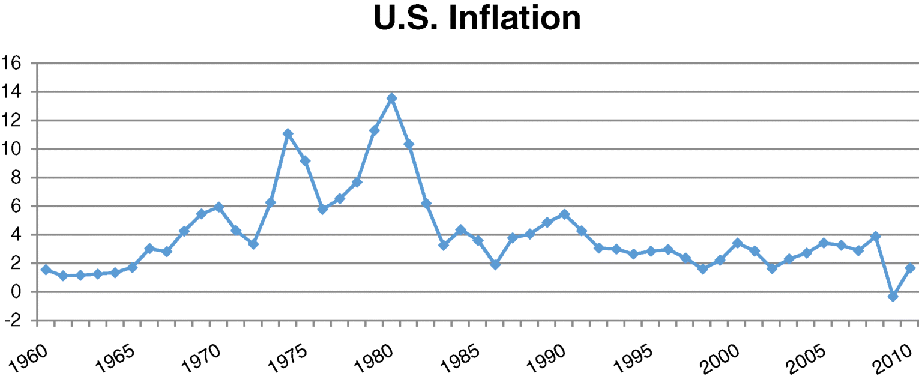
Figure 3.9 U.S. inflation from 1960 to 2010
Data Source: World Bank, 2015.
Conversely, when a young cohort shrinks as a result of low fertility, the economy will usually be in a slow growth and deflationary mode. Japan has a rapidly aging population and a shrinking young workforce; consequently, it has a zero-growth economy and a negative inflation rate (i.e. deflation).
Older workers tend to benefit from deflation at the expense of young workers. First, in a deflationary economy, the savings of the older generation increase in terms of purchasing power over time. Furthermore, because nominal wages rarely go down in a typical firm, when money increases in purchasing power, the effective wages of incumbent workers rise. To keep costs down, the firm has to lower the wages of incoming young workers. In Japan, this is exactly what has happened. Young workers suffer disproportionately from economic stagnation and deflation. There are a lot fewer high-paying full-time jobs than there were 30 years ago, and young people's income and career prospects are not nearly as good as those of their parents' generation. This is another example of “the blocking effect” that I have already described, and one that saps the vitality of the young in terms of innovation and entrepreneurship.
Demographics and Inequality
The French economist Thomas Piketty, in his best-selling book Capital in the Twenty-First Century (Piketty, 2014), paints a pessimistic outlook of the ever-increasing income gap between the rich and poor. Inequality seems to be the most challenging problem for the world economy. Let us first clarify some common misconceptions about inequality.
Is Greater Equality Always Better?
While equal opportunity is desirable, perfect equality in income is not only impossible (due to inherent differences in ability and effort) but also undesirable. In a perfectly equal world, people would lose the incentive to innovate, to take risks, and to work hard. This would lower the overall living standard. For an example of this type of stagnation, one needs only to look at the planned economies of the Soviet era, with their emphasis on equal pay and benefits for all, irrespective of their level of skill or productivity. As long as we want to have competitive and risk-taking behavior, there will always be winners and losers. Therefore, some degree of inequality is necessary.
Global Inequality
People tend to think that the problem of inequality has got worse in recent decades but if one looks at inequality globally, the very opposite is true. Global inequality has been increasing throughout most of human history. However, over the last 20 years it has declined due, to a large extent, to the rapid growth of China and India—two large, poor countries that are becoming wealthier far faster than the rest of the world. Regional growth in emerging countries is also a contributor, but China and India have contributed the most to lowering the levels of equality, due to their large populations. When we look at inequality within countries, it is clear that inequality has increased, as some segments of the population have disproportionately benefited from globalization, whilst others have lost out in a significant way. The Gini coefficient has remained relatively stable in most European countries and affluent Asian countries, but a significant increase in inequality is noticeable in the United States and China (Figure 3.10).
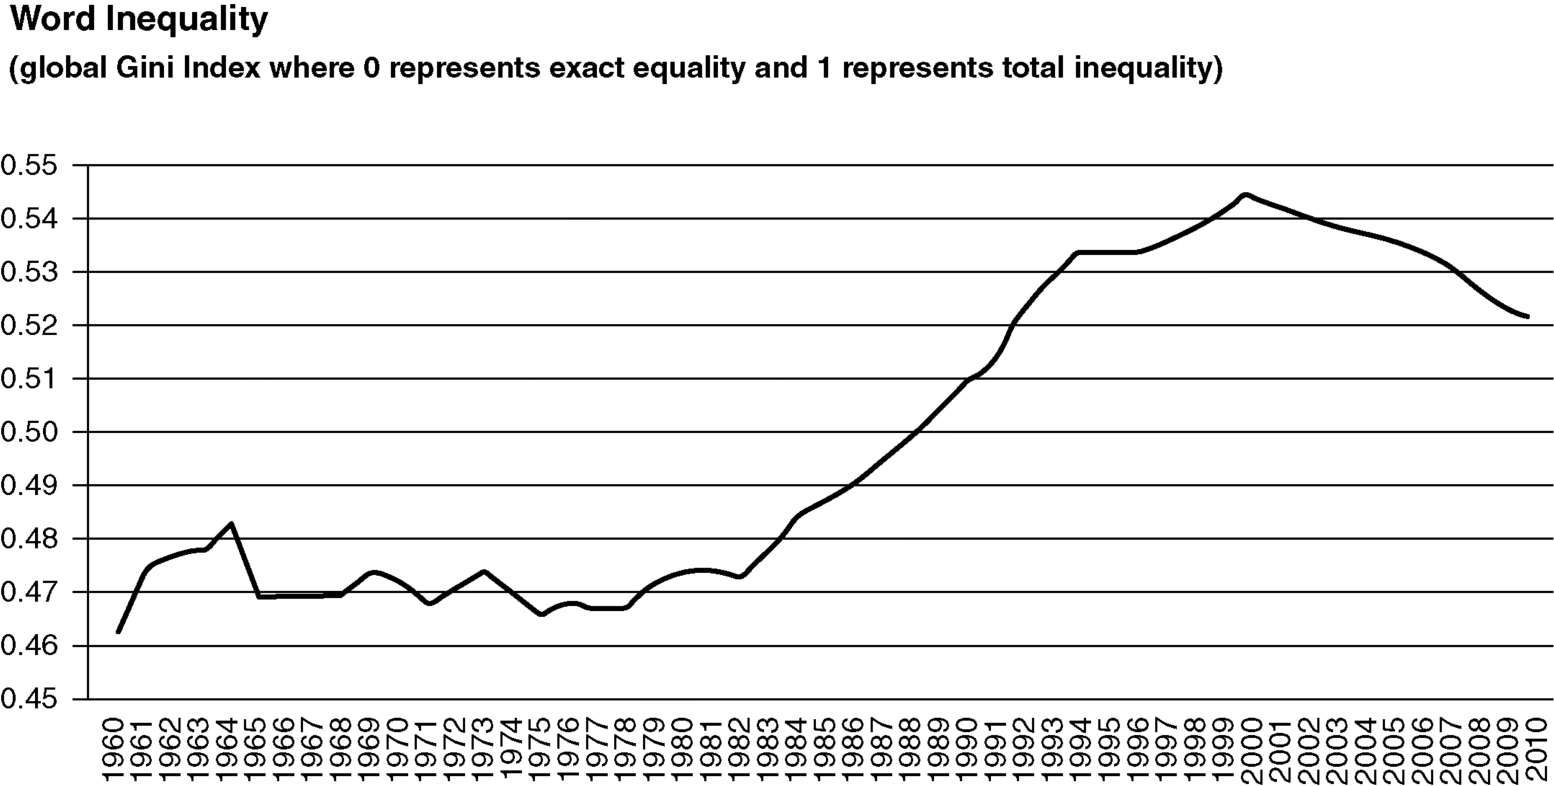
Figure 3.10 Global Gini inequality index
Source: The Conference Board of Canada, World Income Inequality—Is the world becoming more unequal? September, 2011.
Long-Term Inequality Trends
As communication and transportation technologies have improved over time, an innovator has a larger market to profit from. The overall historical trend is that technological advancement and globalization has resulted in more wealth concentration in the hands of innovators and entrepreneurs, and hence more inequality.
Inequality was minimal in primitive societies, where everybody was more or less equal, and increased in the pre-industrial world where a few large landowners were rich and everybody else was comparatively very poor (with an embryonic middle class confined to the few larger towns/cities). Globally, inequality increased further after the Second World War, when developed countries were far wealthier than developing countries. The reward for entrepreneurial success, as well as the demand for highly specialized skills, has been increasing throughout most of human history, but has accelerated since the 1980s.
As explained above, global inequality has actually decreased since the late 1990s, which is an amazing reversal of a centuries-old trend. However, once China reaches an average per capita income of US$20,000, which is almost certainly going to happen in the next few years, mathematically the future growth of China as a high-income country will actually contribute to increasing global inequality.
On the supply side, human capital and the number of highly skilled workers have been increasing too. During some periods when the supply of human capital (i.e. per capita education) grows faster than the demand for highly skilled workers, inequality can temporarily decrease, but will increase again when the supply of human capital levels off.
In the United States, from 1950 to 1980, when there was a huge increase in the supply of college graduates, the income inequality was reduced. But after 1980, the expansion of college education leveled off, and the U.S. college graduation level stagnated at 50%, lower than that of many other developed countries. Consequently, the income gap between high- and low-skilled workers in the United States continued to rise throughout the 1980s and 1990s. Why has the U.S. college graduation rate halted at this 50% level? The college enrollment rate continued to rise to almost 80%, but only about 60% of those who enrolled actually graduated. One of the reasons for the low college graduation rate is the low quality of K12 education for children from low-income families. This is a complicated subject, beyond the scope of this book. Although the United States has the most innovative high-skilled workers, it has a large population with a very low level of skills. As the skill premium increases globally, the income gap in the United States has widened as a result.
Besides education, there are many reasons for the bipolar distribution of skills in the United States; one of them is its immigration origin. Historically, the United States has attracted a very diverse population of immigrants from different cultures and diverse levels of human capital.
Immigration and Inequality
When a person moves from a poor country to a wealthy country, it almost always reduces inequality globally (from the combined perspective of both the source and the destination country), because when a poor person in a poor country moves to a wealthy country where he/she earns more money, world income is more equal. However, from the perspective of the destination country, it also matters whether the person is a highly skilled or an unskilled worker. If the immigrant is an unskilled worker, then he/she competes for jobs with native unskilled workers, which tends to lower wages for unskilled labor, thus increasing inequality in the receiving country. However, if the immigrant is a highly skilled worker, then he/she competes for jobs with native highly skilled workers, which also lowers their wages, thus decreasing inequality between highly skilled and unskilled in the receiving country. That is one of the reasons why countries always prefer highly skilled immigrants. Not only because their contribution to the economy may well be more valuable, but also because inequality within the country is incidentally reduced. Within a country, most governments allow free internal migration, because internal migration is always good for reducing overall inequality within the country.
The demographic impact of fertility on inequality is similar. If highly skilled families have more children, this will help reduce inequality, because highly skilled families tend to produce highly skilled children, thus increasing the supply of highly skilled workers and therefore lowering their wages and overall inequality. Conversely, if unskilled workers have more children, this tends to increase inequality by depressing the wages paid to unskilled workers. Throughout the history of the world until the Second World War, it was the wealthy who had more children surviving into adulthood, which acted as a decelerator of inequality.
Until the 1960s, the wealthier countries in the West—like the United Kingdom and the United States—experienced higher population growth than the rest of the world due to high fertility rates and better health care. The West's share of the world's population increased until the 1960s. However, a new demographic trend started to emerge after the 1970s in developed countries. Highly skilled workers began having fewer babies than unskilled workers, mostly because the highly skilled workers spent more of their time and effort on education and professional work. This reduced the supply of future highly skilled workers relative to future unskilled workers, causing increasing income inequality a generation later.
Policy Choices to Reduce Inequality
To sum it up, the overall increase in income inequality is primarily due to technological progress and globalization, about which little can be done. Moreover, the new demographic trend has partially contributed to this problem, which can only be addressed with demographic policies.
The desired demographic policy for the United States is basically a smart immigration policy to encourage more highly skilled immigrants and a pro-fertility policy to encourage highly skilled workers to have more children. I will discuss these policies in Chapter 5.
In contrast, China's inequality is mostly an urban–rural inequality problem. The human capital and skill level of the urban young are much higher than their rural counterparts. In recent years, not only has the gap between rural and urban been increasing, but also the gap between large cities and small cities, because most of the innovations are occurring in large cities. The best way to address this inequality is to allow more people to move to cities and to incentivize people in cities to have more babies. Unfortunately, the Chinese government continues to restrict internal migration and recently has imposed a limit on the population growth of large cities, based on misguided concerns regarding the effects of such growth on the environment and natural resources. The relationship between demographics and resource and environment is the topic of the next chapter.
