Chapter 7
China
One of the best sellers in 2011, Battle Hymn of the Tiger Mother (Chua, 2011), tells the story of an extremely demanding Chinese American mother pushing her children academically. The story was not a surprising one in the United States, as Chinese students there are known to be very hard working and have excellent grades. In elite U.S. colleges, the ratio of ethnic Chinese students far exceeds their ethnic ratio. Why did this book create such a stir in the United States? I think it is because the release of the book coincided with the emergence of China as a real world power. Americans may well feel threatened that China will have access to the largest and best talent pool in the world if all Chinese moms are like the Tiger Mom in the book!
Recently, another piece of news underlined that concern. On the PISA test, which tested over 1 million students in 65 countries, Shanghai high-school students scored at the top, a notch better than students from the top-scoring Asian countries (i.e. Singapore, Japan, and Korea), and much better than students from European countries and the United States (Figure 7.1). Shanghai was the only city tested in China, but PISA believed other large Chinese cities would have similar scores. No doubt, China has the smartest high-school students in the world. Fifty years ago, American parents often used the “starving Chinese kid” to urge children to finish their food; these days, parents are more likely to say: “If you do not study hard, Chinese kids will take your job.”
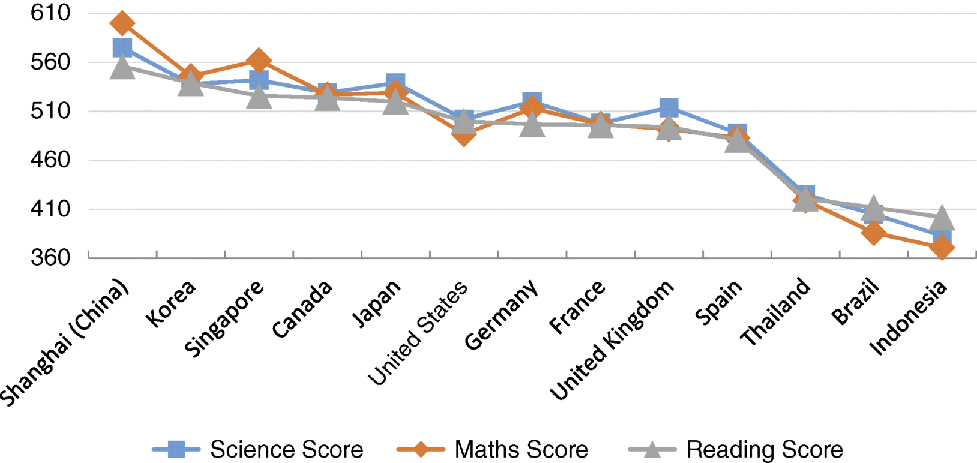
Figure 7.1 Comparison of student performance on the PISA test in 2009
Data Source: OECD Program for International Student Assessment 2009 Database.
The concern was well grounded. As China becomes wealthier, the quality of its education will be at least on a par with that of other developed nations. And China will likely overtake the United States economically, because it has a much larger talent pool.
Will the Twenty-First Century be the Century of China?
The most important event of the twenty-first century is the emergence of a vibrant Chinese economy. Per capita GDP in China has reached US$7,500 and the total GDP of China is $11 trillion, about 60% that of the United States and much larger than that of Japan, which is the world's third-largest economy. On a PPP basis, the Chinese economy is already larger than the U.S. economy.
The Chinese economy is still growing at about 6.5% annually, much faster than the 2% growth rate in the United States. If the Chinese economy continues to grow at 6% per annum over the next five years, its per capita GDP will reach US$10,000. After 2020, if it continues to grow at about 5–6% per year, its per capita income will reach US$16,000–20,000 by 2030. Even though its per capita GDP is only one-quarter to one-third that of the United States, its overall GDP will certainly be larger than that of the United States. After 2030, if the Chinese economy continues to grow faster than that of the United States, it will become the largest economy in the world and remain in this position throughout most of the twenty-first century.
Can China sustain a 5–6% growth rate over the next 10–20 years? If it can sustain this growth rate over the next 20 years, China will become a high-income country. But many economies, including those of many Latin American countries, after reaching the middle-income level (around US$10,000), stop growing and remain stuck at this level of affluence; this is the so-called “middle-income” trap. Only four Asian Tiger economies have successfully escaped the “middle-income trap” and continued to grow rapidly: Korea, Taiwan, Hong Kong, and Singapore. Today they are rich economies with a per capita GDP of well over US$20,000. Is China more like contemporary Latin American countries or more like the East Asian Tiger economies of 20 years ago?
Let's compare the economies of Latin America, the Asian Tiger economies, and China.
First of all, let's look at the savings rate. A high savings rate is required for capital formation and infrastructure investment, both of which are essential for a developing economy to grow wealthy. During the takeoff period of the Asian Tiger economies, their savings rates were much higher than those of Latin American countries (Figure 7.2). High savings rates allowed them to invest heavily in infrastructure and key manufacturing industries. What does China's savings rate look like? The Chinese savings rate is even higher than that of the Asian Tiger economies when they took off. This is one of the reasons why China has built an infrastructure and manufacturing industry that is the envy of the world.
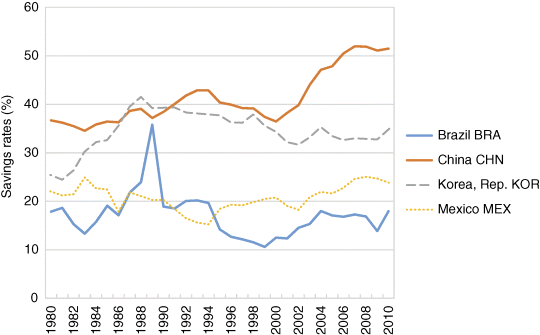
Figure 7.2 Comparison of saving rates of selected countries
Data Source: World Bank, gross savings (% of GDP), 2010.
Secondly, let's compare their export capabilities (Figure 7.3). Export capability is a measure of a country's competitiveness and innovation. When Asian Tiger economies escaped the middle-income trap, their export capability was much higher than that of comparable Latin American countries; consequently, they had a large trade surplus and a stable and appreciating currency during their takeoff period. In contrast, the Latin American economies usually had a large trade deficit on non-resource trade, with unstable currencies and frequent financial crises. China's economy is clearly more like the Asian Tiger economies, as it has a huge trade surplus.
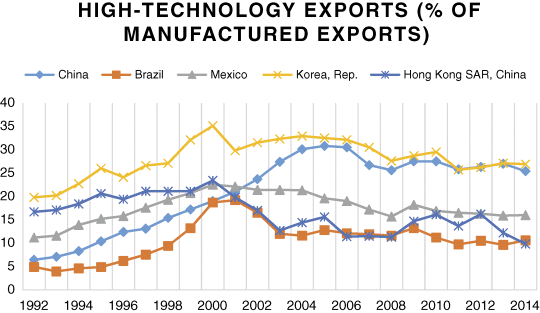
Figure 7.3 Historical trends in high-technology exports of selected countries
Data Source: World Bank, high-technology exports (% of manufactured exports), 2014.
Next let's compare the technology capabilities. Asian Tiger economies, after the initial stage of developing labor-intensive industries, successfully climbed up to capital-intensive and technology-intensive industries, and built many exporting high-tech firms such as Samsung. In contrast, most Latin American countries' exporting firms are resource-related. Chinese exports still have a significant portion that is labor-intensive, but in recent years, Chinese exports have become more aligned with those of economies like Taiwan and Korea, whose exports contain a large high-tech component. The share of electronics and equipment in export has risen from 17% in 1993 to 48% in 2008, whereas the share of textile exports has dropped from 29% in 1993 to 12% in 2008. Overall, high-tech exports as a share of total exports have risen to 30%, a level that is far higher than in Latin American countries, and a level similar to that of other developed countries.
Some people argue that the high-tech exports in China stem mostly from the operations of multinationals rather than from indigenous Chinese companies. In reality, many multinationals have moved at least a part of their research and development to China, and, with a large tangible presence in China, they are no different economically from local companies. Moreover, in the electronics and equipment industries, indigenous companies such as Huawei and Xiaomi have become world leaders in their respective industries. Clearly, in this regard, China is a lot more akin to Korea in the 1990s than to Mexico either then or now.
Last of all, and most fundamentally, let us look at human resources. The absolute number of college graduates in China is 7 million a year, which is a much larger total number than that of any other country. On a per capita level, the college graduation rate of nearly 40% is similar to that of Latin American countries. However, the quality of Chinese college graduates is much higher; one way to look at this is to look at the ethnic mix of graduate students in U.S. PhD programs. U.S. universities have the best PhD research programs in the world, so the best college graduates all over the world compete for PhD slots in U.S. universities. The share of PhD candidates from a particular country could be deemed to reflect the quality of the college graduates of that country. As shown in Figure 7.4, in 2010, Chinese PhD students accounted for 30% of all foreign PhD students in science and technology fields in U.S. universities. European and Indian graduates accounted for 11% and 17%, respectively, while all the Latin American students combined accounted for only 5%, representing one-eighth of the total of Chinese students.
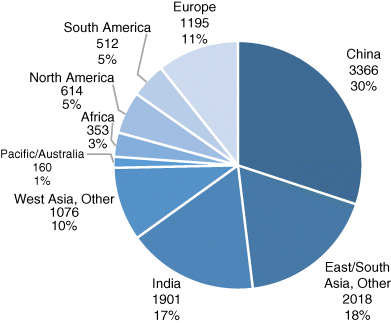
Figure 7.4 Non-U.S. citizens awarded doctorates in science and engineering by country, 2010
Note: A total of 25 degrees were awarded to non-U.S. citizens from unknown countries.
Data Source: National Science Foundation, Science and Engineering Doctorate Awards: 2009–10.
Let's look at another measure of high-end human capital: the number of people engaged in research and development. Even though China's per capita GDP is still lower, the number of people engaged in research and development in China per million people is far higher than in Latin American countries. And this is against the background of research and development spending as a percentage of GDP in China being far higher than in other developing countries, currently at around 1.5% (which is still half the level of Korea, but growing rapidly). The number of patents awarded to Chinese companies is already second only to the United States.
In addition, Chinese companies have the advantage of tapping into a large stock of Chinese engineers who once worked for U.S. high-tech companies. Just as the returning Taiwanese engineers jump-started the high-tech industries in Taiwan, these returnees have been crucial to the rapid development of Chinese high-tech industries. No other developing country (except India) has this advantage.
In summary, the Chinese economy is similar to the East Asian Tiger economies of 20–30 years ago, and will likely continue to grow by 5–6% per year, surpassing the United States to become the largest economy before 2030.
Pessimists often point to the potential risks of the Chinese economy; I will analyze the most commonly cited risks below.
Risk of Transiting from Manufacturing to Service
By 2020, China's per capita GDP will reach US$10,000, which is five times the level of low-income countries such as India, Vietnam, and Pakistan. Chinese companies and multinationals will move their labor-intensive jobs to these low-income countries. Robots will be widely used in China, which is already the largest market for robots. Will this create mass unemployment in China?
The answer is that these extra workers will be absorbed by the service sector. The service sector in China currently accounts for about 50% of GDP, which is much lower than that of other middle-income countries or developed countries; it is even lower than that of India, where the service sector accounts for 60% of GDP. China's service industry can grow from its current low level to a more normal 60–70% of GDP, creating more than enough jobs to absorb these extra workers.
Some people would argue that the Chinese economy is structurally unhealthy, with too much investment, too much manufacturing, and too much reliance on export. When investments and exports inevitably slow down, the economy will also follow suit. No doubt, investments and exports as a share of the total economy will eventually have to come down, but the fact that they are still very high is a sign that the Chinese economy has a much higher potential than other middle-income economies.
The high investment rate is a result of the high savings rate and a high potential return on investment. For example, the Chinese government invested heavily in infrastructure projects, such as airports, high-speed railways, and subways, which generate good social and economic returns. The high investment rate also reflects the vibrant level of entrepreneurial activities. For example, according to the Global Entrepreneurship Monitor, China has the most entrepreneurs per capita among middle-income and high-income countries, and the money invested by Chinese entrepreneurs from retained earnings or personal savings (instead of from banks and other financial institutions) was 11% of China's GDP in 2011, the highest in the world. This shows that the return on investment in China is still relatively high.
Similarly, a high level of manufacturing and export is a sign of Chinese companies' competitiveness. In recent years, Chinese companies have been able to export more high-tech manufacturing goods, demonstrating their progress in terms of being innovative. A high level of investment, exports, and especially strong manufacturing are strengths of the Chinese economy rather than weaknesses. Latin American countries would love to have these “problems.”
As China grows wealthier, demand for services will inevitably grow. The health-care, travel, financial, and education industries will grow faster than manufacturing. Expanding these industries is much easier than building a manufacturing base, because the service industry is typically not constrained by patents or proprietary technology. A hospital can import state-of-the-art medical equipment, and grow its business as long as there is local demand; in contrast, manufacturers of things as complex as medical equipment almost always need to compete in the world market. This is just one structural reason why the service industry will naturally grow faster, while the manufacturing and export industry slows down.
Risk of a Widening Income Gap
For the last 30 years, the income gaps between urban and rural residents and between highly skilled and unskilled workers have increased in China (Figure 7.5). Up until the early 2010s, China had a surplus of rural labor, who became migrant workers in cities, and their income remained low while the income of highly skilled workers continued to increase. The Gini coefficient reached 0.46 in early 2010, and some people worried that this widening income gap would threaten the stability of Chinese society.
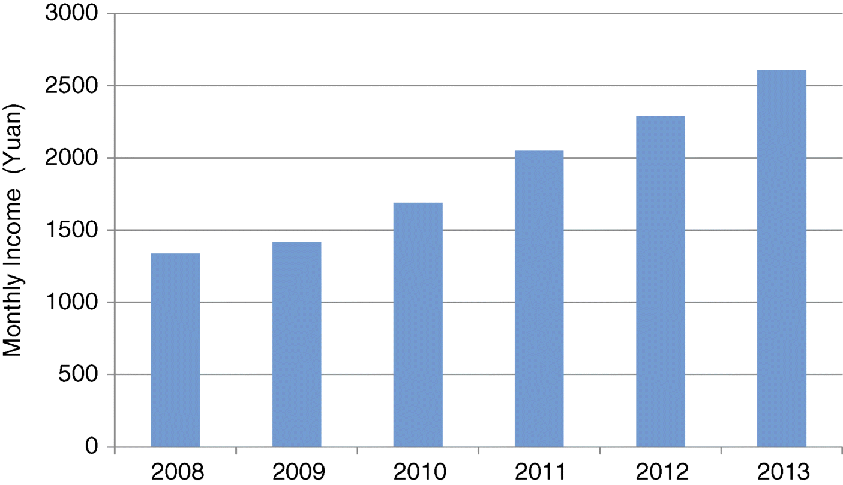
Figure 7.5 Monthly income growth of rural workers in China
Data Source: China's National Bureau of Statistics, Monitoring Report of Rural Workers in China, 2013.
However, as I explained earlier, the one-child policy reduced the birth cohort size in the 1990s so dramatically that by around 2010, China finally ran out of surplus rural labor and the wages of unskilled migrant workers rose sharply; an increase that has been particularly noticeable over the last few years. The income of farmers who remained in villages also increased, because they have more land to work with. As a result, the Gini coefficient has stabilized. The expansion of college education has also helped to reduce the income gap between highly skilled and unskilled workers, because the wage increases of graduates were slowed by the large increase in their supply.
China's inequality is mostly a rural/urban phenomenon, which is mainly a result of the government's long-standing policy of restricting urban and rural migration. China's urbanization rate was only 50% in 2015, much lower than that of other middle-income countries, and even lower than that of India. As a result of the reform, hundreds of millions of farmers have escaped abject poverty by becoming migrant workers, but they still face discrimination in housing, education, and health-care services in large cities. In the future, many of these migrant workers will settle in cities, and thus the problem of urban–rural inequality will eventually be mitigated (assuming, of course, that the government further relaxes its restrictions on internal migration). China's inequality problem is not as difficult to resolve as that in other countries, because internal migration is relatively easy (the Chinese population has a relatively homogeneous culture and ethnicity): 90% of Chinese are Han Chinese with a culture of valuing education, and the children of new urban residents generally tend to be much better integrated than their parents.
Risk of Political Reform
Political reform is a very complicated subject, which warrants a separate book. In general, the quality of a country's political institutions and level of democracy depend on the level of economic development and human resources. Governments of low-income countries, such as those in Latin America and Africa, are democratic in form, but are often corrupt, unstable, and economically inefficient. On the other hand, most high-income countries, such as Korea, can make the transition from an authoritarian government to a democratic government, and remain stable and functioning democracies.
Today, for many people in China, the Chinese one-party system is a better fit compared with a democratic multiparty system, partly because of the fear of a “tyranny of the majority” and partly because, at this stage of its development, China needs to build a significant volume of infrastructure, something an authoritarian government does well. However, when China becomes a high-income country and an innovation-driven economy, it is quite possible that China will also transition to a more democratic system, as have other wealthy Asian economies. Transition to a democracy in a high-income country can be politically quite chaotic, but it generally does not cause much damage economically, and usually results in a stable and functional democracy, albeit often after a few years of political turmoil. Korea experienced a rough political transition to a democracy when it reached an income level of US$10,000 per capita, but during the chaotic political transition, the growth of its economy was almost unaffected.
Environmental and Natural Resource Risk
I have argued in previous chapters that the constraint stemming from the availability of natural resources is no longer an important factor in modern economies. Even with China's voracious and growing appetite for natural resources, the world, as a result of continuing innovation, has an increasing number of choices of abundant renewable resources, with the help of new energy technologies. It is not a coincidence that the price of oil and other commodities has consistently declined in recent years.
Moreover, China is not a resource-poor country. China has more resources per capita than most Asian countries, such as India, Japan, Korea, and Vietnam. It is estimated that its reserve of shale gas is more abundant than that of the United States. In agriculture, China has more than enough farm land to feed its 1.3 billion people. Despite this, China will likely remain a net importer of food, because—as Chinese workers become more expensive—it will not be to China's comparative advantage to grow all the food it needs.
With the fast growth of its cities and industries, some Chinese cities (such as Beijing) have become among the most polluted cities in the world. Beijing smog has made headlines all around the world. However, as I have demonstrated in previous chapters, the pollution problem usually peaks at a per capita GDP of US$8,000, which China has already exceeded. As China grows more affluent, it will invest more money and make more efforts to reduce pollution—both because it can afford to do so and because doing so will drive growth. As manufacturing growth has slowed down and tougher environmental standards have been enforced recently, the smog situation in wealthy coastal regions has improved.
The Demographic Advantage of China
As discussed above, most of the commonly cited risks regarding the Chinese economy are unfounded. The main strength of the Chinese economy is its enormous scale. China has the largest market for almost any goods. For example, it has 900 million Internet users, three times more than the population of the United States, making China a fertile ground to nurture some of the best Internet companies in the world.
China also has the largest pool of human resources. It has more college graduates and PhD graduates than the United States today, and is catching up very quickly with the United States in terms of number of researchers (Figure 7.6). Of course, the quality of research is lower in China, and per researcher spending is also lower than that of the United States, so it is unlikely that China will challenge or surpass the United States in this area in the short term. Nonetheless, over the next 10–20 years, overall research and development spending will exceed that of the United States, and it is likely that China will have at least one high-tech innovation center like Silicon Valley.
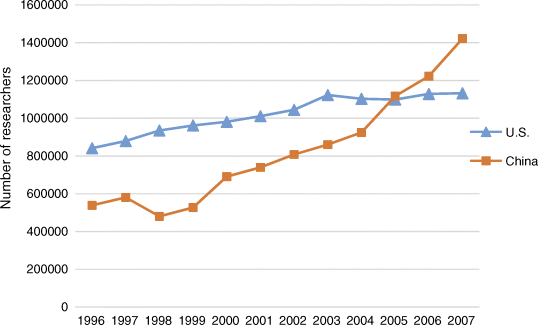
Figure 7.6 Number of researchers in China and the United States
Data Source: World Bank, number of researchers in R&D, 2007.
Some economists question the quality of Chinese innovation. Chinese innovations have, in the past, been mostly low-cost imitations, but that is perfectly normal for the current stage of China's development as an innovator. When Korea was catching up with Japan, and when Japan was catching up with the United States, and when the United States was catching up with the United Kingdom (in the late 1800s), the pursuers always imitated and absorbed the technologies of the leaders first, and only later were able to create frontier innovations. It is unsurprising that many Chinese firms have recently started to take frontier innovations to market. For example, Huawei has become one of the leading global innovators for communications equipment. Moreover, Chinese firms are now catching up fast with the United States in the number of patents (although the quality of patents filed is admittedly still lower than that of those originating in the United States).
Some would also point to the fact that very few Chinese consumer brands have developed into global brands. This is also perfectly normal at this stage of an innovative economy's development. Usually, it is business-to-business brands that develop first, because, on the whole, businesses are more objective decision makers. It takes longer to build a consumer brand, because it is more difficult to convince consumers of a product from a historically backward country. Many years ago, Korean cars already demonstrated better quality than American cars; however, it is only recently that Korean automobile brands have achieved a reputation for quality and penetrated global markets in a meaningful way. Chinese equipment products such as Huawei have already become successful business product brands, and it is only a matter of time before Chinese consumer products become global consumer brands.
Another argument made by the pessimists over China's future is that China does not have many leading universities or Nobel Prize winners, but that's also normal, because the award of the Nobel Prize usually comes many years after a discovery has been made. The United States was already the leader of innovation in the early 1900s, but its universities became globally recognized as cutting edge only after the 1940s. Top universities in China, buoyed by the government's enormous education budget, are already able to afford and attract the best scholars in the world; furthermore, the number of academic publications by Chinese scholars is catching up very quickly with that of U.S. scholars. It is likely that it will be another 20–30 years before we see more Chinese Nobel Prize winners.
The scale advantage of Chinese firms will continue to drive more innovation. The largest talent pool and the largest market will likely make at least some of the mega cities in China high-tech innovation centers like Silicon Valley. By 2040, not only will China's economy surpass that of the United States, but it will also catch up with the United States in terms of innovation.
This should not be surprising, since China has been the largest and wealthiest economy for most of the last 2,000 years. With the enlightened economic policies adopted after 1978, it will take roughly two generations for China to catch up with other developed nations in terms of productivity. The Asian Tigers achieved this in two generations; India is likely to do the same some two generations after the economic reform of the 1990s. However, China will achieve it faster and more spectacularly, due to its scale advantage.
Some people would undermine the advantages intrinsic in being a big nation by asking: “Why has China for the last 500 years been consistently much weaker and poorer than the smaller European countries?” First, historically, China has not always been the country with the largest population. The Roman Empire ruled more people than the Han dynasty in China, and was wealthier than China on a per capita level. After the collapse of the Roman Empire, Europe disintegrated into many smaller nations, and they became much poorer than the unified Tang and Song dynasties in China. China had the largest population in the world between the fifth and fifteenth centuries, making it the wealthiest and most technologically advanced nation of the world for about 1,000 years. However, after 1500, when the great voyage of Zheng He was called off by the emperor, China made the colossal policy mistake of pursuing an autarky trade policy, which basically cut China off from the rest of the world. On the other side of the Euro-Asia continent, the West discovered the American continent, which is much closer to Europe geographically than it is to China. The discovery of America, and new trading routes to Asia, allowed the West access to a much larger market, including Europe, America, and Asia. As a result, the West led the industrial and scientific revolution, while China became backward and vulnerable. It thus attracted invaders, became mired in wars, and, subsequently, was the subject of a doomed experiment in a Soviet-style command and control economy.
After the 1980s, a post-reform China was once again on a level playing field with other nations, with its scale advantage coming back into play. It startled the world with the fastest economic growth rate ever recorded in world history. The emergence and dominance of the Chinese economy is the single most important event in the twenty-first century, but the question is: How long can the dominance of the Chinese economy last?
The Aging of the Chinese Economy
Demographics will be China's Achilles' heel. Starting from 2040, the Chinese economy will be affected by the rapid aging of its population, which will be exacerbated by the one-child policy implemented from the 1980s to 2015. India will soon surpass China to be the most populous country and the fastest-growing economy. It is entirely possible that the United States, with its unrivaled ability to attract immigrant talent, will regain the innovation leadership by the late twenty-first century, after yielding it briefly to China.
The Great Demographic Transition of China
Like other developing countries, the demographic transition of China has followed a typical pattern. It had a very high fertility rate and rapid population growth during the 1950s and 1960s. As shown in Figure 7.7, its fertility rate was as high as 6.0 throughout this period (except for a sharp drop from 1959 to 1969, when the Great Famine occurred). Meanwhile, the state of public health greatly improved, leading to a substantial decrease in the infant mortality rate, and, as a result, the population grew rapidly at an annual rate of 2–3%, expanding from 500 million in the 1950s to 800 million in the 1970s.
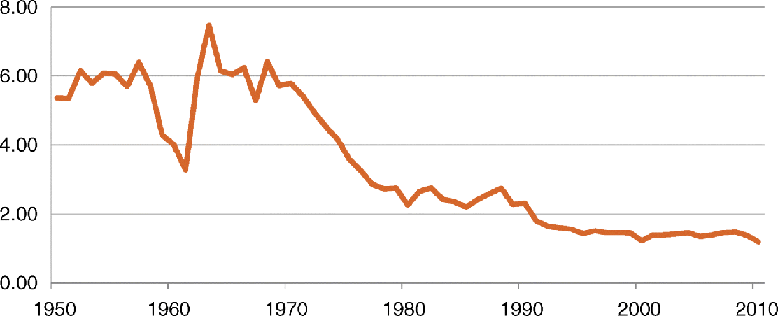
Figure 7.7 Fertility rate in China, 1950–2010
Data Source: China Population Census, fertility rate trend of China, 2010.
At the same time, the government implemented a Soviet-style central planning economic policy, which turned out to be a total failure. China's economic growth stagnated in the 1960s, and its agricultural production was a disaster from 1959 to 1962, causing widespread famine. As the population continued to grow rapidly in the 1970s, the government became concerned about food shortages. The government blamed overpopulation for its economic problems, and started advocating a family planning policy to curb population growth. The policy was initially voluntary, but became increasingly coercive and extreme; it eventually turned into the one-child policy, one of the most extreme forms of birth control ever recorded in human history. In hindsight, the harsh policy was largely unnecessary, because the fertility rate had already dropped to 2.2 when the policy began to be enforced.
The one-child policy took a variety of forms in different parts of China. In the cities, the enforcement of the policy became increasingly stringent throughout the 1980s. Between the 1980s and the 1990s, anybody who had a second child would lose his/her job, as the government was the only employer in many industries during this period. After 2000, as private firms became major employers, the threat of job loss began to lose its teeth. In response, the government imposed a steep fine of three times annual income. As a result, in the cities, where about 50% of the population live today, almost everybody had only one child after the 1990s. Only in 2015 was the one-child policy replaced by the two-child policy. The fertility rate in major cities such as Beijing and Shanghai was 0.7 in 2015, the lowest recorded rate in human history.
In rural areas, the situation was more complex. When the one-child policy was first enforced in rural areas, it induced such strong opposition that it was later changed to the one-and-a-half-child policy, which allowed a second child only if the first child was a girl. At that time, it was culturally and economically unacceptable for Chinese farmers to be without a son. Even with this one-and-a-half-child policy, many farmers still desired to have a son after having two girls. The strict enforcement of this policy sometimes led people to extremes. Forced abortions and destruction of property were not uncommon in the 1980s and 1990s. There was a small portion of the population that was exempt from the one-child policy. These were ethnic minorities, mostly in the Western part of China, who represented less than 10% of the overall population.
Currently, the fertility rate is 1.8 in rural areas and 0.8 in urban areas. Overall, the fertility rate has dropped below the replacement level since the early 1990s, below 1.5 in the 2000s, and most recently dropped to only 1.3, making China one of the ultra-low-fertility countries.
Drastic Demographic Change as a Result of the One-Child Policy
Owing to the unprecedented one-child policy, China's fertility rate declined rapidly, beginning in the 1980s; as a result, the age structure of the population has changed drastically, more so than that of any other country. Even though the total population is still growing in China, the working-age population (from 15 to 64) began to decline in 2015. The year 2015 was an inflection point. In the few decades preceding 2015, the working-age population grew about 1% a year, but from 2015 to 2025, the working-age population will not grow at all, and, after 2025, will shrink 0.5–1% per year. This partially explains why the Chinese economy experienced a significant slowdown in 2015, with the growth rate dropping from 10% to less than 7% a year.
The rapid aging of the Chinese population will impose a heavy burden on the Chinese economy and government. Figure 7.8 illustrates the change in the dependency ratio in China. The dependency ratio is defined as the number of dependents (the elderly and children) per worker. Starting from the 1980s, the dependency ratio has declined much faster in comparison with other developing countries, as the number of children needing to be supported dropped. But these missing children became missing workers 20 years later. By 2015, the dependency ratio reversed and started to increase, and it is expected to rise rapidly after 2030.
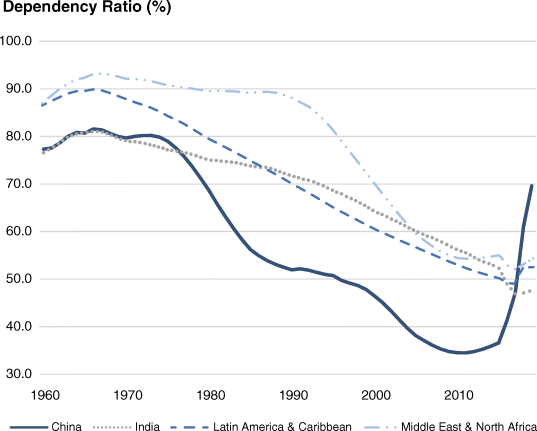
Figure 7.8 Dependency ratio in China
Data Source: Data for 1960–2015 is from the World Bank, 2015. Data for 2015–2050 on India is from the United Nations Population Division. The rest of the data is from the Department of Economic and Social Affairs, World Population to 2300.
The number of the elderly will increase rapidly relative to the working population after 2030. Figure 7.9 compares the population structure in 2010 vs. 2040. In 2040, the total population is expected to be roughly 1.4 billion, but the elderly population will increase from 171 million to 411 million. By 2040, the working population, aged between 20 and 60, will drop from 817 million to 696 million. The number of young people, aged between 20 and 40, will drop by 30%, from 436 million to 302 million. As a result of these changes, the age structure will be a top-heavy reverse pyramid shape (Figure 7.10).
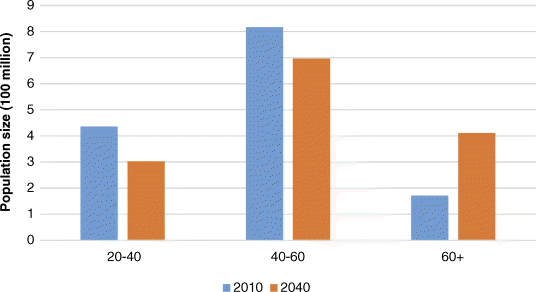
Figure 7.9 Comparison of population structure of China in 2010 and 2040
Data Source: U.S. Census Bureau, 2015.
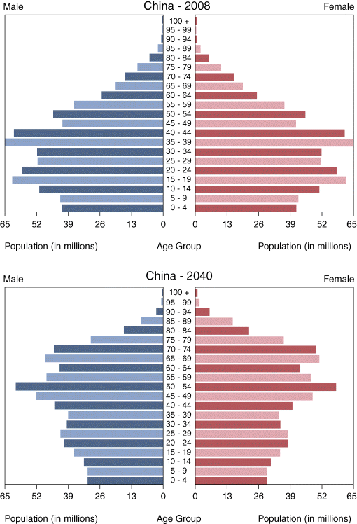
Figure 7.10 Population structure of China, 2008–2040
Data Source: U.S. Census Bureau, 2015.
Gender Imbalance
In addition to the problem of an aging population, China also has a severe gender-imbalance problem to deal with. Chinese farmers prefer sons to daughters. When the government limited the number of children to one or two per couple, from the 1980s, Chinese farmers selectively aborted unborn daughters with the help of ultrasound prenatal screening technology. So, from the beginning of the 1980s, the ratio of males to females rose from 1.05 in the early 1980s to 1.20 in the late 1990s, and remained high in the 2010s (Figure 7.11). A gender ratio of 1.2 at birth means that there are 20% more boys than girls; consequently, in the birth cohort of the 1990s and the 2010s, about 20% of males will not have a corresponding female partner of their age.
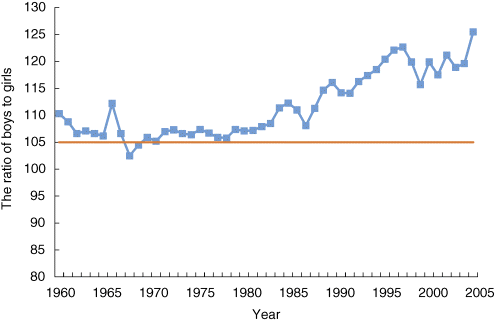
Figure 7.11 Gender ratio in China
Data Source: World Bank, 2015.
The End of the One-Child Policy
In recent years, many scholars have urged the government to abolish the one-child policy. After receiving my PhD in economics from Stanford in 2012, I continued my research in aging and innovation. I noticed the absurdity of the one-child policy and its huge looming negative impact on the Chinese economy. I tried to communicate my research findings and policy recommendations to the public and to political leaders; however, up until a few years ago, any criticism of the one-child policy was forbidden in the Chinese media, and most economists and the media were not aware of the severity of the problem. China paid a huge price for this media censorship, which prevented rational public policy debate and delayed the reversal of a policy that clearly had a detrimental impact on the future economic health of the country.
Luckily, with the Internet and particularly social networking websites, I was able to attract a large audience for my research and policy recommendations; my blog attracted over a million followers. With my co-authors Wenzheng Huang and Jianxin Li, I published China Needs More Babies, which was the first book in mainland China to directly criticize the one-child policy (Liang et al., 2012). By 2013, the opinions of the mainstream media and the academic community shifted in favor of abolishing the one-child policy. This influenced the Chinese government to change the one-child policy to the two-child policy on October 29, 2015. The question now is what the fertility rate will be in the future.
Forecasting China's Fertility Rate
If we look at the fertility rates of other East Asian countries with similar cultural patterns, we will reach the conclusion that China will continue to experience very low fertility rates in the absence of meaningful policy intervention. The fertility rates of Japan, Korea, Taiwan, Hong Kong, and Singapore are around 1.1–1.4, the lowest in the world. Vietnam, similar to China culturally but at a much less advanced stage of development, has a fertility rate of 1.8 without the presence of a one-child policy. So, China's natural fertility rate will likely be only 1.6. As China grows wealthier, its fertility rate will continue to drop. Currently, the per capita GDP in China is US$7,500; it is expected to reach US$10,000 by 2020. When Japan and Korea reached the US$10,000 level, their fertility rate dropped to below 1.5.
What about the young rural Chinese? Will they have more children than their young urban counterparts and so help the overall fertility rate? The answer is that they are also unlikely to have many children, because they are mostly destined to become migrant workers in the cities and, as a result of their migrant status, face an even tougher burden economically to raise children.
Of course, in the first few years following the relaxation of the one-child policy, there will be a pent-up demand to have a second child; therefore, it is expected that there will be a surge of new births from 2016 to 2018. However, after this initial increase, China's fertility rate and new births will drop again. Table 7.1 shows the fertility rebound in several Asian countries after the abolishment of anti-fertility policies. Only Singapore experienced a 0.2 rebound in fertility, and this only lasted for a period of three years; none of the other countries experienced a significant rebound.
Table 7.1 Fertility rates of countries five years before and after birth policy changes
Data Source: Data pertaining to Taiwan is from the Department of Household Registration, MOI Taiwan. The rest of the data is from the World Bank.
| Limiting population growth | Encouraging population growth | |||||||||||
| Year | −2 | −1 | Stop | +1 | +2 | Year | −2 | −1 | Begin | +1 | +2 | |
| Japan | 1974 | 2.14 | 2.14 | 2.05 | 1.91 | 1.85 | 1994 | 1.46 | 1.50 | 1.42 | 1.43 | 1.39 |
| Korea | 1996 | 1.66 | 1.63 | 1.57 | 1.52 | 1.45 | 2005 | 1.18 | 1.15 | 1.08 | 1.12 | 1.25 |
| Taiwan | 1990 | 1.86 | 1.68 | 1.81 | 1.72 | 1.73 | 2005 | 1.26 | 1.18 | 1.12 | 1.12 | 1.10 |
| Singapore | 1988 | 1.43 | 1.63 | 1.96 | 1.75 | 1.87 | 1988 | 1.43 | 1.63 | 1.96 | 1.75 | 1.87 |
| Iran | 2012 | 1.90 | 0.91 | 1.92 | / | / | 2012 | 1.90 | 1.91 | 1.92 | / | / |
| Notes: Both Singapore's and Iran's population policy reversed immediately, to stop inhibiting and begin encouraging birth at the same time. | ||||||||||||
Based on the experience of these countries, the rebound in China will likely be slight and short-lived. From our analysis, the number of births is expected to increase from 16 million in 2015 to about 18 million between 2016 and 2018, and start to drop again after 2020.
China to Adopt Pro-fertility Policy
Sooner or later, China will need to completely reverse its anti-fertility policy and adopt a pro-fertility policy just like the other East Asian countries. However, there are reasons to believe that the job of raising the fertility rate in China will be even more difficult than it is in other Asian countries. Here are some of these reasons.
The first reason is a cultural one. The Chinese care about the educational achievements of their children more than the parents of any other culture. This is both a historical artifact (competitive examinations having been part of the Chinese culture for millennia) and a recent phenomenon (Chinese parents recognize that the global market prizes educational performance). The “Tiger Mom” style of parenting is quite common among Chinese parents. Extracurricular activities and cram classes are costly and time-consuming for parents. Chinese parents are more concerned about investing resources to ensure the best educational outcomes for their children, rather than the quantity of their children. This naturally limits the number of children they believe that they can afford to have.
Second, Chinese women have more education and career demands than other countries. Chinese women are more educated and independent than in many other nations. Under Mao, almost all women worked and this trend has remained a strong one in post-reform China. Even today, the female labor force participation rate is extremely high by international standards.
Lastly, for demographic and cultural reasons, highly educated Chinese women will likely have both a low marriage rate and a low out-of-wedlock birth rate. Chinese women, like Japanese women, have a culture of not “marrying down.” Consequently, many highly educated Chinese women have a hard time finding suitable husbands, and these so-called “leftover women” are increasingly common in large cities in China. On the other hand, it is still culturally unacceptable to have children out of wedlock. In Japan, China, and Korea, the out-of-wedlock birth rate is less than 3%, in comparison with 40% in Scandinavian countries.
In summary, Chinese women are more likely to be unmarried, career-oriented, and care more about the “quality” of their children than the quantity; therefore, it is likely that they will have fewer children than women in other countries, even should a robust pro-fertility policy be adopted in China.
During a recent survey conducted in China, the desired number of children per woman worked out at around 1.8, compared with 2 in Japan and 3 in the United States. Typically, the actual number of children per woman is 30% lower than the desired number of children. So, without any pro-fertility policies in place, China's fertility rate could be only 1.2, a rate similar to those in Singapore, Hong Kong, and Taiwan. In fact, even with the two-child policy, the urban fertility rate is likely to remain the lowest in the world.
Deterioration of Demographics
The number of births in the late 1990s was, on average, 16 million per year, which is almost 40% lower than in the 1980s (Figure 7.12). In 5–10 years, those born in the 1990s will become parents, and if they have a fertility rate lower than 1.5, then the number of new births will be only 12 million a year. India, in contrast, will have over 16 million new births a year. After 2040, China will have one of the most top-heavy demographic structures in the world, and its population will shrink by 10 million a year, which is an unprecedented decline in world history.
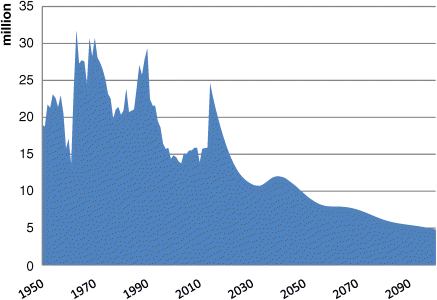
Figure 7.12 Forecast of number of newborns in China per year, 1950–2160
Data Source: Estimates based on the Sixth Population Census and the China Statistical Yearbook.
The Impact of Demographic Change on the Chinese Economy and Innovation
These abrupt demographic changes are very likely to have a large negative effect on China's economy, especially on its capability to innovate.
Currently, the Chinese are still relatively young demographically, because the birth cohort stemming from the 1980s is enormous, with an average of 25 million new births a year during that decade. They are now in their 30s, a golden age for both earning and consumption; their demand for housing and other items has been the main driver of the Chinese economy over the last 10 years. But over the next 20–30 years, they will grow old and retire. The 1990s birth cohort is 40% smaller than the 1980s cohort. When they reach the prime age of 30, something which is only several years away, domestic demand for goods and services will slow down. Of course, this will be counterbalanced by an increasingly affluent society. Nevertheless, the cohort size is such that it will have a considerable structural impact on consumption.
In terms of innovation capabilities, 30–40 is the most productive age group, and is also the best age group for entrepreneurship. Currently, the 30–40 age group is composed of the huge 1980 birth cohort. But in 10 years' time, when the much smaller 1990 birth cohort turns 30, the level of innovation and entrepreneurship will almost certainly suffer. As the size of the young population in China shrinks, the scale advantage of Chinese innovation will yield precedence to that of India and eventually to that of the United States.
Figure 7.13 compares the proportion of young workers (aged 20–39) of China to that of Japan. In Japan, the proportion of young workers has declined rapidly from 55% in the 1970s to about 40% today. I have argued in previous chapters that an aging workforce will block the promotion opportunities of younger workers, making them less innovative and entrepreneurial. The lack of innovation and entrepreneurship caused by an aging workforce is one of the major reasons for Japan's economic stagnation over the last 25 years. The aging of the Chinese workforce will follow a very similar trend to that of Japan, albeit with a 35-year lag. By 2025, the Chinese workforce will be as old as the Japanese workforce in the 1990s, and by 2040, the Chinese workforce will be older than the Japanese workforce today. If Japan is a case study to learn from, then the Chinese economy will suffer as a result of a lack of innovation and entrepreneurship, beginning in 2025.
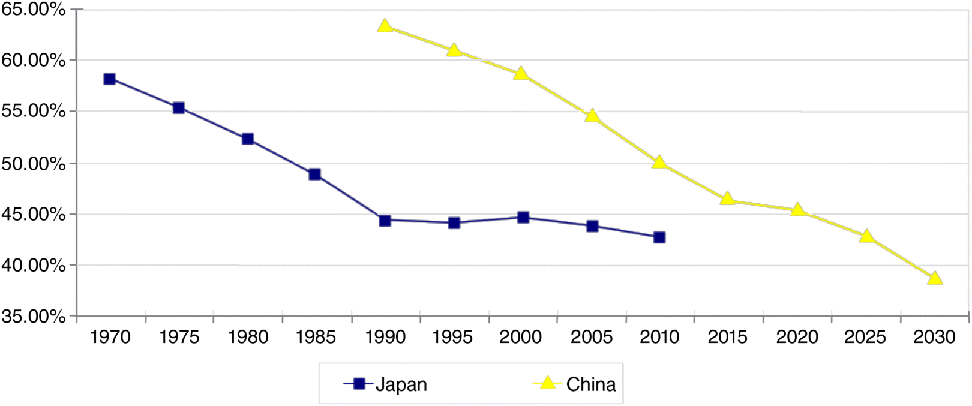
Figure 7.13 Share of young workers (aged 20–39) in workforce (aged 20–59) in China and Japan
Data Source: U.S. Census, 2015.
Policy Suggestions
China currently attracts next to no immigration and is unlikely to be able to attract a significant number of immigrants relative to its huge size, so it urgently needs to revamp its demographic policies.
- To completely reverse its anti-fertility policies and help families raise more children. With a fertility rate of only 1.3, China should not only abolish its current two-child policy, but also adopt aggressive pro-fertility policies such as tax and cash benefits for families with children, more funding for daycare facilities, and educational reforms such as those discussed in Chapter 5.
- To further relax internal migration and help more young college graduates and migrant workers to settle in big cities. China needs to abolish the “Hukou” (residency registration) system, which discriminates against non-residents in their ability to access public services. This policy has not only exacerbated the problem of urban–rural inequality, but also put a brake on the growth of large cities, reducing the potential agglomeration effect of innovation for its large cities.
- To increase the size of its major cities, by facilitating more investment in housing, roads, subways, airports, schools, hospitals, and other public services in large cities. Recently, housing prices in major Chinese cities have risen quickly. But rather than increasing the land supply, infrastructure, and public services, the government has instead tried to further restrict migration to these large cities. This is clearly a misguided policy as China, simply because of its sheer size, needs to have the largest cities in the world to host the largest concentration of human resources in the world.
China will pay a heavy price for its demographic policy mistakes over the last 40 years; moreover, China has been very slow to adjust its draconian demographic policies. With the vibrant economy of today, the Chinese government certainly can afford to have a generous pro-fertility policy and continue to invest in infrastructure and public facilities in large cities, to accommodate a much larger urban population. Unfortunately, however, it seems that the Chinese government still sometimes views a large population as an economic liability rather than an asset. Mainstream economists still underestimate the advantages of a large, concentrated, young workforce. This is the main reason why China is unlikely to adopt the recommended aggressive pro-fertility policies any time soon.
Conclusion
China will benefit significantly from its large population size, and become one of the most innovative economies of the world in the early part of the twenty-first century. By 2040, the per capita income of China will stand at about half that of the United States, and its total GDP will possibly be larger than that of the United States and Europe combined. However, by 2040, China's workforce will be one of the oldest in the world, with a demographic cohort makeup similar to that of Japan today; as a result, its innovation and entrepreneurship capabilities will be much diminished.
By 2040, India, with a much larger population and a fast-growing economy, will emerge as one of the innovation centers of the world. By 2040, the United States will remain an innovation hotspot, with a growing population and a large influx of highly skilled immigrants. If this trend continues, the dominance of the Chinese economy and innovation will be short-lived. In the latter part of the twenty-first century, India and the United States will likely overtake China as the world's most innovative countries. The twenty-first century may not be the century of China after all, because of its self-inflicted demographic wounds.
