Chapter 2
Demographics and Innovation
In this chapter, I will discuss the relationship between demographics and innovation. I will expound the three key demographic factors of innovation: the scale factor, the agglomeration factor, and the age factor.
Approximately 200 years ago, the English economist Thomas Malthus proposed the famous Malthusian theory of economic demography, which describes the following chain of logic:
Technological progress can generate a short-term increase in income per capita. However, the increased income soon results in population growth and lower agricultural productivity, which, in turn, eventually wipes out any gain in per capita income.
The Malthusian theory was a good approximation of the world economy before the onset of the industrial age. In agricultural societies, the rate of technological progress was slow, and slow improvement in productivity leads to an increased population but does not result in significant increases in per capita income. Therefore, until the Industrial Revolution, the general pattern was that the world population grew gradually while the per capita income stagnated.
Three hundred years ago, China's agriculture was the most advanced in the world; as a result, it could sustain a much larger population than Europe, which had roughly the same landmass. However, income per capita was not much higher than that of the rest of the world, hovering just slightly above the subsistence level. During the reign of the Kangxi and Qianlong emperors in the 1700s, the population grew from 80 million to 300 million. Despite this growth in population, the per capita income barely increased as overpopulation dragged down productivity and living standards. The Malthusian theory characterizes the Chinese economy of this period accurately.
Although Malthus' theory is an accurate representation of historical realities, it is no longer applicable to modern economies. First, agriculture is no longer as important as it once was. In developed countries, agriculture contributes less than 5% to total GDP. In middle-income countries like China, agriculture only contributes about 10% to the total economy. Almost every modern economy is comprised primarily of industrial and service sectors. Technological progress in these sectors takes place more rapidly than it does in agriculture, and much more rapidly than the growth of population.
Second, the Malthusian logic that posited that increased population lowers productivity is no longer applicable to the industrial and service sectors. In theory, industrial sectors do require raw materials, energy, and other resources, hence a larger population will consume more of these resources and raise the cost of natural resources. Nevertheless, the intensity of usage of resources by the industrial sectors is much lower than the intensity of land usage in agriculture.
Moreover, unlike land, new materials as well as, surprisingly, energy sources are steadily being discovered by way of innovation. For instance, about 200 years ago we used wood and stone to build homes, whereas today we have many alternative building materials such as metal, glass, cement, and rubber. Historically, the main source of energy was wood and coal, but today many new energy sources are available and are becoming ever more efficient, for example solar, wind, and nuclear energy are all important sources of energy for many developed and developing nations. The cost of clean energy, such as solar power, is rapidly declining and approaching that of fossil fuels.
In the modern service and information technology sectors, the requirement for natural resources is even less significant, especially when we examine the Internet and entertainment industry, where products and services can be mass-replicated with almost no use of additional natural resources. For this reason, land and natural resource are no longer bottlenecks in the modern economy. Moreover, innovation becomes much more important for solving problems such as global warming. To keep innovation activity at a high level, a country needs to have a large, young, and highly educated workforce instead of a smaller, stable population as prescribed by the Malthusian theory.
Finally, in the post-industrial age, contrary to Malthus' prediction, the population explosion has not continued indefinitely, as people have had fewer offspring as they have become wealthier. All countries, without exception, have experienced a large decline in fertility rate as they have prospered. In almost all developed countries, the fertility rate has dropped below the replacement level of 2.1. In non-Muslim Asia, typically when a country reaches an average income level of US$4,000, the fertility rate drops below the replacement level of 2.1; when a country reaches a per capita income level of US$10,000, the fertility rate drops below 1.5, which is an unsustainably low level.
Today, most economists agree that the Malthusian theory of demographics and economics is applicable only to the pre-industrial economies or the poorest nations in the world. The world's demographic development has entered a new era, where most of the high- and middle-income countries have a stable or shrinking population; only the low-income countries have high population growth. We therefore need a new paradigm of economic demography.
In the history of modern economics, the most important economist is arguably Adam Smith, who discovered that specialization and trade is the primary source of economic efficiency (Smith, 1776). About 100 years ago, the Austrian economist Joseph Schumpeter developed the theory of “creative destruction,” in which he argued that innovation and entrepreneurship is the main driver for long-term economic growth. Schumpeter did not develop a formal economic model, but his insights have been gaining influence in recent years (Schumpeter, 1942).
About 15 years ago, an American economist—Paul Romer—formalized the model of innovation and economic growth (Romer, 1990). I studied this model during my doctoral study in economics at Stanford, and noticed that one of the implications of Romer's model is that a larger population, under certain conditions, can engage more people in research and innovation, which drives faster technological progress as well as productivity growth. There are a few assumptions in the model. One of them is a free-market economy, where people can trade ideas and goods. The other is the enforcement of property rights for both goods and ideas, so that people are motivated by the potential reward of ideas to innovate and start new businesses. This relation of population and economic growth, implied by Romer's model, is opposite to the Malthusian theory. Through the channel of innovation, increased population will lead to faster economic growth and higher income.
Some people will question why China, which has consistently had the largest population in the world, has not become an advanced nation like those in Western Europe and North America. This can be attributed to long-term isolationism stemming from a specific historical event during the early part of the Ming dynasty, when China was the still the world's most advanced nation. Sea navigational technology used by the Chinese admiral and explorer Zheng He in his famous voyage was more advanced than that of comparable explorers from the West, but soon after Zheng He's voyage, for reasons that were mostly accidental, the Chinese emperor stopped all sea-exploring activity and closed the Chinese coast to trade. A few decades later, partly because geographically the Americas are much closer to Western Europe than to China, Western European countries were able to discover, exploit, and populate the new continents ahead of China, helping them expand trade and later initiate the period of innovation that led to the Industrial Revolution. Meanwhile, modern China (since the mid-1800s) suffered a series of wars, as well as failed experimentation with Soviet economic institutions; as a result, China's innovation capability remained underdeveloped and untapped until the Deng Xiaoping era.
In summary, over the last 500 years, China has implemented an autarky policy, which cut off the exchange of ideas with the rest of the world. Consequently, gradually but steadily, China was left behind in terms of innovation and technological advancement. In contrast, Western countries, building on top of ancient Chinese inventions such as gunpowder and compasses, invented advanced weaponry and sea navigational technology. These inventions helped them to conquer the New World and create a trade economy spanning Africa, the Middle East, and India, a market much bigger than China could access. This is one of the key reasons why the Industrial and Technological Revolutions occurred in Western Europe instead of China.
If a country can stay abreast of the latest technology from the rest of the world, and engage in its own internal research and development to further innovation, then a large population becomes an advantage both in terms of innovation as well as economic development. The economic history of the United States over the last century is a manifestation of this population size advantage.
As far back as 1850, the United Kingdom and Germany were the world's industrial superpowers, whereas the United States was still a heavily agrarian economy. However, once the United States started to acquire technologies and absorb advancements from Western Europe, while at the same time attracting a large number of immigrants, it quickly became a competitor. Soon after its population exceeded that of all of Western Europe, the United States quickly evolved from a technology copycat into a trailblazer of innovation and technology in its own right. Inventors and entrepreneurs, such as Thomas Edison and Henry Ford, led the world in new technology and business organization. Key here was not only their ability to innovate, but also their ability to market and sell their products and methods to a large, unfragmented market. By the 1900s, the United States' income per capita caught up with that of Western European countries, and, soon after, the United States became the largest economy in the world. After 1900, the United States continued to bolster its population by way of immigration, creating economies of scale that far exceed those of other nations. In short, the United States leveraged the advantage of a large population to become the world's leading innovator and an economic superpower. I will elaborate and analyze the scale effect of innovation later in this chapter.
In the Industrial and Information Ages, a large population is an important advantage in terms of entrepreneurship and innovation. The experience of the Chinese economy over the last 40 years is another example. Once China opened its gates to the world in 1978, its huge market quickly attracted large foreign investment. At the same time, its large pool of highly educated workers was able to quickly absorb advanced technology and catch up with productivity. During the last few decades, entrepreneurs in China have been able to create successful indigenous firms to compete with multinationals not just in the domestic market, but also internationally. Huawei and Lenovo, for example, have gone on to become successful multinationals. By 2016, China's per capita GDP reached US$8,000. The size of its market and population will continue to be an advantage for China, not just in catching up with technological progress, but also in spearheading frontier innovation.
In this chapter, I will elaborate the population scale advantage and other demographic factors of innovation.
Economic Theory of Innovation
The most fundamental question in economics is how to make a nation wealthier and thus assure the happiness of as large a number of its citizens as possible. Besides innovation, there are a number of key elements that lead to a country becoming affluent. These elements include a stable government, property rights protection, good infrastructure, sound financial systems, good education, and trade openness. All these elements are important, but which ones are more difficult to implement from a policy point of view? Let us for now ignore LDCs such as those in Africa, since they are missing too many of these key elements; instead, we will focus on middle-income countries. Most middle-income countries do have many of these ingredients already. Thailand, for example, has a stable government, a reasonably good infrastructure, a high college enrollment rate, and a relatively open trade policy, and yet it has not been able to reach high-income status. The reason for this seems to be that the difference between high-income countries and middle-income countries is the capability to innovate.
Innovation is becoming more important. Why is this so? First, the globalized nature of trade has made the rewards that a country reaps from being innovative much greater, because it allows innovation to spread much faster and wider, therefore making more money faster in the process. Moreover, innovation is becoming more important, because innovations have been replacing routine jobs. One can think of innovation as creating new tools to replace humans. In the future, there will be more people creating tools, and fewer people operating them. Robots and artificial intelligence are hot topics today, but they are far from having the capacity to innovate. (Even if robots could innovate, humans would probably never allow it because it is just too dangerous.) Major countries, especially China, have increased their spending in research and development; in the foreseeable future, more capital and resources will be devoted to innovators rather than to operators. Innovation is critical for a middle-income country to transition to a high-income country.
Types of Innovation: Adaptive Innovation and Frontier Innovation
Adaptive innovation is prevalent in economies that are in the “catching up” phase of their development. Adaptive innovation is adjusting or fine-tuning an existing technology to fit the local market environment. For example, KFC in China tweaked their secret recipe by inserting Chinese spices into their fried chicken, while Indian smartphone makers designed a cheaper version to meet the needs of Indian consumers. For poor nations (per capita GDP < US$5,000), adaptive innovation is the primary form of innovation, because it is much easier to adapt existing technologies to local market conditions than to create technologies that are truly innovative, which I refer to as “frontier technology innovation.” Frontier technology innovation is not as important at the early stage of economic development, but it is critical for a country that wishes to take the next step and attain high-income status. For the rest of the book, I will focus our analysis on frontier innovation.
Frontier innovation can include the following:
- Academic theories.
- Major improvements in processes and technology.
- New technologies and products.
- New business models and organization forms.
- Creative content: music, films, games, etc.
Different types of innovation require different economic and incentive systems. For example, academic theories are discovered primarily by academics who are rewarded by way of faculty ranking and eminence. New business models are usually invented by new firms.
In terms of the degree of creativity, innovation can be either a disruptive innovation (that is, macro innovation) or a continuous (micro) innovation. Large, established firms tend to be very good at continuous innovations, but when it comes to disruptive innovations, typically new firms and entrepreneurs are better at turning them into a commercial success. For example, Japanese corporations today are very good at micro inventions; they continuously improve product quality via gradual enhancements in process and technology. However, they have not been very good at disruptive innovations in the last 20 years (I will analyze the reason for this later).
Historical Trends of Innovation
From a global standpoint, is the speed of innovation increasing or decreasing? To answer this question, let's first see how innovation is measured. There are many ways to measure innovation. One common way is to look at the number of patents. By most measures, the speed of innovation is becoming faster, although it is not accelerating rapidly. Even though most innovations are accidental, at a macro level, more investment in innovation generates more innovation. As measured by research and development spending, the input in innovation globally has been increasing steadily.
On the other hand, the difficulty of innovating also seems to be increasing. Let us look at the patent data: Figures 2.1 and 2.2 show that the average age of patent applicants is increasing. Meanwhile, the probability that an inventor will switch fields is decreasing. This means that inventors are getting older and have become more specialized. Moreover, Figure 2.3 shows that the average number of co-inventors per patent has increased. During the 1970s, there were only one or two inventors per patent; presently, there are two or three inventors per patent.
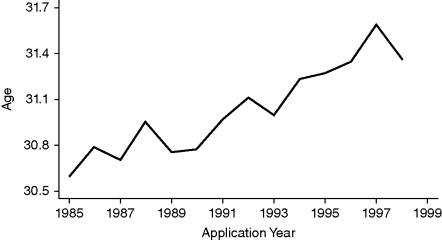
Figure 2.1 Trend in age at “first innovation”
Source: Jones (2009).
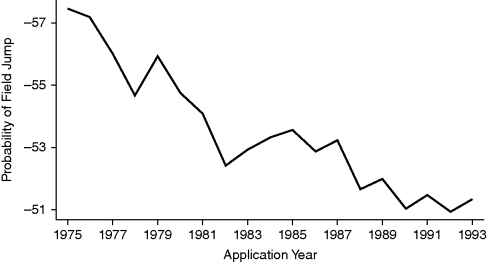
Figure 2.2 Trend in field switch for innovators
Source: Jones (2009).

Figure 2.3 Trend in number of inventors per patent
Source: Jones (2009).
So, what does this information tell us? It suggests that innovating has become both more specialized and also more difficult. As Isaac Newton's famous quote that scientific discovery is “standing on the shoulders of giants,” so the giant of human knowledge is growing taller, making it more difficult to stand on this giant's shoulders. Four hundred years ago, it was possible for geniuses such as Leonardo Da Vinci to become an inventor in many fields. Today's scientists and researchers tend to specialize in one field, and the classification of that field is becoming finer.
Innovation usually happens by accident. An epiphany moment occurs when combining knowledge from different fields; therefore, as the fields become more specialized, cross-disciplinary cooperation becomes more important. That is why the number of co-inventors per patent has been increasing, as illustrated in Figure 2.3. A good inventor not only needs to be an expert in his/her specialization, but also needs to have cross-disciplinary knowledge and be skilled at working with researchers from other fields. Similarly, successful entrepreneurs also need to have a broad range of diverse skills and job experience. Edward Lazear, a Stanford Economics Professor, analyzed the job history of Stanford MBAs and found that MBA students who take a variety of classes are more likely to become entrepreneurs (Lazear, 2005). In contrast, MBA students who take a more specialized business class—such as finance—are less likely to become entrepreneurs. Having a variety of interests and skills is a key trait of successful innovators and entrepreneurs.
Because innovation is harder, the average age of inventors is increasing. Disruptive innovation and entrepreneurship requires not only hard work, but also risk-taking behaviors that are more commonly found amongst the young. Consequently, the golden window of disruptive innovation and entrepreneurship is getting narrower. In certain fields, a PhD is an entry point to do research, and the number of years required to obtain a PhD is increasing. It is quite common for a student to complete their PhD at the age of 28. I will show later that the best age for entrepreneurship is roughly around 30. Hence, the golden window of opportunity for a PhD graduate to become an entrepreneur is very short.
In summary, the human knowledge base is becoming more extensive, and innovation is more difficult and requires cross-disciplinary cooperation. However, because more resources are invested in research and development, innovation has not slowed down, but actually accelerated in recent years. This is one of the most fundamental trends in human history. When innovations take place steadily, new technology solves resource bottlenecks of economic development, and per capita income continues to grow. If this trend continues, then human society could eventually reach a stage of general abundance.
Social Changes Driven by Innovation
Innovation and technology has driven many social changes throughout history. The rise of the factory is an excellent example. During the Industrial Revolution, production shifted from home production to mass production in large factories. Factories became necessary because the production technologies and processes became more complicated and required many specialized skills, such as machine maintenance, testing, and quality control; therefore, it was impossible for a single person or a few family members to master the whole production process. As the requirement for technical knowledge increased, society's economic activities needed to be divided and more cooperation was necessary; this created the need for factories and modern firms. This also led to the formation of modern labor unions, the so-called “proletariat,” and, eventually, the Communist movement.
Second, modern transportation and telecommunication technology brought about globalization. Container shipping technology and freeways helped goods flow at a very low cost, while advancements in aviation technology brought almost the entire world within anybody's reach in a day. Further, the advances in telecommunication have allowed for an almost instantaneous flow of information around the world. With the globalization of goods, people, and information, innovation can spread much wider and faster than ever before. Just like the superstar effect, where a superstar artist can make much more money in a global market, any innovation can reap a much higher reward in a globalized world. Nevertheless, the globalization and innovation trend has increased the gap between innovative workers and routine manual workers. The silver lining of a large income gap is that more people are working hard to be innovative because the rewards are greater.
Third, we have the democratization of college education. To be innovative, one needs to have a comprehensive knowledge base; therefore, one needs more than just technical/vocational training, but rather a general-purpose college education. For example, to be a good game designer, one needs to know the basics of computer science, graphics, history, and so on. The skill requirements driven by innovation and globalization prompt the wider spreading of college education. The rate of college enrollment in developed countries increased from 20% to over 50% in just one generation. In China, the college enrollment rate grew from less than 10% in the 1980s to 30% in the late 2010s. Universities have become centers for knowledge creation and dissemination.
Despite more people than ever possessing a college education, the rewards for such an education have remained high. The wage premium earned by elite college graduates and PhDs is even higher because the reward for innovation is higher. For example, Silicon Valley has a high concentration of highly productive innovators, whose earnings have been growing much faster than those of the average American.
The other side effect of democratization of college education is that more women are attending college and entering the workforce. In many countries, women's college enrollment rate has caught up with men's, and in some instances even surpassed it. This contributes to the decline in fertility rate and family size around the world.
Lastly, the major metropolitan areas of the world have become the innovation centers of the world. As we discussed earlier, the process of innovation demands the participation of more people with different skills and fields of expertize. Large cities have the advantage of providing a large and diverse talent pool; therefore, the best innovative companies are concentrated in large cities. As a result, large cities are becoming larger, more expensive, and economically more important than ever.
Innovation Capabilities of Different Countries
Before we compare the innovation capabilities of different countries, let us first look at how to measure innovation. Figure 2.4 shows all the indicators for measuring innovation. From an input perspective, they include research and development spending and the number of researchers; from an output perspective, they include the number of patents, the export of high-tech products, and the number of academic publications. The Global Innovation Index is a measure (published by Cornell University, along with other organizations) that weighs and summarizes all of these indicators, and yields one number for each country to reflect its overall level of innovation.
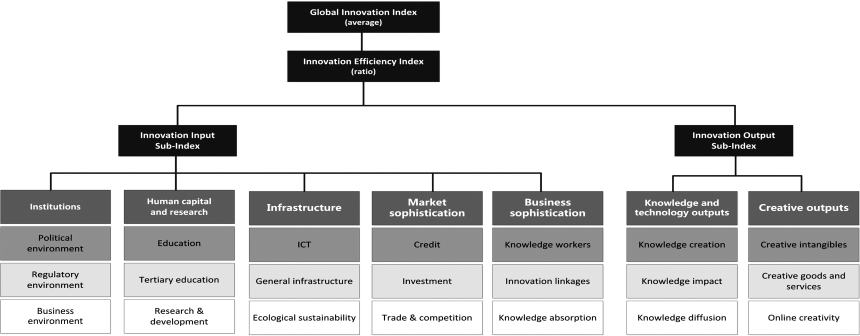
Figure 2.4 Framework of the Global Innovation Index 2012
Data Source: Global Entrepreneurship Monitor, 2012.
Figure 2.5 shows the innovation index of major countries relative to their income. The vertical axis represents the innovation index of each country, and the horizontal axis represents the per capita GDP income of the country. Each circle on the graph represents a country, and the size of the circle is the population size of the country. The graph shows a clear positive relationship between the innovation index and per capita GDP income—that is, high-income countries tend to be more innovative. This is not surprising, as a high-income country has more resources and time devoted to research and development, and more innovation will create more wealth. We can predict the innovation index from per capita GDP income by drawing an upward regression line, as shown in Figure 2.5.
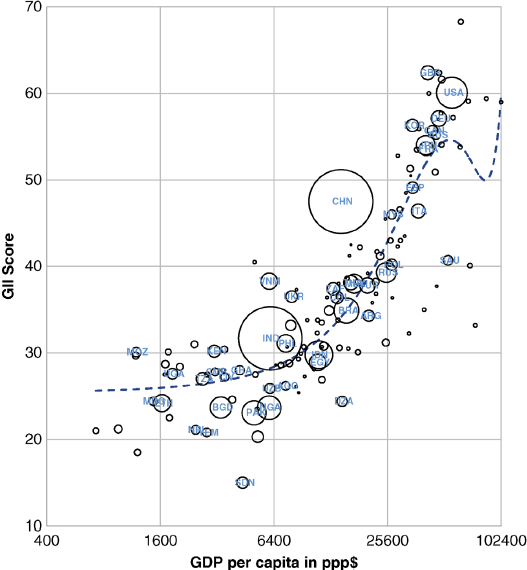
Figure 2.5 Global Innovation Index vs. GDP per capita in PPP$ (bubbles sized by population)
Data Source: Global Entrepreneurship Monitor, 2015; World Bank, 2015.
In Figure 2.5, three shaded regions broadly divide the countries into three categories. The top right regions are the developed countries and among them, the biggest circle is the United States. Underneath the top right region, there are two shaded regions; one is below the regression line and the other is above the regression line. Below the regression line are those countries that are not very innovative relative to their per capita GDP income. Above the regression line are those countries that are more innovative than their GDP income would tend to predict. In this region, two huge circles stand out. The largest circle is China, which is significantly more innovative than countries with a similar level of GDP per capita. India has a per capita GDP income of US$5,000 in purchasing power parity, but is also significantly more innovative than countries with a similar level of income.
In contrast with China and India, many countries' innovation indices lag behind what their per capita income levels predict. For example, many Latin American countries such as Brazil are not very innovative relative to their income. These countries typically have access to rich natural resources, but are low in human capital. If we analyze the recent growth rate of these economies, those countries with a high innovation index relative to their income tend to grow faster than countries with a low innovation index relative to their income. Innovation has become a key differentiator for economic growth for middle-income countries. Moreover, not very obvious from the graph is the “scale effect”; large circles tend to be above the regression line, which means that a country with a larger population tends to be more innovative relative to its income. I will analyze the “scale effect” in more detail later.
People's general perception is that firms in India and China are just low-cost producers or imitators, but relative to other developing countries at similar levels of income, by almost all measures of innovation, India and especially China are a lot more innovative than other developing countries. Let us look at some specific measures. Figure 2.6 shows the number of scientific researchers per million people. Since 1996, China has had a lot more researchers per million people than Brazil and Mexico.
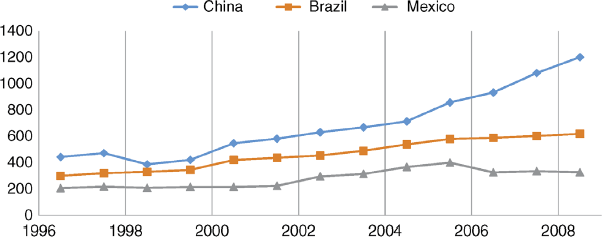
Figure 2.6 Researchers in R&D (per million people)
Data Source: World Bank, 2015.
How to Promote Innovation?
I have shown that innovation is ever more important, so the next question is: What kind of government policy can promote innovation? Historically, the world's center of innovation has shifted quite a few times. First it was Egypt and other countries in the Middle East, then Greece and Rome, later it was China during the Tang and Song dynasties, and for the last 200–300 years it has been Europe and the United States. So, what are the factors behind these changes? What kind of environment can promote and foster innovation, and what government policy is required to promote innovation? These are the key questions this book aims to answer.
After a successful entrepreneurial career, I chose innovation as my field of specialization for my PhD study in economics at Stanford. I soon learned that even though the question “How to promote innovation?” seems to be the holy grail in the discipline of economics, the academic research on this topic has had limited success. Many years of research have yielded very few findings. Important questions like “Can more education promote innovation?” still remained unanswered. Many people say that the education style of rote learning in China is bad for innovation, because students are taught to conform rather than to be creative and independent. However, there is very little evidence that education style has an effect on innovation. Japan and Korea have a similar education approach to that of China, but their education institutions did not prevent them from becoming major nations of innovation. It seems that education provides the basic skills, and whether a person can be an innovator or an entrepreneur may simply be down to pure luck.
Of course, innovation prowess requires certain basic macro conditions, such as adequate property protection, trade openness, a functioning financial industry, and so on. Today, most middle- to high-income countries can provide these conditions for innovation. However, even though nations such as Malaysia and Argentina have similar macro policies to Korea and China, their innovation capacity and prospects of transitioning to a high-income country are much weaker. So the question once again is: What, besides these macro conditions, are the factors that drive innovation?
Economists have found a few things that seemingly do not work. For example, one thing that does not work is a government's industrial policy to promote innovation in certain “promising” sectors. In a market economy with access to a global market, the reward for innovation is so great that successful innovations have had access to plenty of capital in the last decade—the global venture capital industry has grown very large, so innovation opportunities are well funded by the private financial industry, even in the absence of government funding.
Second, the private financial industry does a better job of choosing the most “promising” technologies. The skills of government employees, hampered by bureaucratic decision-making processes, are usually outmatched by nimble venture capitalists. For example, the Chinese government in recent years has invested a substantial amount of money to support the solar energy industry. With technology advances being very fast, the government was not skilled at picking the right company or the right technology, and lost a large amount of money even though the overall industry is still healthy and growing.
It seems that the best strategy for a government is to provide a fair and stable environment for competition. Instead of investing government money to promote certain companies or technologies, it should simply provide an across-the-board tax cut for all companies. This is the policy recommendation of the so-called supply-side economists who advocate low tax, small government, little regulation, and allowing the market to dictate and reward the winners. Their basic conclusion is that government should “get out of the way” of innovation and entrepreneurship.
Of course, most governments are reluctant to accept this line of reasoning in its entirety, because it leaves them out of the most important of economic activities. It is not surprising that there is no easy fix or panacea for driving innovation. If there was one, many more countries in the world would be able to replicate the policy and become wealthy.
I will examine what governments can do to promote innovation from a demographic perspective.
To look at this problem from a different perspective, let us look at the key strategies to create a successful innovative company. Over the last 30 years, the churn rate of Fortune 500 companies has accelerated. The most valuable companies in the world—Apple, Google, Amazon, and Microsoft—are all successful innovators. If you ask the executives from these companies what the successful factors are, their answers could be quite different from each other, but they all mention one factor: the ability to attract top talent.
Michel Porter, a Business Strategy Professor famously known for his five-factor model of a successful business strategy, applied his theory of competitive strategy of companies to the competitive strategy of nations (Porter, 1990). In his model, there are four key elements for a nation to be successful in an industry: factor endowment, local demand, component industry, and local competition. My view on Porter's four-factor model is that all four factors are actually directly connected to population and demographics. A large population means a large talent pool (i.e. factor endowment) and a big local market (i.e. local demand). A large market also brings a more developed and complete component industry. Lastly, a large population and market can nurture more competitors. Therefore, a large population seems to be the most important source of advantage in innovation. Also, I will argue that not just size but also the age structure and the distribution of population are important factors in innovation.
There are three main channels through which demographics affects innovation:
- The scale effect.
- The agglomeration effect.
- The aging effect.
The Scale Effect
Economies of scale are ubiquitous in the modern economy. The unit cost of producing 1,000,000 gadgets is usually much lower than the unit cost of producing 1,000 gadgets. In a typical service industry, the unit cost of providing a service (e.g. banking, postal, telecommunications) is also much lower in a large city than providing a similar service in a small village.
Economies of scale are an outcome of specialization and the division of labor. With specialization and the division of labor, each firm or individual can focus on a more specific task, and therefore become more efficient. The Ford Motor Company, in the early 1900s, leveraging the scale advantage of the U.S. auto market, was the first to popularize the assembly-line manufacturing process in which each worker specialized in just one task. China currently has the largest market in the world for most manufactured goods, which helps Chinese manufacturing companies become the most specialized and efficient in the world.
For innovation, the scale advantage of a large country is even bigger. For example, a movie (or a website) for a market of a billion people can have a budget 10 times larger than a movie (or a website) for a market of only 100 million people. For another example, the leading Internet travel brand in China, Ctrip.com (which I co-founded in 1999), leveraging the enormous size of the Chinese population, can afford to hire 5,000 software engineers. In contrast, a similar company in Japan, with only one-tenth of China's market, can only afford to hire a few hundred engineers, whereas a similar website in Taiwan can only afford to employ fewer than 100 engineers. This, of course, assumes that they are confined to the local market and unable to tap the global market. The ability to tap the global market almost always comes after local success and not before it. Even in a global access context, a larger local market can be an advantage as it is possible to outcompete other firms on a global stage when one's local market enables the support of more extensive resources.
It should be to no one's surprise that China has the best high-speed train technology, because the amount of research and development it can afford to invest in this area is so much bigger than that of smaller countries. Japan has the best high-end manufacturing technology; however, with a small domestic market, it is not able to compete with China in high-speed train technology, nor is it able to compete with the United States in the construction of commercial planes. Most new drugs are tested and approved in the United States first, because new drug research requires very expensive, large-scale clinical trials on thousands of subjects, and the United States has a market size advantage over other developed countries.
Some would argue that with globalization, even a small country has access to the global market. This is partially true, because shipping costs and trade barriers today are low. A company in a small country can export standardized manufacturing products around the world. For example, Nokia, a Finnish company, was able to capture a large global share of the mobile phone market. However, for service industries, a large domestic market is still a decisive advantage. Domestic companies have an advantage over foreign competitors because, in service industries, innovators need to interact deeply with the local culture, language, business, and legal environment, all of which are integral parts of the service product offering. A service company typically needs to experiment and tailor their innovation to the domestic market first, and only after it achieves volume production and good profitability can it adapt and export its innovation to other countries. Manufacturing industries in the United States, Japan, and Germany all have a large number of top manufacturing brands, but in service industries, U.S. companies, helped by the scale advantage of the U.S. market, have a disproportionately large share of the top service brands in chain restaurants, hotels, entertainment, and so on. Companies such as Starbucks, Disney, and McDonald's had all grown very big and profitable in the U.S. market before they went on to dominate the world market with their tried and tested business models.
This scale advantage is even more decisive in the Internet service industry. In an industry where network effect is huge, the winners will be those companies who can attract a critical mass of customers first. If, for example, 10 million customers represent a “critical mass,” then to reach the critical mass, the required penetration rate for the U.S. market (with a population of 300 million) is 3%. For Japan (with a population of 100 million), the required penetration rate is 10%. For China, it is less than 1%. For this reason, innovations typically reach a critical mass in the U.S. market earlier than they do in the Japanese market. U.S. Internet companies such as Google, Apple, Facebook, Amazon, and Expedia, after successfully reaching critical mass in the domestic market, quickly expanded to other countries and dominated the world market. A head start for Internet/software companies in a large domestic market is often enough to differentiate a winner from a loser. Nokia was successful when the mobile phone was just a gadget and a simple communication device; when the mobile phone became a computer, software, and Internet product combined, Nokia was no match for Apple.
With a large market, there will be more competitors too, which will intensify the pressure to innovate and raise productivity levels. The U.S. and Chinese Internet markets are the most competitive, and venture capitalists are sometimes willing to support even the second- and third-place players in these markets, whereas in a small country, venture capitalists are usually only able to support the market leader.
The scale advantage of the United States in innovation has been growing, as innovation plays an ever-increasing role globally. In many high-tech and creative industries, the United States has become the global center of innovation. New York is the innovation center of the world for the financial industry; Los Angeles is the innovation center of the world for the film and entertainment industry; Silicon Valley is the innovation center of the world for the information technology industry. Universities in the United States have also become the centers of academic research in all of these areas. The U.S. dollar is the world reserve currency, and English is the international language. Indeed, the dominance of the U.S. economy has been growing in all areas, until the recent emergence of China.
At four times the size of the United States, China has surpassed the United States as the world's largest market for manufactured goods. Similar to U.S. companies, Chinese companies such as Huawei and Lenovo, after reaching critical mass and becoming successful in the domestic market, have also grown into global competitors for U.S. multinationals. China is also quickly catching up with the United States in terms of the size of the service industry. China's travel, logistics, banking, and health care industries are currently only second to those of the United States. In the future, we will see more global service brands from China. China's movie industry is quickly catching up with that of the United States in size. Although Chinese movies may never become as successful as Hollywood films (they might), they will certainly have budgets that will be the envy of the world.
China already has a larger Internet market than the United States. None of the U.S. Internet giants are able to dominate China in the same way as they have dominated much of the rest of the world. Some people think that this is partly due to the Chinese government's ban on certain foreign companies. However, the reality is that when Google exited the Chinese market, it had only 30% of the market share compared with its local rival, Baidu, which had 60% of the market share. Other examples, such as Amazon being soundly beaten by Jingdong.com, Expedia losing out to Ctrip.com, and eBay being outmatched by Alibaba.com, illustrate that Chinese indigenous Internet companies are strong, and U.S. Internet companies are not able to leverage their scale advantages in China in the same way as in the rest of the world. Again, this is the result of the size of the indigenous market. A highly successful local player may be able to leverage a sufficient amount of resources to outcompete a U.S. entrant, however successful they are in the United States and globally.
Innovations in the service and Internet sectors are new business models and practices, which are typically not patentable. Chinese Internet companies usually imitate successful U.S. innovations as they come out, and adapt these innovations quickly to the Chinese market, which is usually already large enough to have a critical mass. Typically, by the time U.S. innovators come to the Chinese market, it is often too late, as Chinese imitators have already built a formidable lead. A prominent venture capitalist commented that for a U.S. Internet company to be successful in China, they need to enter the Chinese market and the U.S. market at the same time. However, it is often too difficult a task for a new startup to try to capture the Chinese and U.S. markets at the same time.
Recently, breakthroughs in artificial intelligence (AI) technologies are transforming many industries. The most promising AI technologies are machine learning technologies, which require a huge amount of data. Chinese Internet companies, with a vast market, are endowed with a huge amount of data. According to a McKinsey report of 2016, China has become one of the leading global hubs for AI innovations, partly due to its data advantage.
In many lectures, when I have emphasized the importance of population in innovation, I have been asked about Israel, a tiny country with an exceptional entrepreneurial and innovation capability. I am not trying to say that population size is the only factor, other factors such as culture and ability are also important, but the ability to scale quickly is critically important.
Even Jewish people are not as successful in smaller countries as they are in larger countries. There are about 20 million Jewish people in the world, about one-third live in Israel, one-third live in the United States, and the final one-third live in the rest of the world. Of the 10 richest Jewish people in the world, eight of them live in the United States, two of them in Russia, but none in Israel. Among them are the founders of Google, Facebook, and Oracle. Because of the limited growth prospect in their small home market, many entrepreneurs in Israel sell their businesses to large international firms, and they are much less successful than Jewish entrepreneurs in the United States.
Can the United States Win the Human Resource Race?
A large population also means a large talent pool. Even though the U.S. population is only one-quarter that of China, as shown in Figure 2.7, up until 2005, the number of U.S. college graduates still exceeded the number of Chinese graduates. College education is a basic requirement for research and development, and the number of college graduates reflects the size of human capital upon which innovation activities can draw. Throughout most of the 1900s, the United States has led the world in number of college graduates.
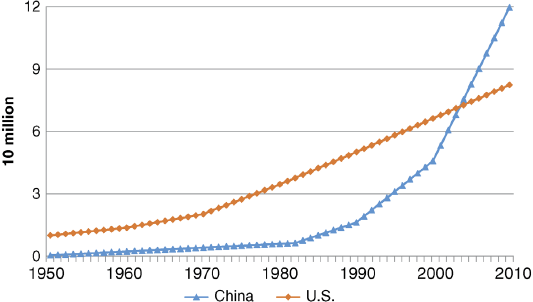
Figure 2.7 Population with a college education in China and the United States
Data Source: The Census Report of China and the U.S. Census Bureau, 2010.
In recent years, with the expansion of college education, China has surpassed the United States in terms of number of college graduates. Many people doubt the quality of Chinese college education; it is often said, for example, that the quality of higher learning must be poor because China has not produced many Nobel Prize winners. However, the lack of Nobel Laureates is not unusual in the early stages of a newly emerging innovation powerhouse. Usually, top-quality academic research lags behind commercial innovation, and Nobel Prize awards, which usually reward scientists for innovative research that took place decades earlier, come much later. While the U.S. economy was the largest and most innovative in the 1900s, it was only after the Second World War that the United States became a leader in academic research and produced a significant number of Nobel Prize winners.
Table 2.1 shows the top five countries by number of Nobel Prize winners in science, including physics, chemistry, and economics. The Japanese economy became one of the leading innovators of the world in the 1980s, but not until after 2000 did it rank high in the league of Nobel Prize winners. We know that Japan's innovation has actually declined since the 1990s; the Nobel Prize actually reflects its scientific research capabilities in the 1980s—as I have pointed out, the prize tends to be awarded to winners some decades after their innovation is first pioneered.
Table 2.1 The countries with the most Nobel Prize winners in science
Data Source: The official website of the Nobel Prize, 2013.
| 1949–1999 | 2000–2013 | |
| United States | 169 (135) | 64 (44) |
| United Kingdom | 44 (33) | 13 (10) |
| Japan | 5 (5) | 11 (10) |
| Germany | 40 (37) | 7 (6) |
| France | 13 (12) | 7 (4) |
| Korea | 0 (1) | 1 (1) |
| Note: The number in parentheses is the number of native-born scientists. | ||
In Table 2.1, the numbers in parentheses are the number of native-born scientists. This shows that in the United States and the United Kingdom, there are a large number of foreign-born Nobel Prize winners. In contrast, almost all Japanese winners are native-born scientists; this shows the strength of the United States and the United Kingdom in attracting foreign talent. I will revisit the relationship between immigration and innovation in later chapters.
In addition, academic research does not correlate perfectly with commercial innovation. The United Kingdom has a similar number of Nobel Prize winners as Germany, but in innovation (measured by number of patents) it has been much weaker. Korea thus far has had almost no Nobel Prize winners nor a world-class university, but still is able to foster innovative companies such as Samsung.
Over the next few decades, the college enrollment rate of many middle-income countries will increase to reach similar levels to that of developed countries; consequently, the number of college graduates will be a higher proportion of the total population in these countries. In China, the number of college students reached 33 million in 2012 compared with only 19 million in the United States. In India, the number of college students is expected to reach 26 million by 2020.
In the long run, India is likely to overtake China in having the largest number of college students. The low fertility rate in China will reduce the young cohort size significantly, and by 2040 the cohort size of 18- to 22-year-olds in China will be 40% smaller than that in India. By 2040, even if China's college enrollment reaches 60%, India will still have more college students than China, so long as India's enrollment rate exceeds 35%.
Of course, education quality also matters. Currently, U.S. universities are the best in the world. Moreover, although the United States has a smaller population, it has the advantage of attracting top talent from around the world. Consequently, the race for human capital among China, the United States, and India will be an interesting one to watch. I will discuss this in more detail in later chapters.
The Agglomeration Effect
In addition to population size, the geographic distribution of the population also matters. Modern industries tend to concentrate in the same region, with the necessary infrastructure in place, as well as ready access to supply chain and labor pool. The U.S. automobile industry concentrates in Detroit, while the Japanese automobile industry concentrates in Nagoya. The Chinese electronics industry has a high concentration in Southern Guangdong and Jiangsu regions. By being closer to upstream and downstream companies, a firm can reduce many costs, such as transportation costs, procurement costs, and other communication costs.
Thanks to its population size, China has the largest and most complete manufacturing industry cluster in the world, with a concentration of many manufacturing companies in densely populated Southern and Eastern regions. Anybody who invents a new product can find hundreds of suppliers capable of making the product quickly and cheaply.
China's cost of labor is no longer the lowest in the world. With a per capita GDP of US$7,500 in 2015, China's labor cost is already several times higher than that of Vietnam, Indonesia, and many other South East Asian countries. From a labor cost perspective, many multinational firms should have moved out of China by now. But many firms have found that for complicated products that require a non-trivial supply chain, smaller countries are no match for China, despite their much lower labor costs. That is the why most high-tech products are still manufactured in China today. In high-end manufacturing, many technologies, components, and manufacturing processes are interrelated, and advantages in one sector can be extended to related sectors. China is leveraging its agglomeration advantage in high-end manufacturing to dominate new manufacturing industries such as solar, wind, and high-end electronics, despite its rising labor costs. No doubt, China will continue to shift away from simple, low-value-added products, but for high-end manufacturing, its agglomeration advantage in the supply chain will continue to be important.
The Agglomeration of Talents
The distribution of high-tech companies is even more uneven than that of manufacturing companies. In the United States, a large number of innovative companies concentrate in Silicon Valley. Six of the top 10 high-tech companies—Google, Cisco, HP, Apple, Oracle, and Facebook—are all in Silicon Valley, and almost half the venture capital in the United States is invested in Silicon Valley. Silicon Valley, a small area from San Francisco to San Jose, has attracted the best talents from around the world, which in turn has led to the creation of some of the most valuable companies in the world.
In manufacturing, the agglomeration effect is a result of the proximity of related firms. The agglomeration effect in high-tech industries is a result of the proximity of creative talents. When creative people get together, the effect is like a chemical reaction. In the evenings in Silicon Valley, restaurants and coffee shops are full of engineers discussing the next technological breakthrough and startup opportunities.
With many high-tech firms being so close to each other, it is easy for workers to move between the firms. Inter-firm mobility is very high in Silicon Valley. If an engineer has a creative idea but is unable to secure funding or support from his company, he can easily take the idea to a different company, or he can start a new company with venture capital funding. High mobility not only enhances the exchange of ideas and innovations, but also allows startup firms to find talent quickly in order to scale their ideas or build on their initial success. Moreover, high mobility fosters a strong culture of entrepreneurship and joining entrepreneurial firms. Critically, high mobility also lowers the cost of failed entrepreneurship, because it is easy for people in a failed startup to find a new job. The necessary condition for high mobility is the agglomeration of many high-tech firms in one region.
Secondly, large cities not only provide for more efficient matching of talent with firms, but also allow more talents from diverse disciplines to work together. The recent innovations in Internet and software technology often require multidisciplinary cooperation, which further strengthens the advantage of large cities. Large cities are particularly attractive to highly educated young singles and couples, because, in the former case, it is easier to find a partner and in the latter case, because both spouses have a greater chance of finding good careers—despite the relatively high cost of living. In recent years, as the agglomeration effect increases, large cities across the world have grown larger and more expensive, while smaller towns, in particular, have witnessed a reduction in population and competitiveness.
The agglomeration advantage is a network effect of a large pool of innovative human resources multiplied by the size of the network. If one geographic region becomes the center of innovation for one industry, then the agglomeration effect tends to self-reinforce, and the center grows larger and more dominant over time. Outside Silicon Valley, cities like Boston also have top universities such as Harvard and MIT, but the dominance of Silicon Valley as the center for innovation has lasted for over 40 years, despite the very high cost of housing. Once a place becomes the center for innovation, the network effect kicks in, and it is very hard for other places to catch up. If we extrapolate from this logic, there should only be one center for each industry in each country. With globalization, there may even be only one center for each industry in the world.
Given that these big cities are more efficient and innovative, what prevents everybody from living in one city? Let's hypothesize: if the earth is no longer habitable, and we all move to a different planet, are we going to spread out evenly on this planet? Such a result would be highly unlikely. We are more likely to live closely together in one giant city. The current distribution of the world's population can be explained in historical terms; when economies were based on agricultural production, the population needed to spread out to do farming; during the Industrial Revolution, the population needed to be close to minerals and ports. Today, high-tech and service firms are the main drivers of economic activity; as a result, more people concentrate in large cities that are the centers of innovation.
A similar pattern is emerging in China too. Large cities in China have grown much faster than other cities. Housing prices in the top 30 cities have soared, while housing prices in smaller cities have stalled or fallen. The difference in housing prices between first-tier cities and small cities in China is now over tenfold. The worry is that there is a real-estate bubble in the first-tier cities. In Shanghai, Beijing, and Shenzhen, the housing price to income ratios are among the highest in the world. In general, people can move more freely within a country but not internationally, so there is a positive relationship between the population of a country and the population of its largest city. Given China's population, it is to be expected that its housing price to income ratio will be the highest in the world for the city centers of its top-tier cities.
Let's look at a graph to confirm these findings. Figure 2.8 shows the relationship between a country's population and the population of its largest city. The horizontal axis is the population size (in log scale) of the country, while the vertical axis is the population size of the largest city in that country. As shown on this graph, there is an obvious positive relationship between the population size of a country and the population size of its largest city. Not surprisingly, the more people in a country, the more of them live in the largest city.
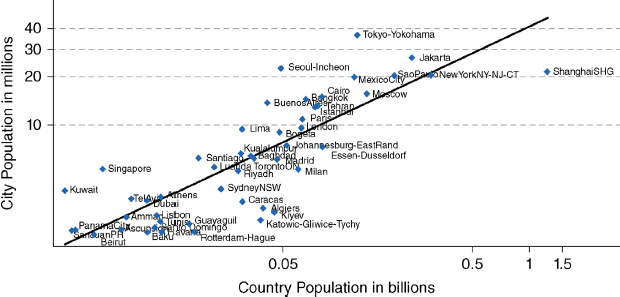
Figure 2.8 Relationship between country population and the population of its largest city
Note: I used data from Demographia (2013) to analyze the populations of major metropolitan clusters around the world. The definition of a metropolitan cluster here is a contiguous urban area, regardless of administrative city limit. Demographia applies a consistent classification rule to the satellite pictures to define a metropolitan area, and then uses the demographic data of the encompassing regions minus the agricultural population to reach the population of a metropolitan cluster. Of all the city population data sources, the data from Demographia is the closest to the economic definition of a metropolitan area, and is measured consistently across the world.
Data Source: Demographia and World Bank, 2013.
With the exception of the Chinese cities, Asia's mega cities are generally above the regression line, which means that their populations are larger than their country populations predict. Tokyo, Jakarta, and Seoul are the largest metropolitan areas of the world. New York, Paris, and London are right on the regression line, which means that their sizes are just as predicted by their country population sizes. The largest city of Germany, Berlin, is much smaller than it should be. The reason is that Berlin's population did not grow from the 1940s to the 1990s, because it was geographically surrounded by East Germany during the Cold War. Since the reunification of Germany, Berlin, as the largest city in Germany, is growing rapidly, something that is a reverse of the general trend for the German population as a whole.
Noticeably, Shanghai is significantly below the regression line. If we stick to our analytical logic, Shanghai (and Beijing) should have much larger populations than they currently do. The largest city in the world is Tokyo, with 37 million residents; Seoul has 23 million residents and is still growing. China's population is 10 times larger than Japan's and 25 times larger than Korea's; however, Shanghai and Beijing, its largest cities (due to the past policy of restricting migration), have only 23 million people, which is too small to fully take advantage of the agglomeration effect. Therefore, Shanghai and Beijing are likely to grow significantly in the future, and real-estate prices in central Shanghai and Beijing will likely be amongst the highest in the world, rivaling those of Manhattan and Central London.
Recently, the city governments of both Beijing and Shanghai have been concerned about overpopulation; they have made efforts to turn away new migrants. However, limiting the size of large cities will not only hurt innovation, but is also unnecessary because congestion and environmental problems can be solved by way of good city planning, regulations, and innovation itself. Building high-speed rail connections between different parts of the city is one way to solve the congestion problems of mega cities. Silicon Valley is currently very congested, and one way to enable more people to live there is to build an efficient high-speed public transportation system such as the one in Tokyo. With over 37 million residents, Tokyo has a very efficient public transportation system. I will examine the topic of demographics and urban planning in more detail in Chapter 4.
The Aging Effect
The third channel through which demographics affects innovation is the aging effect.
Age and Cognitive Ability
In general, a person's physical ability peaks in their 20s. In a modern economy, however, what drives productivity is cognitive skill. How do cognitive skills change as one ages? Different cognitive skills age at different rates, as shown in Figure 2.9.
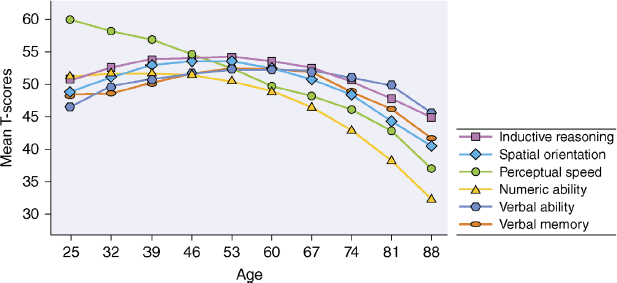
Figure 2.9 The age variation of different cognitive skills
Source: Hedden and Gabrieli (2004). Reprinted by permission from Macmillan Publishers Ltd.
As shown in Figure 2.9, some cognitive skills hold up very well in old age. Verbal skills, for example, peak in the 50s and hold up very well until the 70s. Most cognitive skills, such as numerical skills, peak around the 30s and 40s, but fall significantly after the 60s. Perceptual speed, which reflects the ability to absorb new information, drops quickly after the 20s, which is consistent with the general finding that learning ability usually peaks at a young age.
In general, a person in his/her 30s or 40s is the most creative, because they have already accumulated the necessary academic and business knowledge, yet are still energetic, and can think and learn quickly.
An American economist, Benjamin Jones, analyzed the 300 greatest inventions over the last 100 years (Figure 2.10), and found that 72% of the great inventions were made by inventors aged between 30 and 49, and 42% of the great inventions were made by inventors in their 30s (Jones, 2005).
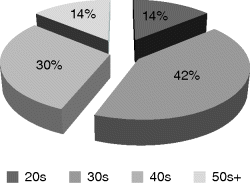
Figure 2.10 Age and great invention
Data Source: Jones (2005).
The age distribution of Nobel Laureates in science (physics, chemistry, medicine, and economics) over the last 100 years also showed similar results; most of the scientists made their revolutionary breakthrough in their 30s (Einstein discovered the theory of relativity at the age of 26). Of course, Nobel Laureates are not your average scientist or inventor. So let's look at the age distribution of patent inventors.
Figure 2.11 shows the age distribution of U.S. patent holders. As shown, patent productivity declines after the mid-40s. Particularly in the information technology field, the most productive and creative engineers and scientists are in their 30s and some even in their 20s.
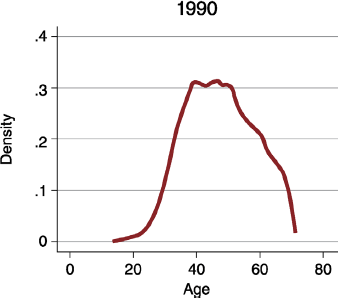
Figure 2.11 Age distribution of U.S. patent holders
Data Source: National Bureau of Economic Research Patent Database, 2006.
Innovation and Entrepreneurship
It is not enough to have just engineers and scientists; entrepreneurs are critical to making disruptive inventions commercially successful. In economics, the topic of entrepreneurship is a difficult subject to analyze. Even the definition of entrepreneurship is elusive. One definition is firm formation, where an entrepreneur is anybody who registers for a new legal entity. By this definition, however, not all entrepreneurs are innovative. Owners of coffee shops can be called entrepreneurs, but they are just small business owners. Regardless of the definition, only innovative entrepreneurs are economically important. Innovative entrepreneurs may not be the sole owner of a startup, because the firm may have other financial investors like angel investors or venture capitalists, but what makes entrepreneurs different from researchers or professors is that they receive a big slice of the reward for their innovation.
Entrepreneurship is a critically important driver for innovation, especially disruptive innovations, which are, by definition, unpredictable. In contrast, micro innovation is usually a predictable improvement of existing technologies or processes. Large, established firms are good at micro innovations, whereas disruptive innovations usually come from new firms. For example, Amazon is an entrepreneurial firm that has disrupted the retail industry, and Uber is a new firm that has disrupted the taxi industry.
So why are incumbent firms not very good at disruptive innovation? The primary reason seems to be because incumbent firms tend to have a vested interest in the status quo (i.e. they benefit from the existing ecosystem and have little incentive to disrupt its functioning and risk their vested interest). For example, the executives at Barnes & Noble did not have the vision to create the best possible online book store. They created an online store only when they were forced to do so by competition from Amazon. Moreover, for disruptive innovation, the incumbent firms are slowed down by their bureaucracy. Lastly, the executives in large firms do not have the high power incentives of the entrepreneurs, who share a much bigger slice of the reward of success. Xerox invented many great technologies—such as the mouse, the local area network, and the graphical user interface—but the managers at Xerox did not have the incentive or flexibility to make risky investments to commercialize these great inventions. In contrast, entrepreneurs take more risks, have more decision power, and obtain a much bigger slice of the eventual reward.
Why is it important for innovative entrepreneurs to have a bigger slice of the reward? First, most innovators will work harder when there is a larger potential for reward. Moreover, only when the economic interest of the innovator is aligned with that of the business owner will the innovator be willing and able to take the right level of risk to make their innovation a commercial success. For micro innovations, where the outcome is reasonably predictable, large firms can design an effective bonus/reward system for innovation. But for disruptive innovation, which is inherently unpredictable, it will be impossible to design a bonus system that adequately rewards the innovator. The best bonus system is to offer a big slice of the profit, effectively making the innovator an entrepreneur. This is the reason why disruptive innovations can thrive only in a startup firm, but not in large incumbent firms, where the economic interest of the innovators is very different from that of the entrepreneurs.
Of the 10 largest high-tech companies, all but one company (the exception being IBM) were created over the last 40 years by young entrepreneurs before the age of 40; these firms quickly turned the latest technological inventions into a commercial success. After they grew very large, they invested heavily in research and development to retain a competitive advantage, which in turn sped up innovations in their industry.
Age and Entrepreneurship
I co-founded Ctrip.com at age 29 with three other co-founders, two of whom were aged 33 and the third aged 36. I have many entrepreneurial friends, and most of them were in their 30s when they started their companies. It seems like 40 is an inflection point: people are much less entrepreneurial in their 40s than they are in their 30s.
My anecdotal observation is borne out by the Global Entrepreneur Monitor, a study by Babson College and London Business School, which surveyed hundreds of thousands of entrepreneurs in many countries. The study found that 25–34 is the most productive entrepreneurial age range, and entrepreneurship declines rapidly after age 45 (Figure 2.12).
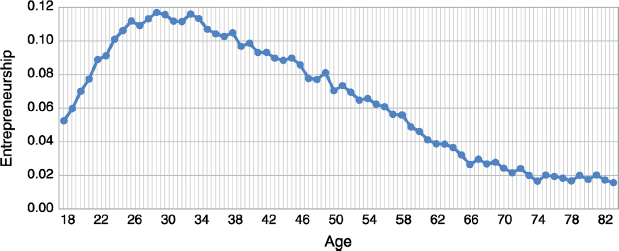
Figure 2.12 Age and entrepreneurship
Data Source: Global Entrepreneurship Monitor, 2012.
The age distribution of entrepreneurship can be explained by way of economic logic. Entrepreneurship is a long-term, high-risk investment. An entrepreneur typically sacrifices a lot of personal savings and leisure time for years, and the probability of failure is high. Young people are more willing to take on such risky investment, because they will have more time to enjoy the fruits of success. A 55-year-old is not going to start a company and work hard for 15 years, because at age 70 a successful entrepreneur will not have many years ahead to enjoy the success—if any. In addition, people after the age of 35 usually have more responsibilities, such as children and family, and therefore are less tolerant of financial risk. Furthermore, as explained earlier, most cognitive skills peak in the 30s and 40s, and learning ability is at its best in the 20s, therefore young people are better at learning new skills and adapting to new environments. Lastly, coming up with creative business ideas and running a startup firm requires certain industry knowledge and business skills, which are typically acquired through experience. Consequently, the best entrepreneurs are aged between 25 and 35, having accumulated some knowledge and experience, but still being open minded, adventurous, and risk-taking.
Entrepreneurship, Aging, and the Blocking Effect
Because talented entrepreneurs tend to typically be in their 30s, having a large number of highly educated 30-year-olds in the population is good for innovation, especially for disruptive innovation. Conversely, if a country is aging rapidly, there will be fewer potential young inventors and entrepreneurs.
There is also a blocking effect in an aging society, where older people block the vitality of younger people. The probability of being in a senior and influential position depends on the age makeup of the workforce. If a firm has an older workforce, it is less likely that young workers will be given much in the way of management responsibility, because the senior positions are already occupied by older workers. It is also for this reason that the age structure of a country is potentially an important determinant of entrepreneurship. A young society provides more opportunities for the young to acquire the skills necessary for entrepreneurship. Conversely, in an aging country, where the cohort size is shrinking over time, young workers are promoted more slowly, are less influential, have fewer skills, and hence are less capable as potential entrepreneurs. Therefore, in an aging country, not only are there fewer young people, but these young people are not as entrepreneurial because their development is blocked by a larger, older cohort.
The link between entrepreneurship and aging has been examined by economists at Stanford and Beijing University (Liang et al., 2014). I first noticed this link when I studied data on Japanese innovation. Overall, the innovation performance of Japan is adequate. Large firms in Japan invest heavily in research and development and acquire many patents. However, these inventions are mostly micro inventions, not disruptive inventions. For example, Japanese firms are continuously improving digital cameras, making them smaller, enhancing their quality, and adding more functionality; nonetheless, they have failed to produce disruptive inventions, such as the iPhone. Since the 1990s, despite churning out many patents, these large Japanese firms have been unable to keep up with the innovations of U.S. firms, especially new high-tech firms.
It was not always like this for Japanese firms. Japanese firms were very creative in the 1970s and 1980s, and came up with revolutionary inventions such as the Walkman, the digital camera, and the video game console. The Japanese economy grew spectacularly in these years, and many economists predicted that it would soon overtake the United States in terms of GDP per capita. However, after the bursting of its real-estate bubble in 1991, the Japanese economy stagnated for the next 20 years, while the U.S. economy pulled ahead, benefiting from a vigorous high-tech industry. The cause of Japan's lost decades is still being hotly debated. Some economists attribute the stagnation to the extended financial crisis, which was triggered by the real-estate bubble bursting. However, the problem with this explanation is that no other financial crisis in history has lasted for more than 10 years, whereas Japan's economy has stagnated for more than 25 years. Many economists today are realizing that the real culprit may well be the aging population and lack of entrepreneurship.
The reason that Japan's economy has underperformed compared with the United States is a lack of entrepreneurship and the failure to develop a dynamic IT industry, as the United States has done over the last 30 years. As shown in Table 2.2, five of the top 10 high-tech companies in the United States were founded after 1985; the founders were very young when they established their companies, with an average age of only 28. In contrast, none of the top 10 high-tech companies in Japan was founded over the last 40 years.
Table 2.2 Top 10 high-tech companies and their founders in Japan and the United States as of 2015
| United States | Age | Founded year | Founded age | Japan | Age | Founded year | Founded age |
| IBM | died | 1911 | Nintendo | died | 1889 | ||
| HP | died | 1939 | Sony | died | 1946 | ||
| Microsoft (Bill Gates) | 61 | 1975 | 20 | Panasonic | died | 1918 | |
| Apple | died | 1976 | Hitachi | died | 1910 | ||
| Cisco (Leonard Bosack) | 64 | 1984 | 33 | Toshiba | died | 1875 | |
| Oracle (Larry Ellison) | 72 | 1977 | 32 | Kyocera (Inamori Kazuo) | 84 | 1959 | 27 |
| Google (Larry Page) | 43 | 1998 | 24 | Fujitsu | died | 1935 | |
| Intel (Gordon Moore) | 87 | 1968 | 39 | Sharp | died | 1912 | |
| Facebook (Mark Zuckerberg) | 32 | 2004 | 20 | NEC | died | 1898 | |
| Amazon (Jeff Bezos) | 52 | 1995 | 31 | Nikon | died | 1917 | |
| Average time of establishment: 43 years | Average time of establishment: 100 years | ||||||
The new firm entry rate in Japan dropped from a 6–7% range in the 1960s and 1970s to 3% in the 1990s (Acht et al., 2004), which amounts to less than one-third of that in the United States and trails behind all other OECD countries (Karlin, 2013). According to an entrepreneurship survey (Global Entrepreneurship Monitor, 2012), the entrepreneurial propensity in Japan is the lowest among all the developed countries. In the United States, 4.9% of adults between the ages of 18 and 64 are working actively to establish new businesses, compared with only 1.9% in Japan.
Japan is the first country in the world to experience a rapidly aging population, as it did not have a baby boom period like the United States or Europe. Almost immediately after the Second World War, Japan's fertility rate fell rapidly and dropped below the replacement level in the 1970s. As a result, the Japanese workforce aged rapidly during the 1990s.
When the workforce becomes older, the promotion speed of young workers slows down. As shown in Table 2.3, in the 1970s about 32% of managers were under the age of 35. This ratio had dropped by almost half to only 16% by the mid-1990s.
Table 2.3 The age structure of the workforce
Data Source: Summary of Report, Basic Survey on Wage Structure (Ministry of Health, Labor and Welfare of Japan), various years.
| Manager grade | Department head | |||||
| Below 35 | 35–39 | 40 and above | Below 45 | 45–49 | 50 and above | |
| 1976 | 31.80% | 31.90% | 36.30% | 24.50% | 31.10% | 41.40% |
| 1984 | 18.30% | 33.10% | 48.60% | 12.50% | 37.30% | 50.20% |
| 1994 | 16.40% | 23.50% | 60.10% | 7.60% | 27.80% | 64.60% |
In the 1970s, about one-quarter of department heads were under the age of 45, and that ratio dropped by two-thirds to only 8% in the 1990s. This is a direct result of the aging workforce, because typically promotions are based on seniority. When the age structure is a top-heavy reverse pyramid, young workers have to wait much longer to be promoted to managerial and executive positions, and they have less responsibility and accumulate fewer of the skills required to be entrepreneurs. When they finally do get promoted and acquire the necessary skills or financial and social capital to be entrepreneurs, they are already in their 40s or 50s and have passed the golden age of entrepreneurship.
Let's compare the entrepreneurial potential of young people in different countries using the Global Entrepreneurship Monitor survey data (Figure 2.13). Japan has the oldest demographic and also the lowest rate of entrepreneurship. Particularly striking is that, in most countries, 30 is the most entrepreneurial age; however, this is not the case in Japan, as 30-year-olds in Japan are even less entrepreneurial than 50-year-olds. The blocking effect magnifies the aging effect and damages the entrepreneurial vitality of the young disproportionately.
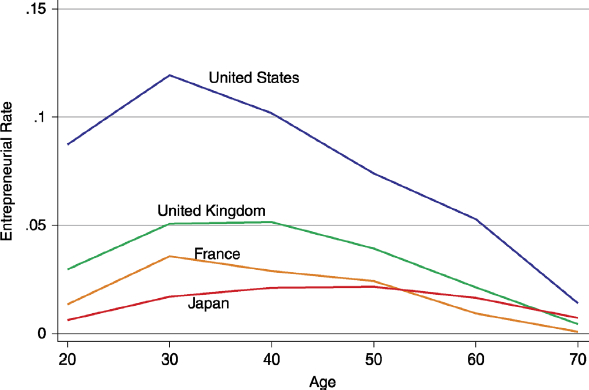
Figure 2.13 Entrepreneurial rates by age group in selected countries
Data Source: Global Entrepreneurship Monitor, 2012.
Over the last 30 years, not only has Japan failed to produce innovative new firms, but the existing large firms have also become very slow in creating disruptive innovations. The same blocking effect comes into play because an internal innovation project to create a breakthrough technology in a large firm resembles an “entrepreneurial project,” and is best led by a young leader in their 30s. However, a typical 30-year-old in a Japanese firm has a low-ranking position and fewer skills and political power in the company, and therefore cannot be an effective leader of such projects. So in an aging country (or aging firm), not only are there fewer creative new firms, but the existing large firms also tend to be more conservative and less creative.
Now, let's look beyond Japan and examine the relationship between aging and entrepreneurship in other developed countries. In Figure 2.14, the horizontal axis is the young ratio (i.e. the share of young workers [20–39 years old] in the total working-age population [to age 59]), while the vertical axis is the probability of the adult population starting a business. As shown in the figure, there is a positive correlation between entrepreneurship and the youthfulness of the population. Of these countries, Japan has the oldest population and the lowest entrepreneurial rate. In contrast, the populations in the United States and in Korea are younger and more entrepreneurial.
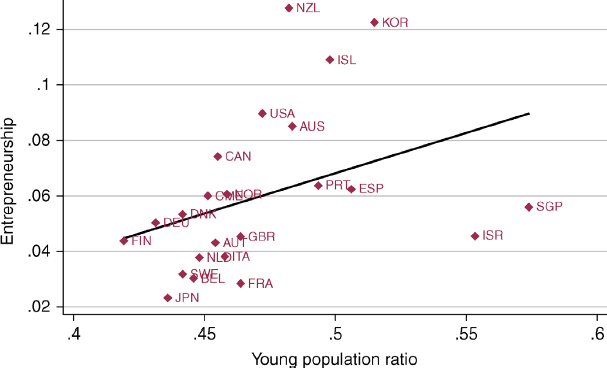
Figure 2.14 Entrepreneurship and the age of the workforce (developed countries)
Data Source: Global Entrepreneurship Monitor, 2012.
In Figure 2.14, if we compare the typical “youthful” country with 50% of the workforce under 40 to a relatively “older” country with just 45% of the workforce under the age of 40, we find that the entrepreneurial rate of the former is almost twice that of the latter. The effect is much larger than can be accounted for by simply having a larger number of young people, so the blocking effect (or other structural effects) must be at play to produce such a large difference in entrepreneurship rates.
If we look beyond the developed countries and include all the countries for which data is available, the positive relationship between a younger population and a higher level of entrepreneurship still holds (Figure 2.15). The age structure of China is currently still young, and Chinese workers are very entrepreneurial.
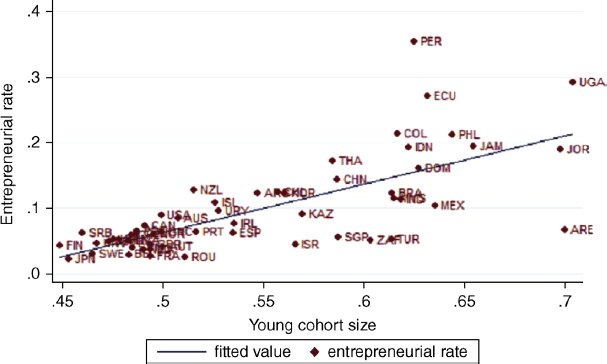
Figure 2.15 Entrepreneurship and the age of the workforce (all countries)
Data Source: Global Entrepreneurship Monitor, 2012.
Finally, let's relate entrepreneurship to economic growth. Figure 2.16 shows the relationship between the GDP growth rate from 2000 to 2009 and the entrepreneurial rate. There is a clear positive relationship—higher levels of entrepreneurship correlate positively with higher economic growth.
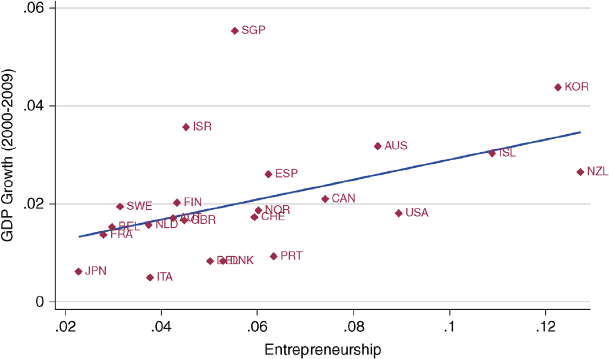
Figure 2.16 Entrepreneurship and economic growth
Data Source: Global Entrepreneurship Monitor, 2012.
See also Table 2.4, which relates the percentage of young people in a country's population to rates of entrepreneurship and GDP growth.
Table 2.4 Relationship between young population percentage and economic growth
Source: Global Entrepreneurship Monitor, 2012.
| Country | Young population ratio | Entrepreneurship | GDP growth |
| Australia (AUS) | 0.483879 | 0.085025 | 1.36656 |
| Austria (AUT) | 0.454646 | 0.04269 | 1.183716 |
| Belgium (BEL) | 0.446187 | 0.030048 | 1.163809 |
| Canada (CAN) | 0.45516 | 0.07417 | 1.229318 |
| Denmark (DNK) | 0.441637 | 0.053032 | 1.084757 |
| Finland (FIN) | 0.419621 | 0.04343 | 1.221713 |
| France (FRA) | 0.464112 | 0.028216 | 1.143666 |
| Germany (DEU) | 0.4316 | 0.050248 | 1.085561 |
| Iceland (ISL) | 0.498158 | 0.109003 | 1.346107 |
| Israel (ISR) | 0.55341 | 0.045406 | 1.420429 |
| Italy (ITA) | 0.458004 | 0.037943 | 1.049537 |
| Japan (JPN) | 0.436312 | 0.022922 | 1.061634 |
| Korea (KOR) | 0.515015 | 0.122566 | 1.53309 |
| Holland (NLD) | 0.448252 | 0.037473 | 1.167373 |
| New Zealand (NZL) | 0.482228 | 0.127477 | 1.297626 |
| Norway (NOR) | 0.458784 | 0.06058 | 1.202318 |
| Portugal (PRT) | 0.493871 | 0.063642 | 1.095549 |
| Spain (ESP) | 0.506265 | 0.062538 | 1.290549 |
| Sweden (SWE) | 0.441733 | 0.031428 | 1.209297 |
| Switzerland (CHE) | 0.451311 | 0.059754 | 1.18662 |
| United Kingdom (GBR) | 0.463995 | 0.044866 | 1.17953 |
| United States (USA) | 0.472314 | 0.089531 | 1.1952 |
Other Factors that Can Enhance Innovation
I have argued in this chapter that demographic factors such as population size, geographic concentration of population, and age composition are important factors for innovation. An interesting question to consider is whether, besides these demographic factors, there are other important factors or policies that can drive more innovation. My general observation is that other policies are either obvious ones that many countries have already implemented, or they are a consequence of demographics themselves. I will list the most important policies for innovation as follows.
Trade Liberalization
Trade liberalization is a very important and well-understood condition for innovation, because the international market can make up the scale disadvantages of a smaller domestic market. Even large countries such as China and the United States cannot ignore the international market, which is still much larger than their domestic market. Large countries in the past were prone to hold a mistaken belief that their domestic market was sufficiently large and therefore that trade with other nations was redundant. The Chinese emperors in the Ming and Qing dynasties made this mistake by shutting off sea trade following the famous Zheng He voyages. The Chinese emperors failed to realize that trade is not simply an exchange of goods, but more importantly it facilitates the exchange of ideas, which is critical to innovation.
Throughout history, those economies that have pursued autarky policies have inevitably ended up trapped in a vicious cycle of technological backwardness and economic stagnation. Fortunately, policy and decision makers in almost all countries have now understood this point, and trade barriers today are much lower than during any other period in human history; globalization is likely to have staying power.
Anti-trust Policies to Encourage Competition
A certain level of consolidation is actually good for innovation, because consolidation allows firms to achieve an economy of scale, which is critical for innovation. On the other hand, monopoly or near monopoly reduces competition and the incentive for innovation. Therefore, the optimal industry structure for innovation is to have several large-scale firms competing fiercely with each other. In many industries, only big countries have the market size to allow multiple large-scale firms to thrive.
Competition is good for innovation. Governments sometimes use this excuse to stop mergers that would otherwise create a monopoly. However, anti-trust policies have become increasingly unnecessary because, in most industries today, technological innovation and disruption are so frequent and fast that it is increasingly difficult for any company to dominate for a very long time. The churn rate in Fortune 100 companies over the last few decades has been accelerating. Moreover, competition is global today, so anti-trust actions on the part of a single country are not only unnecessary, but also often irrelevant.
Government Investment in Basic Research
This strategy helps innovation, but is not essential. Although the United States did not invest in basic research in a meaningful way prior to the Second World War, by the early 1900s, helped by leveraging its scale advantage, it was already leading the world in innovation—especially in automobiles and electronics—making it the richest country in the world. The top universities in the United States also became the wealthiest in the world, giving them the opportunity to hire the best scientists from around the world; not long after, the U.S. universities became the best universities in the world. In a way, the Chinese universities, with their generous government funding, are attempting the same feat today.
Investment in Military Technology
Some economists argue that the U.S. leadership in technological innovation is partially helped by its unmatched military spending. For example, Internet and mobile communication technology was initially funded by way of government and military research. In my view, modern communication technology was indeed greatly helped by access to research derived from military projects, but there are also examples where military projects slowed down innovation in civilian technologies. For example, if it had not been for the atomic bomb, the public today would be less paranoid about the safety of nuclear energy, and it may have been used more widely. At the end of the day, government spending on military technology and research is proportional to the size of the population; only governments from large countries can afford large military research budgets. So, we are back to demographics once again.
Investment in Infrastructure
Good communication, transportation, and energy infrastructures are the basics for economic development and innovation. Most governments understand this; the issue is a question of affordability. Young countries with a high savings rate will have more money per capita to invest in infrastructure. Population agglomeration in large cities also helps, because the utilization and efficiency of infrastructure are higher in densely populated areas.
Good Financial Market and Adequate Venture Capital
Financial markets and venture capital are important for the development of high-tech startup firms. However, governments do not need to do much to bolster this driver of innovation, because the venture capital market is global; capital will move in to provide funding wherever there is a good opportunity, bypassing policy barriers if necessary. Fifteen years ago, China did not allow foreign investors to invest in Internet companies, and the local stock market was effectively closed to Internet companies. However, lured by the enormous size of the market, U.S. venture capitalists invented the “VIE” structure to work around these laws. In a typical “VIE” setup, venture capitalists used a consulting agreement to invest in Chinese Internet companies indirectly. Not long after, the Chinese Internet sector was flooded with U.S. venture capital money. That is why most successful Chinese Internet companies today were backed by U.S. venture capitals and are listed on the NASDAQ.
Innovation and Education
Can education spending boost innovation? If one looks at the data, innovation is positively related to education. However, is there a causal relationship between education and innovation? Probably not, because causality could run the other way (i.e. when a country is innovative, it will be richer and can afford to invest and raise the level of education). Actually, most middle-income countries have greatly expanded their college enrollment rate in recent years. Countries such as Thailand and Malaysia have a college enrollment rate of over 30%, a level not much lower than that of developed countries. However, in terms of innovation, these countries still lag far behind high-income countries. It seems that a high education level is a necessary precondition but not the deciding condition for innovation.
Having a high college enrollment rate is not sufficient because the quality of higher education is just as important. If we use GRE General Test results as a measure of the quality of college students, we find that East Asian students have very high math scores. For GRE verbal scores, Asian and European students have roughly the same scores, whereas students from other parts of the world score much lower in both categories.
In general, the quality of education—as manifested by GRE scores—is strongly related to the economic development level of a country (see Figure 2.17). The exceptions are India and China. According to the quantity and quality of college graduate students, China is predicted to be a high-income country and India is predicted to be a middle- to high-income country. I will analyze the economy and innovation capacity of China and India in later chapters.
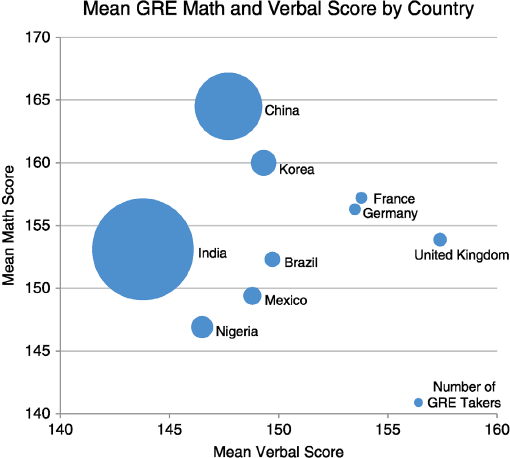
Figure 2.17 GRE score by country
Data Source: Educational Testing Service, 2015.
Expanding college enrollment rates is easy, but enhancing the quality of college education is very difficult.
Moreover, we have not yet found a way to teach creativity. Creativity is a combination of both personality and a very complex skill set. So far, no organization can accurately measure or test creativity, let alone try to teach it. After a country expands its college enrollment rate to a certain level, the return on further investment is low. In my view, rather than increasing investment in education, raising the efficiency of learning and allowing talented students to graduate and start working earlier is a better way to promote innovation. If talented people can start their career earlier, they will have more time to do creative work, therefore having a larger window in which to engage in entrepreneurial efforts. For talented young women, graduating earlier will give them more time in life to have children and a successful career. Speeding up the learning process is certainly possible in the Internet age. I will revisit the topic of accelerated learning later in the book. Apart from getting talented students to finish school and start a career earlier, increasing investment in education is unlikely to significantly improve the creativity of young graduates.
Conversely, a poor education system does not seem to hurt creativity either. China, Korea, and Japan all possess an inefficient test-oriented, rote-learning high-school education system, where students spend one to two years memorizing and preparing for college entrance exams. However, this does not seem to hurt the high level of innovation capabilities in China and Korea (and Japan before it experienced a demographic shift to an older population).
Some would argue that the innovators are the cream of the crop; entrepreneurs, engineers, and scientists comprise no more than 5% of the world's population. So a country can concentrate its resources to provide the best possible education for these elites. This logic relies on the assumption that you know which 5% will become effective researchers and successful entrepreneurs. The reality is that nobody knows which 5% will be the next Steve Jobs (of Apple) or Jack Ma (of Alibaba); to say that both of these men were not the best students is probably an understatement. The best innovators and entrepreneurs are largely random. It is not like picking a child to be a top basketball player; for that purpose one can use height as a strong predictor of future success. It is more like trying to select a kid to be a top football player. This is a much harder prediction to make, as no specific physical quality is determinative. Good football players tend to emerge from the bottom up in grass-roots organizations.
The Chinese government has been reasonably successful at building an effective basketball team, because it can concentrate its resources on training the few tall children who are selected for the team; however, the top-down approach will not work for football (as manifested by the abysmal performance of the Chinese football team). Similarly, to foster innovation and entrepreneurship, countries must provide high-quality basic college education to a large number of people, and allow talented people like Steve Jobs and Jack Ma to emerge.
The most talented entrepreneurs and scientists do not require much in terms of extra training or investment either. As long as there is an open and fair competitive environment, they will emerge. It is as if all those able to access a decent education have been dealt a lottery ticket in the game of talent. At the end of the day, the size of a country's talent pool will be proportional to the number of young people available who can access adequate education, and this ultimately is determined by the size and demographic makeup of the population.
The case of Japan tells a good story of the relationship between the quality and quantity of education vis-à-vis pure demographic and population numbers. In the 1960s and 1970s, Japan had a young and growing population. Despite most of its young people being from poor families, a large proportion of them turned into outstanding entrepreneurs and scientists. In the 1990s and 2000s, as young cohorts shrank, despite increased spending on education, their creativeness and entrepreneurship declined. During the 1960s and 1970s, many Japanese graduate students were attending top research universities in the United States; however, in recent years, the number of graduate students from China, India, and Korea has surpassed those from Japan by a wide margin. According to the Washington Post, over the past 10 years, the number of Japanese graduate students attending U.S. universities decreased by 27%, while the number of students from Korea, India, and China has more than doubled. The reason for this reduction in student quality could be another version of the blocking effect. When a country ages, young people's prospects of promotion are slight, and the reward for working hard is low; they therefore lose the motivation required to compete.
In Japan, both the quality and quantity of young talent has suffered as the country falls into the low-fertility trap with a shrinking and aging workforce. Increasing investment in human capital cannot make up for the loss of quantity, and money should instead be spent on raising the fertility level to increase the number of young people in the talent pool.
In this chapter, I have showed that the fundamental factors that drive innovation are demographic factors. The three most important demographic factors are the size of the population, the age composition, and the geographic distribution of the population. To use a company analogy, this conclusion is not surprising because a company's competitiveness is ultimately determined by the number and quality of its human resources. Other factors—such as strategy and execution—are also important, but strategies are created and executed by employees. Similarly, for a country, the ultimate drivers of innovation are all connected to its population, primarily its size and distribution, and age makeup.
