Chapter 6
Japan
Japan is the best case study of an aging society, because Japan was the first large economy to experience the structural issues that an aging society causes. Some small European countries are also experiencing the effects of an aging population; however, because labor is more mobile in the EU and some countries have a large immigrant population, the effect of aging is much milder than that in Japan. Despite recent policy changes, Japan still fails to attract a large number of immigrants (immigrants make up less than 2% of the total population), which makes it an excellent case study for the effects of aging and low fertility. The negative effect of aging on innovation and entrepreneurship in Japan is something that we have discussed previously, and is a particularly alarming and unexpected outcome.
The Aging of the Japanese Economy
Over the last few years, I have often traveled to Japan to study its demographic problems. One day, I learned that one of the country's prominent Internet entrepreneurs, Takafumi Horie, was arrested for violating security laws. I did not pay a lot of attention to this piece of news at first, because his company was not very large. But when I discussed the topic of innovation and entrepreneurship in Japan with other economists, Takafumi Horie was constantly mentioned. One economist commented: “You want to know why Japan has so few young entrepreneurs? Just look at what we did to Takafumi.” Later, I found out that Takafumi was one of the rare breed of entrepreneurs under the age of 40. He founded a popular Internet portal called livedoor.com and challenged the dominance of traditional media. He is independent, conspicuous, and sometimes eccentric. He wears t-shirts instead of business suits to work. He dates models, drives expensive sports cars, and openly challenges and criticizes the status quo. These behaviors are not accepted by the Japanese business community, so he was demonized by the media. When he tried to acquire a TV station, he was sued and later arrested for accounting and security violations. Interestingly, the Japanese economist said “his downfall discourages any non-conformist to challenge the status quo.”
Takafumi may well be guilty of breaking the law, but what is striking is the sympathy for him among the academic community following his conviction. I have now come to understand that the reason is that many scholars believe that Japan really needs more people like Takafumi. Many economists think that the long stagnation of the Japanese economy is a result of a lack of entrepreneurs, especially young high-tech entrepreneurs. Compared with the United States, Japan has far fewer new high-tech companies. Even China and Korea have a larger number of new high-tech companies than Japan.
Japan was not always short of entrepreneurs. In the first half of the twentieth century, young Japanese entrepreneurs started high-tech companies such as Sony and Panasonic; however, over the last 30 years, there have been almost no successful new high-tech companies. Is it any wonder that the Japanese people place their hopes on young entrepreneurs like Takafumi? But the older-generation business community controls all the power and resources, and young entrepreneurs, especially non-conformists, are mistrusted, often marginalized, and sometimes oppressed.
The Lost Decades
The Japanese economy was the most vibrant among the developed countries from the 1950s to the 1980s. The GDP growth rate exceeded 8% per annum for over 30 years. Japanese firms grew rapidly to become leading innovators in many industries, such as electronics, automobiles, and industrial equipment. In the competitive country rankings of the world in 1990, Japan was ranked number one, and it looked like its per capita GDP would soon surpass that of the United States.
However, as its population started to age rapidly during the 1990s, and its economic fortunes reversed completely, the engine of innovation quickly lost steam, and even the most innovative Japanese firms became sluggish and conservative. First in semiconductors, then in software and communication, and lastly in genetics, Japanese firms were leapfrogged by entrepreneurial firms from the United States and emerging countries such as China and Korea. In 2008, the competitive ranking of Japan dropped out of the top 20 for the first time since the 1980s, and the growth rate of the Japanese economy was near zero. In recent years, the country's per capita GDP has been far lower than that of the United States.
Economists used to refer to Japan's economic stagnation, which began in the 1990s, as “the lost decade.” However, it should be “the lost decades,” because the economic recession has lasted almost three decades now. In the first few years of “the lost decades,” many economists attributed the problem to the financial crisis triggered by the crash of real-estate prices; they believed that after the financial crisis passed, the Japanese economy and Japanese firms would regain competitiveness. Today, many economists have begun to realize that the financial crisis was not the problem, although it may have been an important inflection point. A financial crisis usually lasts between two and four years, and the longest and deepest financial crisis—the Great Depression—lasted 12 years. Japan's economic recession has now lasted for more than 25 years. Other economists have attributed the problem to the sharp rise of the yen against the dollar, which affected the competitiveness of its export industry; however, Japan maintained a large trade surplus throughout “the lost decades.” Japanese companies lost out to U.S. and Korean firms not because of high costs, but because of the loss of leadership in technology and innovation, both directly related to the aging of the Japanese workforce.
Figure 6.1 shows the economic growth rate and the aging index (old-age dependency ratio) over the last 60 years in Japan. The aging index went up sharply in the 1990s, and at the same time economic growth slowed to 1% a year.
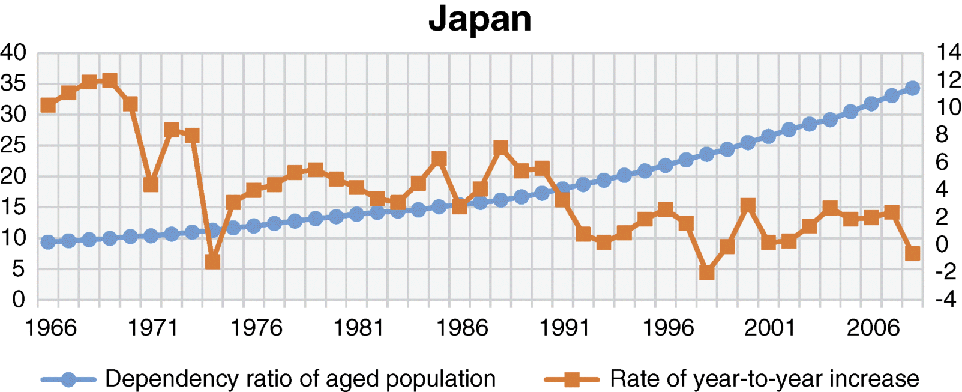
Figure 6.1 GDP growth and the aging index of Japan
Note: Old-age population index = (population above 65 years of age/population aged 15–64) × 100%.
Data Source: Statistical Survey Department, Statistics Bureau, Ministry of Internal Affairs and Communications, 2008.
The population of Japan became the oldest in the world after the 1990s because, unlike the United States or other developed countries, Japan did not have a post-war baby boom and its fertility rate dropped rapidly in the 1950s and 1960s (Figure 6.2). Meanwhile, the Japanese became wealthy very quickly. When the country reached a per capita income of US$5,000 in the 1970s, its fertility rate dropped below the replacement level. When it reached a per capita income of US$10,000 in the 1980s, its fertility rate dropped to below 1.6. In the 1990s, the fertility rate dropped to 1.5, and currently stands at 1.4.
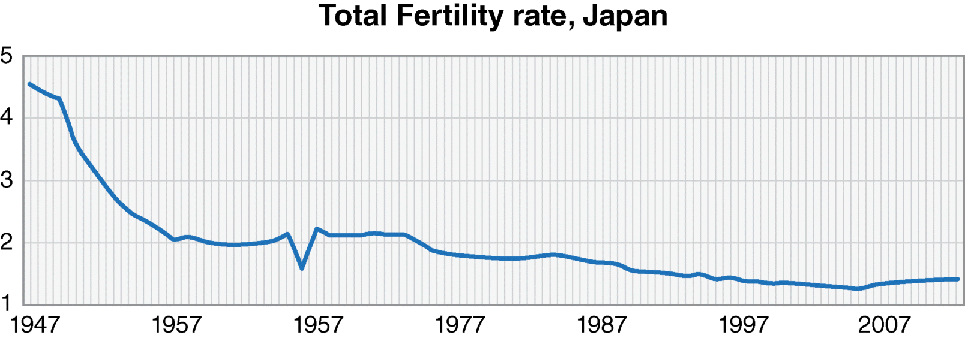
Figure 6.2 Post-war fertility rate in Japan
Data Source: Statistical Survey Department, Statistics Bureau, Ministry of Internal Affairs and Communications, 2011.
The low fertility rate in Japan since the 1970s has caused severe aging in the population structure. The number of people over age 65 has increased from 7% in the 1970s to 22% in 2016. People between the ages of 20 and 39, as a total share of the population, dropped from 35% in the 1970s to only 27% in 2016. Figure 6.3 compares the population structure of Japan and that of the United States in 2016 and China in 2040. As we can see, the U.S. population is much younger than that of Japan today, and although China has a much younger population today, by 2040 it will have almost as old a population as Japan does today.
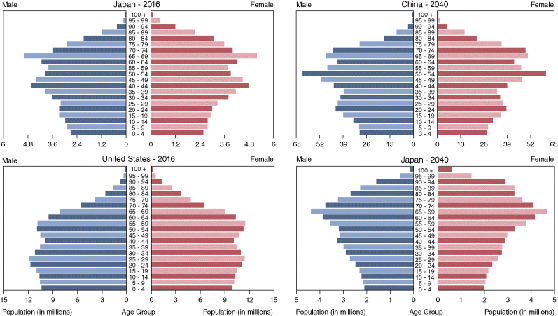
Figure 6.3 Age structure of Japan vs. the United States in 2016 and China vs. Japan in 2040
Data Source: U.S. Census Bureau, 2015.
Currently, in Japan, every worker needs to support 0.8 elderly people; in addition, many people in Japan continue to work after the age of 65. Japan's annual government revenue is 8.3 trillion yen (about US$83 billion), but the size of the public pension fund is over 100 trillion yen. The huge expense required to support the elderly has made the Japanese government the most indebted among all high-income nations, with over 600 trillion yen in debt. In the future, to deal with the budget-deficit problem, Japan will either have to increase the retirement age further or raise taxes, which will put a break on entrepreneurship.
With an aging workforce, a typical Japanese company has more 40- and 50-year-old employees than 20- and 30-year-old employees. Usually, Japanese companies put a lot of weight on seniority when evaluating employees for promotion. When there are more middle-aged and older workers in companies, the promotion of young workers slows down. Table 6.1 shows the ages of managers in Japanese firms.
Table 6.1 Age composition of Japanese managers
Data Source: Summary of Report, Basic Survey on Wage Structure (Ministry of Health, Labor and Welfare of Japan), various years.
| Team managers | Department heads | |||||
| Year | <35 | 35–39 | >40 | <45 | 45–49 | >50 |
| 1976 | 31.8% | 31.9% | 36.3% | 24.5% | 31.1% | 41.4% |
| 1984 | 18.3% | 33.1% | 48.6% | 12.5% | 37.3% | 50.2% |
| 1994 | 16.4% | 23.5% | 60.1% | 7.6% | 27.8% | 64.6% |
In the 1970s, 32% of Japanese team managers were under the age of 35, but by the 1990s, only 16% of team managers were under 35. Let's look at the age composition of the executives. In 1970, 25% of department heads were under the age of 45, but by the 1990s, only 8% of department heads were under 45. The ratio of young managers declined more rapidly than the ratio of young workers in the workforce, and the ratio of young executives declined even faster than that of young managers. This is because, in general, the promotion of managers and executives is more or less related to seniority, so the effect of an aging workforce will be magnified in the age composition of management and executives as a result. It becomes a vicious cycle, because as the management of the firm becomes older, they will make promotion criteria more conservative and seniority-based to protect their power and influence. As a result, young workers in Japan occupy more junior positions, have less managerial experience, have less financial and social capital, and thus have lower entrepreneurial capability.
In Chapter 2, I showed that 30-year-olds tend to be the most able potential entrepreneurs because, at this age, they have accumulated industry experience and social connections, yet are still risk-taking, hard-working, and quick to adapt to new technologies. In an aging country, 30-year-olds are not only few in number, but also have less entrepreneurial ability because they occupy lower positions in the work environment; hence, they have less experience and social capital with which to start a new firm.
In a slow economy, typically a firm has no growth and hires very few people. This increases the risks for entrepreneurs. In such an environment, when a startup fails, it will be very difficult for the employees in the startup firm to find regular jobs in other firms. Consequently, young people are reluctant to join startups; as a result, startups usually have a hard time attracting talented workers, making them less competitive and less likely to succeed.
Japan is a good case study of this phenomenon. Figure 6.4 shows the number of new Japanese firms that emerged between 1966 and 1999. The firm-formation rate dropped from 6–7% in the 1960s to only 3–4% in the 1990s.
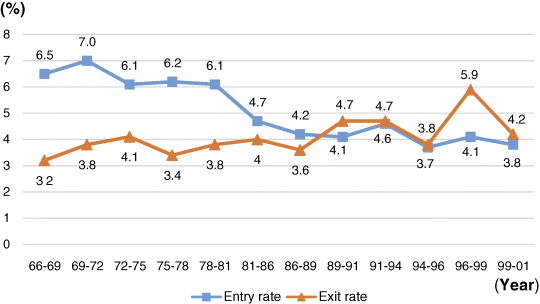
Figure 6.4 Firm formation and exit in Japan from 1966 to 1999
Data Source: MPHPT, Establishment and Enterprise Census of Japan.
Compared with the United States, the entrepreneurial rate in Japan is much lower; in fact, the Japanese overall entrepreneurial rate is the lowest in the world, as shown in Figure 6.5.
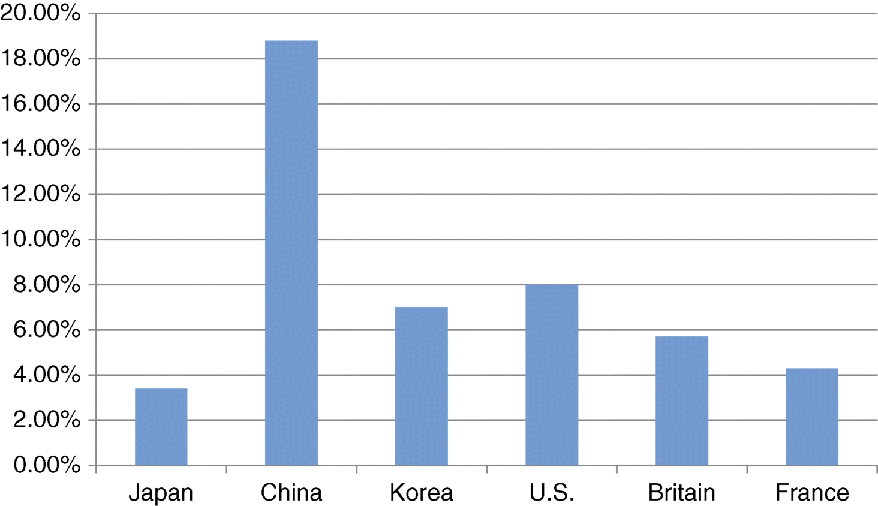
Figure 6.5 Entrepreneurial rate of different countries
Data Source: Global Entrepreneurship Monitor, GEM 2009 Global Report, 2010.
New firms are crucial in high-tech sectors, such as software and Internet sectors. Let's compare the top 10 high-tech companies in the United States and Japan as ranked by Forbes in 2010 (Table 6.2). The table also shows information on the founders of these companies. Of the top 10 companies in the United States, eight were founded during the last 30 years. In Japan, none of the high-tech companies were founded over the last 40 years.
Table 6.2 Top high-tech companies in Japan and the United States
| United States | Age | Company founded | Age of founder | Japan | Age | Founded year | Age of founder |
| IBM | died | 1911 | Nintendo | died | 1889 | ||
| HP | died | 1939 | Sony | died | 1946 | ||
| Microsoft (Bill Gates) | 61 | 1975 | 20 | Panasonic | died | 1918 | |
| Apple | died | 1976 | Hitachi | died | 1910 | ||
| Cisco (Leonard Bosack) | 64 | 1984 | 33 | Toshiba | died | 1875 | |
| Oracle (Larry Ellison) | 72 | 1977 | 32 | Kyocera (Inamori Kazuo) | 84 | 1959 | 27 |
| Google (Larry Page) | 43 | 1998 | 24 | Fujitsu | died | 1935 | |
| Intel (Gordon Moore) | 87 | 1968 | 39 | Sharp | died | 1912 | |
| Facebook (Mark Zuckerberg) | 32 | 2004 | 20 | NEC | died | 1898 | |
| Amazon (Jeff Bezos) | 52 | 1995 | 31 | Nikon | died | 1917 | |
| Average time of establishment: 43 years | Average time of establishment: 100 years | ||||||
Six out of the 10 founders of top U.S. high-tech companies are still alive today. Their average age when they founded the company was 28. Bill Gates founded Microsoft at the age of 20; Steve Jobs founded Apple at 21; Leonard Bosack and Sandy Lerner founded Cisco at 33 and 31, respectively; Larry Ellison founded Oracle at the age of 32; Larry Page and Sergey Brin founded Google at the age of 24; and Michael Dell founded Dell at the age of 22.
These six high-tech U.S. companies had a market capitalization of US$600 billion in 2010. Because the shareholders of these companies are mostly founders, employees, and other U.S. nationals, these six companies have generated an enormous amount of wealth for the United States over the last 30 years, equivalent to 5% of the country's GDP in 2010. On the other hand, the value of existing Japanese firms has not grown significantly over the last 30 years. The superior performance of the U.S. economy in recent years is mostly due to the aforementioned high-tech firms, especially new high-tech firms.
One interesting observation is that the leading Internet websites in Japan are either run by professional managers of foreign multinationals or large syndicate firms. For example, the biggest search engine is Google Japan, the largest portal and auction site is Yahoo Japan, and the largest social networking site is Line, which was originally a subsidiary of a Korean company. But in the United States, China, or even Korea, almost all the Internet companies were founded by young local entrepreneurs. This is another piece of evidence pointing to the lack of entrepreneurship in Japan.
The Aging of Japanese Firms
It is not just entrepreneurial firms that are lacking in Japan, even established firms are slow and clumsy at competing with U.S. firms in the area of innovation.
A few years ago, executives from my company Ctrip.com visited a leading travel company in Japan. The top executive teams of the two companies sat on opposite sides of a large meeting table. Even though the two companies are of similar size, the contrast was vivid as the executives of the two companies were from two different generations. On the Ctrip.com side all were 30-something men and women. On the Japanese company side all were men aged 50 or above. Occasionally during the meeting there would be young employees coming in and out of the meeting room, but they were secretaries and assistants to the management of the Japanese firm.
Typically, after a young college graduate joins a Japanese firm, he is gradually promoted based primarily on seniority, and he remains with the same firm until retirement. I use “he” because most women quit the workforce after marriage. Once I had a conversation with one of my Japanese friends, who commented that the seniority culture continues to be both strong and prevalent. To give one example, young workers need to address the senior workers differently. I inquired whether a young worker would need to change the way he addresses an older worker were he to be promoted to a higher position than the older worker. My friend thought about that for a while and said that as far as he was aware, this has never happened in his department. I asked why such a suffocating seniority-based culture continues to persist in firms. He said it is because senior positions are all occupied by older employees, who really do not have any incentive to change.
Many economists think that an aging workforce, combined with an ossified promotion system, sapped the vigor out of Japanese firms and caused them to lose the race of innovation against young U.S. firms. For example, Japanese firms once dominated the semiconductor industry. In the 1980s, Japanese firms had over half of the world's market share. NEC and Toshiba were the top two semiconductor firms in the world. Half of the top 10 semiconductor firms were from Japan. However, 20 years later, only two of the top 10 semiconductor firms are Japanese. The number one and two firms are Intel and Samsung from Korea (Table 6.3). The reason for the downfall of Japanese firms is that during the 1990s, there were major innovations in the semiconductor industry. Intel captured the opportunity of using microprocessors for personal computers, and Samsung captured the market in memory chips for personal computers. In contrast, Japanese firms were very slow in reacting to new opportunities; instead, they continued to focus on perfecting the mainframe chips, and did not transition to the personal computer market; as a result, they lost out to U.S. and Korean competitors.
Table 6.3 Top 10 semiconductor makers, market share by region (excluding foundries, US$bn)
Data Source: Research Bulletin of IC Insights, 2017.
| Rank | 1993 | 2000 | 2006 | 2016 | 1Q17 | |||||
| 1 | Intel | 7.6 | Intel | 29.7 | Intel | 31.6 | Intel | 57.0 | Intel | 14.2 |
| 2 | NEC | 7.1 | Toshiba | 11.0 | Samsung | 19.7 | Samsung | 44.3 | Samsung | 13.6 |
| 3 | Toshiba | 6.3 | NEC | 10.9 | TI | 13.7 | Qualcomm (1) | 15.4 | SK Hynix | 5.5 |
| 4 | Motorola | 5.8 | Samsung | 10.6 | Toshiba | 10.0 | Broadcom (1) | 15.2 | Micron | 4.9 |
| 5 | Hitachi | 5.2 | TI | 9.6 | ST | 9.9 | SK Hynix | 14.9 | Broadcom (1) | 4.1 |
| 6 | TI | 4.0 | Motorola | 7.9 | Renesas | 8.2 | Micron | 13.5 | Qualcomm (1) | 3.7 |
| 7 | Samsung | 3.1 | ST | 7.9 | Hynix | 7.4 | TI | 12.5 | TI | 3.2 |
| 8 | Mitsubishi | 3.0 | Hitachi | 7.4 | Freescale | 6.1 | Toshiba | 10.9 | Toshiba | 2.9 |
| 9 | Fujitsu | 2.9 | Infineon | 6.8 | NXP | 5.9 | NXP | 9.5 | NXP | 2.2 |
| 10 | Matsushita | 2.3 | Philips | 6.3 | NEC | 5.7 | MediaTek (1) | 8.8 | Infineon | 1.9 |
| Top 10 Total ($B) | 47.2 | 108.1 | 118.2 | 202.1 | 56.0 | |||||
| Semi Market ($B) | 108.8 | 218.6 | 265.5 | 365.6 | 99.6 | |||||
| Top 10% of Total Semi | 43% | 49% | 45% | 55% | 56% | |||||
Another example is the software industry. In the 1990s, many enterprise resource planning (ERP) software companies emerged in the United States and Europe. ERP refers to software that helps large manufacturing firms to manage their operations. The leading ERP software makers, Oracle and SAP, have become some of the largest software companies in the world. Smaller firms include Baan, which is based in the Netherlands, and PeopleSoft, which is based in the United States. It is immensely puzzling that Japan, which has the world's largest and most advanced manufacturing companies, does not possess even a single global ERP software company. The reason is that Japanese firms, in comparison with U.S. firms, were very slow to adopt new information technologies. The adoption level of ERP software is only half the level it is in other developed countries (Whittaker and Cole, 2006). The adoption of CRM software (a type of ERP software) in Japanese firms was one-third lower than in U.S. and European firms, and even significantly lower than in Korean and Taiwanese firms. A survey examining the reason for the low level of adoption of ERP software found that Japanese management had a low level of understanding of IT and were generally reluctant to change their existing business processes (Miyoshi and Nakata, 2011). Slow adoption of new information technologies was related to the conservative mentality of Japanese executives, who were considerably older than their U.S. counterparts.
Other high-tech industries in Japan, such as telecommunication equipment, were also slow to adapt to new IT. Overall, not only does Japan lack new entrepreneurial firms, but its established firms have also become conservative, slow, and rigid. When the pace of technology innovation and adoption accelerated globally, the older Japanese executives had a hard time catching up.
The Aging of Japanese Society
I often discuss the predicament of the Japanese economy with Japanese economists; many of them agree that the low fertility rate and aging society are the root cause of the problem. The question is what the Japanese government has done to raise the fertility rate. As I discussed in Chapter 5, the budget allocated for pro-fertility policy measures is low compared with other developed nations with low fertility rates. Currently, Japan's fertility rate is only 1.4, still one of the lowest in the world. I asked one economist why Japan did not spend more money to raise the fertility rate. The answer I received was: “The main constituents of the Japanese government are the elderly.”
As Japan ages, there are more old people and there are even more old voters relative to young voters, because the elderly turn out at the voting booth at a much higher rate than the young. In 2003, the voter turnout ratio of people aged between 60 and 69 was 77%, whereas the turnout ratio of people aged between 20 and 29 was only 35% (Coulmas et al., 2008). Because the elderly dominate the voting booth, public policies naturally lean toward the elderly. With an ever-growing budget to support the elderly, the Japanese government does not have the will or means to allocate more money to subsidize child-raising young couples.
Over the last few years, as Japan experienced a recession with stagnant wages, the benefits for the elderly have remained stable, while young workers have been hurt disproportionately. Moreover, the unemployment rate of young workers is much higher than that of the middle-aged or elderly. Deflation in the Japanese economy also helps the old at the expense of the young, because even with no nominal raise, the incumbent old workers' real wages keep rising, and firms are reluctant to hire or give raises to young workers. Figure 6.6 shows the wage trends of different cohorts. It shows that the wages of recent young cohorts grew much more slowly than their parents' generation, whereas the wages and benefits for the older cohorts were largely unaffected (Coulmas et al., 2008).
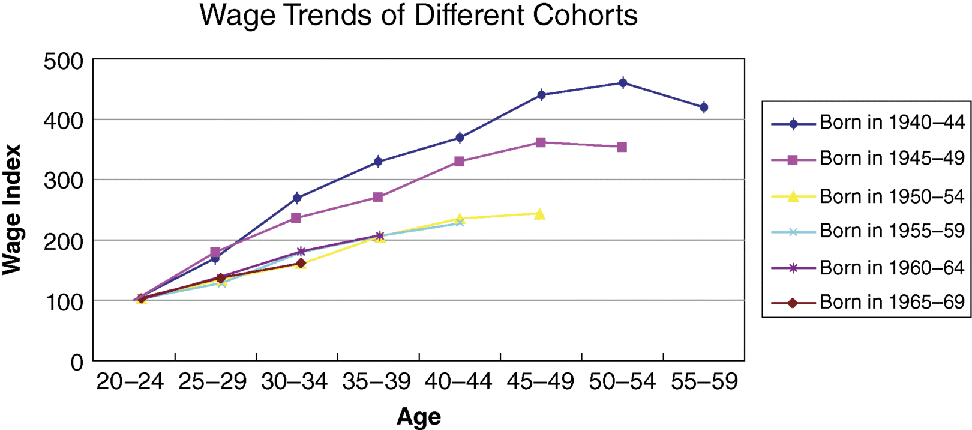
Figure 6.6 Japanese wage trends of different age cohorts
Data Source: Basic Survey on Wage Structure (annual edition), Ministry of Health, Labor and Welfare; Consumer Price Index, Ministry of Public Management, Home Affairs, Posts and Telecommunications.
As the population ages, more social resources and attention are tilted toward the elderly. Last year, as I was filling out a form at a Japanese hospital, three presbyopia glasses with different magnification levels were provided. No wonder Japan is said to be a paradise for the elderly. The benefits and perks enjoyed by the elderly after retirement are the envy of the world. After retirement, Japanese workers receive 70% of their pay, much higher than the average salary of young workers. The government transfers a large sum of income from the young to the old via the tax and benefit system.
It is not necessarily unfair to transfer income from the young to the elderly, because eventually every young person will be old. But just like when old people occupy more management positions, the firms become less innovative, when older people have more wealth and power relative to the young, the government and society become more conservative. Japanese politicians tend to be older than their U.S. counterparts, and they adopt more conservative economic policies. In the 1990s, when the real-estate bubble burst, the Japanese government adopted a zero-interest policy, a very conservative approach that allowed the badly managed banks or firms to survive. Many Western economists did not understand why the government did not let these low-productivity firms fail, so that more productive firms could expand and new firms emerge, thus releasing the much-needed energy of creative destruction. This policy choice might also be related to the aging of the workforce. The median age of Japanese is 45 (whereas the median age of Americans is 35). If the government allowed these firms to fail, it would have been much more difficult for an average 45-year-old employee to learn new skills and find a new job after being laid off, in comparison with an average 35-year-old. Maybe the Japanese government made the right choice in allowing these low-productivity firms to survive, because the adjustment cost for the elderly employees would have been too heavy to bear in the context of society as a whole.
For similar reasons, the Japanese government is too conservative in its immigration policy. The immigration policy is still very restrictive, because the Japanese government worries too much about the short-term burden on public resources or the short-term pain of assimilating immigrants. But again, from the point of view of the elderly who control the votes, this is a rational choice, because the elderly care only about the short term—the period of time in which they will live. In an aging society, public policy tends to be conservative and short-term focused. Young people's interests are marginalized, because they are politically marginal.
The marginalization of the young also has a negative impact on marriage and the fertility rate. More young people have to live with their parents in order to save money. The parents, typically wealthier, are also happy to have their children at home and provide additional financial support. A word has been coined for these young men who live with their parents: “herbivore.” These “herbivore” men typically have temporary jobs or no job, and are financially dependent on their parents. Because their career prospects are slight, they have neither the motivation to work hard, nor the motivation to pursue a marriage partner who might complicate this comfortable arrangement. A best-selling book entitled The Herbivore will Change Japan (in Japanese, available from http://bookclub.kodansha.co.jp/product?isbn=9784062725354) estimates that two-thirds of men between the ages of 20 and 34 are “herbivores.” By traditional standards, it is increasingly hard for Japanese women to find suitable husbands; consequently, many Japanese women remain single. The percentage of single Japanese women in all age groups has increased rapidly in recent years, as shown in Table 6.4. The percentage of single women in the 30–34 age group increased from 10% in 1985 to 32% in 2005, and many of them will never marry; late marriage or no marriage at all further reduces the fertility rate. The marginalization of the young further exacerbates the problem of low fertility, forming a vicious cycle.
Table 6.4 Unmarried rate of Japanese women and first marriage age
Data Source: The Institute for Research of Social Guarantee and Population in Taiwan, 2008.
| Year | 15–19 | 20–24 | 25–29 | 30–34 | 35–39 | 40–44 | 45–49 | 50 | First marriage age |
| 1950 | 97 | 55 | 15 | 6 | 3 | 2 | 2 | 1 | 23.6 |
| 1955 | 98 | 67 | 21 | 8 | 4 | 2 | 2 | 2 | 24.7 |
| 1960 | 99 | 68 | 22 | 9 | 6 | 3 | 2 | 2 | 25.0 |
| 1965 | 99 | 68 | 18 | 9 | 7 | 5 | 3 | 3 | 24.8 |
| 1970 | 98 | 72 | 18 | 7 | 6 | 5 | 4 | 3 | 24.7 |
| 1975 | 99 | 69 | 21 | 8 | 5 | 5 | 5 | 4 | 24.5 |
| 1980 | 99 | 78 | 24 | 9 | 6 | 4 | 4 | 5 | 25.1 |
| 1985 | 99 | 81 | 31 | 10 | 7 | 5 | 4 | 4 | 25.8 |
| 1990 | 98 | 85 | 40 | 14 | 8 | 6 | 5 | 4 | 26.9 |
| 1995 | 99 | 86 | 48 | 20 | 10 | 7 | 6 | 5 | 27.6 |
| 2000 | 99 | 88 | 54 | 27 | 14 | 9 | 6 | 6 | 28.6 |
| 2005 | 99 | 89 | 59 | 32 | 18 | 12 | 8 | 7 | 29.4 |
To sum up, Japan is deeply mired in the low-fertility trap. The aging workforce has contributed to the lack of entrepreneurship and innovation. Japan was routed by the United States and other emerging countries in the race of high-tech innovation. The effect of an aging society is self-reinforcing; an aging society makes it more difficult for the young to break away from their shackles, because the elderly control the voting booth and company management positions. As a result, the young are in a weaker position in an aging society and face numerous challenges, including a diminished likelihood of getting married and having children.
