
Chapter 4
Resource and Environment
In 1968 an American biologist, Paul Ehrlich, published a popular book entitled Population Bomb (Ehrlich, 1968), in which he predicted that the earth would not be able to sustain an explosive growth in population. In 1972, in a report entitled “The Limit for Growth” (available online at en.wikipedia.org), several environmentalists predicted population growth would cause famine, pollution, and the depletion of natural resources. The report forecast that the world would run out of gold in 1981, oil in 1992, and copper in 1993. Of course, these predictions turned out to be very wrong, but many people still worry that overpopulation will eventually lead to resource depletion and damage the prospects of long-term economic growth.
I am often asked the question: What is the earth's carrying capacity? According to a meta-analysis of 69 past studies that have assessed the limit of world population (Van Den Burgh and Rietveld, 2004), the estimates range from 7 billion to 1,000 billion. Interestingly, the estimates kept rising with the growth in world population. Before 1950, the medium estimate was 6.1 billion; after 1950, the medium estimate was 160 billion. Malthus once predicted that the limit of the world's population was 1 billion. Earth is now home to 7 billion people. Owing to the great demographic shift currently occurring, the world's population will likely stop growing at around 10 billion. Almost all economists think that the earth can comfortably support a population of 10 billion. Moreover, it seems highly likely that in the next 100 years, humanity is going to colonize other planets or at least exploit them for their natural resources. And yet, every time there is a short-term energy or food price hike, the worry over resources and the environment comes back.
Natural Resources and Economic Growth
Let's look first at the relationship between natural resources and economic growth. The abundance of natural resources per capita is closely related to the population density. In general, low-density countries have high resource endowment per capita. If we examine the relationship between population density and the per capita income level, we find that there are many high-density poor countries, such as India and Vietnam, and many low-density affluent countries, such as the United States and Canada; however, there are also many high-density affluent countries, such as Japan and the Western European countries, and many low-density poor countries, such as Brazil and most of the African countries. So, in general, there is no relationship between resource abundance and the potential for economic development. Over the last few decades, resource-poor Asian countries such as China and India have grown much faster than comparatively resource-rich Latin American and African countries. There actually seems to be a negative relationship between resource abundance and sustainable economic development.
In an economy based on agriculture, higher population density leads to lower per capita availability of farm land, and thus to lower per capita income. In industrial economies, a larger population allows for greater specialization and more opportunities for trade, and therefore higher productivity. On the other hand, more people tend to consume more resources and generate more pollution. For service and knowledge economies, a large population will lead to more innovation, hence higher productivity and faster economic growth. So, as the world economy progresses, higher density is increasingly becoming an advantage.
Figure 4.1 shows the relationship between population density and per capita level of income. There is no clear positive or negative relationship between wealth and population density. If one takes a look at the situation within each country, usually the higher-density regions are more affluent than more sparsely populated regions.
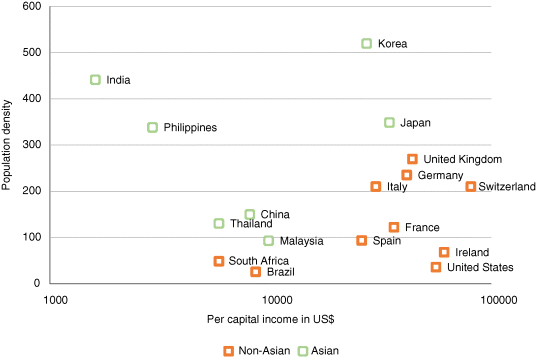
Figure 4.1 Relationship between population density (# of people per km2) and income
Data Source: World Bank, 2015.
In modern economic history, no country has been economically constrained by resource bottlenecks. Countries with very poor resource endowment, such as Japan, Korea, and Israel, have done and are doing extremely well. In contrast, there are many examples of the “resource curse,” a phenomenon sometimes called the “Dutch disease.”
The “Dutch disease” describes the woes of the Dutch economy during the 1960s. After large gas reserves were discovered in 1959, Dutch exports soared. Gas exports resulted in an influx of foreign currency, and the local currency appreciated. That made other parts of the economy less competitive in international markets. Corporate investment was tumbling. That was not the only problem. Gas extraction was (and is) a relatively capital-intensive business, which generated few jobs. From 1970 to 1977, the unemployment rate increased and corporate investment tumbled.
Latin American countries are rich in mineral and oil resources, which generate high levels of export and income. However, these countries have low levels of economic development. Many economists have analyzed the “resource curse” phenomenon. The Nobel Laureate, Joseph Stiglitz, and his co-authors recently wrote a book on the subject of the “resource curse” (Humphreys et al., 2007). They argue that because these countries rely on the “oil dollar,” or the resource dollar, they have fewer incentives to invest in strong institutions and in human capital. As a result, resource-rich countries tend to have corrupt governments, weak institutions, and poorly developed human capital. Moreover, because oil and commodity prices can fluctuate widely, the economies of resource-rich countries are at the mercy of the volatility of world commodity markets.
Many people still worry that with economic and population growth, natural resources will become increasingly scarce and therefore inaccessibly expensive. However, the data on resource prices and supply suggests the opposite.
It seems that the more resources we use, the more resources are discovered and can be extracted and exploited. As shown in Figure 4.2, if no more oil is discovered in the future, we will run out of oil in 2064 (beginning the countdown in 2010). However, in 1980, it was predicted that we would run out of oil in 32 years' time (i.e. 2012). This is because, even though oil consumption is growing, the amount of oil being discovered is growing even faster. Furthermore, there is still a lot of room for developing new alternative energy sources. Consequently, oil prices have remained quite stable in the long term. There was considerable concern regarding resource depletion in the 1960s and 1970s, and yet now that the world's population has doubled, the concern about resource depletion has subsided.
Figure 4.2 Oil reserve/yearly oil consumption (1980–2014)
Data Source: BP plc, energy charting tool, 2015.
Similarly, there have been recent concerns that China's surging demand for energy would drive up global resource prices. China is the largest consumer of energy, even though its GDP is only 60% that of the United States. At a per capita level, the energy consumption levels of China are only 30% that of the United States, but already 70% that of Japan. As China grows wealthier, its consumption of energy will continue to grow. However, the growth of demand in China will slow down because its manufacturing industry, which is more energy intensive than its service industry, will slow down significantly. China could eventually be a more efficient energy user than the United States, because it is more densely populated and can, as a result, invest heavily in high-speed railways and subways, which are more energy efficient than airplanes and cars. The country's overall energy demand will grow at a much slower rate than its economy, at about 2–3% a year over the next 20 years, and this additional demand can be more than met by the global increase in energy supply.
In fact, if prices can reflect the supply and demand of a particular resource, then depletion of that resource will not be a big problem, because as the price of one resource rises, other alternative resources will be put to use. At one point, the price of oil was over US$100 a barrel. However, the high price stimulated innovation and, very soon after, solar power and the electric car industry took off in a big way for the first time as an alternative to oil. As a result, the price of oil came back down to about US$50 after a few years.
Theoretically, there is virtually no limit to alternative energy sources. All the energy on earth ultimately comes from the sun. Only one hour of sunlight on earth is enough to support the entire annual energy consumption of the world today. The reason why we are still using a large amount of fossil fuel is because it is still relatively abundant and inexpensive. Shale-gas technology has further driven down the cost of energy, and the United States, with a rich shale-gas reserve, will be a net resource exporter in the near future. China also has rich shale-gas resources, which are more than enough to support its consumption if the price of oil rises.
Occasionally, there are periods of high energy prices. In the 1970s there was an oil crisis, caused by geopolitical events. But usually it takes just a few years for the world to adjust to alternative resource sources, so oil and energy crises are usually short-lived. In early 2000, the rapidly growing Chinese economy drove up the demand and oil prices soared. However, by 2015, the high price of oil accelerated the development of solar, wind, and shale-gas technology, which drove the oil price back down.
Figure 4.3 shows the added value of the oil, mineral, and agricultural industries as a percentage of the world's GDP since 1947. As shown, relative to the overall economy, the value of natural resources is on a long-term downward trend. This is a reflection of improved extraction and exploration technology, as well as the development of many new alternative resources.
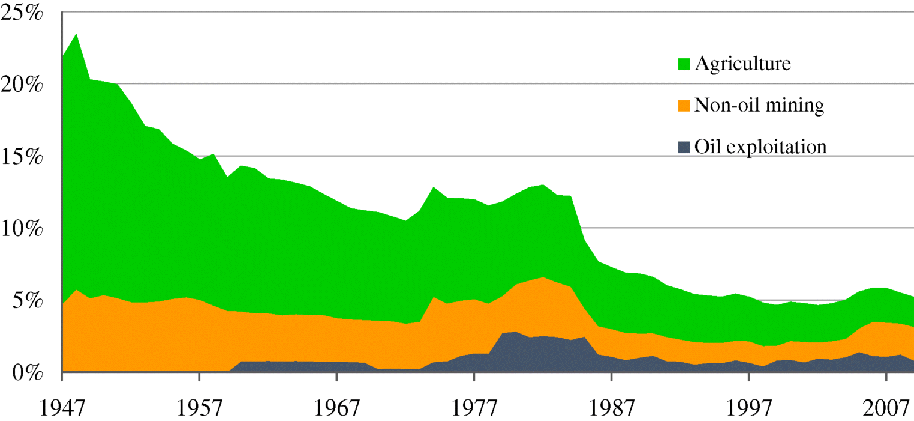
Figure 4.3 Natural resources as a share of wealth (1947–2007)
Note: Mineral = non-oil mining + oil exploitation industry. The value of the oil exploitation industry before 1960 is assumed to be zero, due to a lack of data.
Data Source: Madison, 2009 and World Bank.
Today, only 5% of the world economy is connected directly to natural resources. This is consistent with our everyday experience. Metal, plastic, and synthetic fibers in cars, computers, and houses are inexpensive relative to the value of the end-products. Moreover, service industries, which consume even fewer resources, are becoming more important economically; for this reason, one can extrapolate that the long-term downward trend of resource importance will continue.
Within a country, resource-rich regions in general tend to be comparatively poor, and densely populated regions are relatively affluent. In the United States, the vast majority of people live less than 50 miles from the coast, where most of the major corporations, universities, and research facilities are located. The United States is the most powerful country in the world, not because of its rich natural resources, but because of its rich human resources.
Clean Energy
Most scientists believe that global warming is caused by the emission of greenhouse gases such as CO2. Industrialized nations have been the main source of emission historically, but in recent years, China has become the largest producer of greenhouse gases. As the Chinese economy continues to grow, its emissions will grow also. To curb this, China and other major countries have aggressive plans to invest in clean energy. Will clean energy be able to solve the problem of greenhouse emissions? Will clean energy technology be as abundant and cheap as fossil fuel energy?
If there was no progress in energy technology, we would still be using wood for heating and cooking. The world would be an even more polluted place. Relative to wood and coal, oil and gas are much cleaner and more efficient. In the last few decades, we have realized the potential risk of global warming from burning fossil fuels; this has created a need for cleaner, alternative energy sources. In recent years, a lot of money has gone into clean technology research and development, and a significant amount of progress has been made.
The widespread utilization of clean technology has only just begun. On the demand side, the world's population will grow slowly and peak in this century, and on the supply side, advances in clean technology will progress steadily. So, in the long run, clean technology will almost certainly be able to meet most of the energy requirements of the world.
There are many promising clean energy technologies (e.g. nuclear—including fusion in the future—wind, and solar). I will focus on a few of these energy technologies.
First, solar power is the ultimate energy source, and is an almost unlimited supply source. One hour of solar energy on earth is enough to supply the annual electricity consumption of the world. In order to build a solar power plant to supply electricity for the entire population in the United States, only 1% of the U.S. landmass is needed. The main raw material for solar panels is silicon, which is one of the most abundant resources on earth. With the current technology, solar panels have a useful lifespan of 20–30 years, but the energy required to produce a solar panel is equivalent to only about 2–3 years of electricity generated by that solar panel.
Moreover, the technology behind solar power is rapidly improving. Currently, the cost of solar-powered energy is still twice that of a coal-powered energy source. Figure 4.4 shows the cost forecasts for electricity generated by solar power vs. coal power.
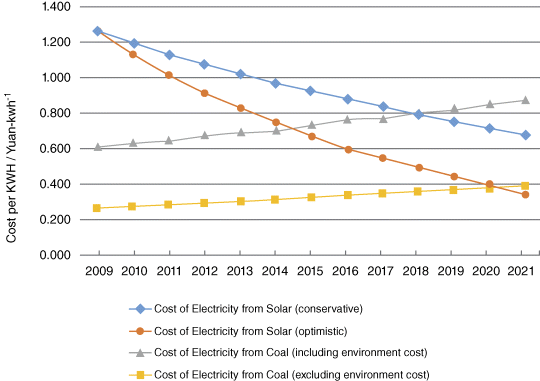
Figure 4.4 Cost trends of electricity from solar and coal
Data Source: Analysis of Cost, Price and Technology Development of Electricity from Solar in China, Institute of Electrical Engineering, Chinese Academy of Sciences, 2009.
The two downward-sloping lines are forecasts of the cost of solar electricity; one is a more optimistic forecast, the other is a more conservative forecast. The two upward-sloping lines are the forecast of the cost of electricity from coal. One represents the direct cost, while the other includes the environmental cost. As shown, the cost of solar power is declining rapidly, at about 7–10% each year, while the cost of coal power is increasing as transportation and environmental costs increase. Currently, if we include environmental costs, the cost of solar power is already on a par with that of coal power, and in 10–15 years it will be on a par with coal power in terms of direct costs as well.
The other promising clean technology is nuclear power. Although nuclear power is theoretically limited in supply, it is also very abundant; the world's current known reserves of uranium alone are estimated to be able to provide all the energy consumption of the world for 200 years. The cost of nuclear-generated electricity is already cheaper than that of coal. The main concern regarding nuclear power is safety; however, in fact, the number of people who have died from nuclear power generation is far smaller than the number of people who have died in coal-mining accidents, never mind those deaths connected to the polluting effects of coal usage. The early nuclear accidents were caused by the use of an immature technology. France has been able to generate most of its electricity from nuclear power, and has never had a major accident. Of course, like solar power plants, a nuclear plant requires considerable investment, and also takes time to build.
Besides solar and nuclear energy, there are quite a few other promising energy sources, such as wind and thermal power. Currently, their costs are higher than those of traditional sources, but declining steadily. In the future, mankind will have many sources of energy as alternatives to fossil fuel. Of course, all of these new technologies require substantial investment and take time to develop and scale safely.
Given the speed with which the cost of clean energy is declining, fossil fuel will be replaced by clean energy sources within a few decades. The only scenario that could prevent this from happening is the cost of fossil fuel also dropping rapidly with improved technology. The recent discovery of shale-gas technology has dramatically lowered the cost of natural gas and oil, and the subsequent drop in prices is slowing down the adoption of clean energy. In sum, mankind does not need to worry about the depletion of energy or resources, which are not scarce; and neither is human ingenuity.
World Food Production
Similarly to energy, world food prices have been stable or declining over the last three decades, despite a steady increase in both population and consumption.
As shown in Figure 4.5, there was a spike in food prices in the 1970s. However, after the 1980s, advancements in agricultural technology gradually caught up with the increasing demand. This was particularly the case in the 1980s when the Green Revolution spread to India, turning it from a food importer to a food exporter, despite its rapid population growth throughout this period. China's agricultural technology and output also improved greatly in the 1980s, especially after farming was re-privatized by Deng Xiao Ping's reforms.
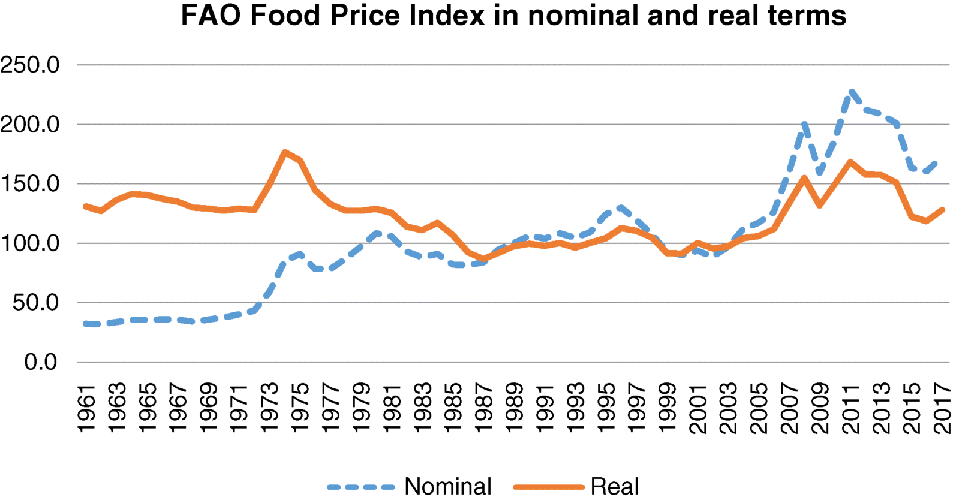
Figure 4.5 World food commodity prices
Data Source: Food and Agriculture Organization of the United Nations, 2017.
Figure 4.6 shows the grain output per hectare of selected countries. As we can see, production per hectare has increased steadily at an annual rate of 2–3%, much faster than the overall growth in the global population. Also, the increase has been across all countries, including high-income countries such as France and Germany, as well as poor countries such as India. Even given all of these improvements, the efficiency gap between rich and poor countries is still large, and there is still ample room for improvement for countries such as India and Brazil.
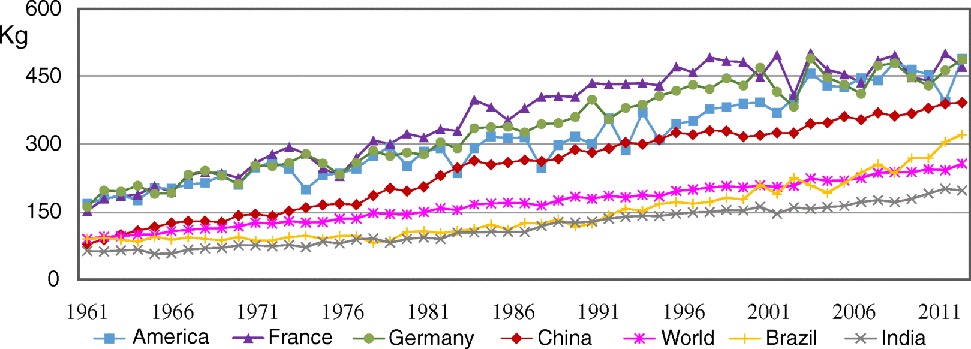
Figure 4.6 Grain output per hectare in selected countries
Data Source: Food and Agriculture Organization of the United Nations, 2013.
China has shown the largest improvement in production efficiency. Its food production per hectare is approaching the level of high-income countries. China is the largest consumer of food, and is roughly 95% self-sufficient. It is also important to recognize that with advancements in agricultural technology, China is able to support nearly 20% of the world's population with only 7% of the world's arable land, which implies that the world has more than enough land to feed the world's population. China will import more food in the future, not because it cannot produce enough food itself, but because of the lower food prices from other producing countries. With lower prices of imported food, China will no longer have the comparative advantage of producing all the food it needs.
On the demand side, the growth of food consumption will slow down significantly. First of all, the growth of the world's population has slowed down significantly. Moreover, food consumption per capita for major countries, including China, has already leveled out (Figure 4.7). China's per capita calorie intake is already at 3,000 per day, almost the same as Korea's, and higher than that of Japan (2,800 per day). So, it can be predicted that with reduced demand and continued progress in agricultural technology, food prices will be stable in the foreseeable future. The overall share of agriculture in the world economy will continue to decrease. In summary, food will likely be both abundant and cheap in the future.
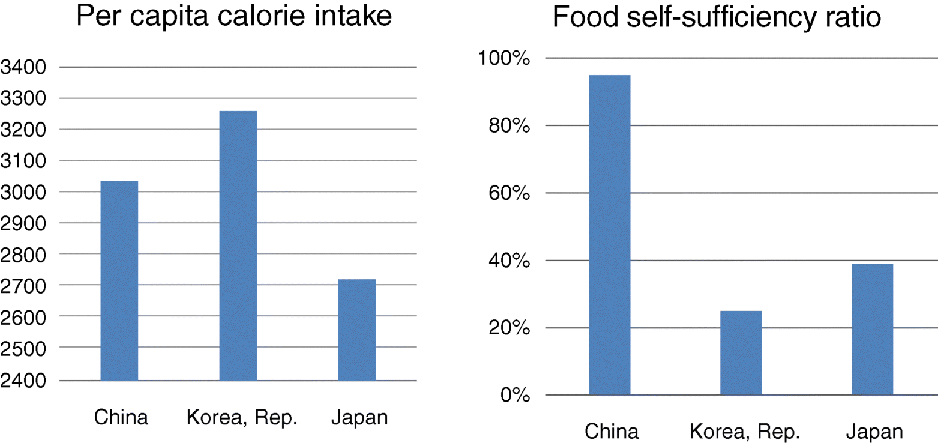
Figure 4.7 Calorie intake and food self-sufficiency ratio of China, Korea, and Japan
Data Source: Food and Agriculture Organization of the United Nations, 2014.
Will Water Become Scarce?
Water is a renewable resource, and the total quantity of water on earth is fixed. There is plenty of water for everybody on earth; however, the distribution of fresh water is uneven. Typically, in densely populated areas, water infrastructure projects need to be built to produce, recycle, or transport water from other areas. Water scarcity is not a resource problem but an economic problem of investment in water production, distribution, and conservation.
For example, water usage in agriculture is far more efficient in developed countries than in developing countries, because of investment in water-conserving technology and facilities. Israel, a country with one of the lowest levels of water resource per capita in the world, pioneered the use of drip irrigation systems, which use 50% less water than conventional irrigation. Moreover, the technology of seawater desalination has improved to a point where costs of desalination are under US$1 per cubic meter, just slightly higher than those of conventional water plants. Israel produces a lot of water with desalination technology. With most of the world's population living near the coast, there is no limit to how much water can be supplied, and the price of water should never exceed US$1 per cubic meter.
When a government sets the water price below its cost, this will invariably lead to shortages of water. Setting the price below cost is economically inefficient, but for many reasons that is exactly what many governments are doing right now. Whenever something is priced below cost, there is a need to either subsidize or ration, which gives the impression of a physical water shortage.
For example, in Beijing, there is a constant concern that water is going to “run out.” In fact, the problem is that the water price is too low; it is set at US$0.3 per cubic meter when the actual cost is US$0.7 per cubic meter. Beijing is surrounded by farmland, which uses a lot of water inefficiently. Because of the low price, Beijingers do not have an incentive to conserve water. For example, one of the major uses of water in Beijing is for the washing of cars! Moreover, due to the low price having been set, the government needs to provide huge subsidies to water plants. The government's message to the public is that water is scarce and that everyone should save water; this creates the wrong impression, that water is scarce. Beijing is very close to the coast and in theory can produce an unlimited amount of desalinated water at a cost of under US$1 per cubic meter, a price certainly affordable by the now wealthy city. However, no private company will engage in such a project because the water price is artificially capped at only US$0.3 per cubic meter. The example of Beijing is typical of most cities around the world, where water shortages are a byproduct of government-regulated pricing of something considered a necessity, rather than actual water shortages. As these cities grow wealthier, there will be more water available as a result of either continuing government subsidy or private investment.
Demographics and the Environment
With rapid industrialization, major cities in China and India have become the most polluted places in the world. Will population growth and industrialization inevitably lead to environmental disaster?
Air Pollution
For the last few years, the eastern and northern parts of China have been frequently affected by heavy smog. In the fall of 2014, PM2.5 (a measure of the air pollution index) hit a historical record of 500, making headline news across the world.
Undoubtedly the smog was caused by modern industry trying to meet the consumption needs of a large population. Based on this reasoning, environmentalists generally believe that there are too many people in the world, and population control will be good for the environment.
There are even extreme environmentalists who openly advocate a human extinction movement, in which they ask volunteers to stop having children. They believe that this is the only way to protect the environment. However, nothing could be further from the truth! Population size is only a minor factor in environmental pollution. The choices of technology and lifestyle have far greater impacts on the environment than population size. For example, using automobiles for commuting consumes 10–20 times more energy and resources compared with the use of public transportation or clean-energy vehicles. Furthermore, the most aggressive population estimate is that the peak world population will only double from today's level of 7 billion to 14 billion. So, the demographic factor will have a much smaller impact than changes in lifestyle and technology, for example transportation technology.
From 1980 to 2012, energy consumption in China grew by 400%, but China's population only grew by about 10%. In the future, when the population of China stabilizes, whether or not China can solve its environment problems depends almost entirely on the speed of adoption of clean technologies.
Historically, humans have been able to successfully solve severe environmental problems by investing in technology specifically intended to address it. For example, London was once called “the city of fog.” Interestingly, the heavy fog in London early in its industrial history was considered a sign of progress, and was believed to generally be good for health. Its negative effects were not understood, and nothing was done about it. However, as the smog or “fog” became heavier and a more frequent occurrence, it became obvious that it was harmful to the health of the city's inhabitants. After a five-day heavy fog in 1952, which caused many deaths, the U.K. government decided to take a series of measures to solve its pollution problem. Today, London has many more residents living in the city, but its air quality is greatly improved and ranked 38th out of 143 large cities (WHO, 2011).
In another example, between 1943 and 1980, Los Angeles experienced heavy smog. Under the joint efforts of government, businesses, and residents, especially after the enactment of the Clean Air Act in 1970, air quality in the city gradually improved, despite its still notoriously heavy traffic. The number of pollution days dropped from 121 in 1977 to only 54 in 1989, and to zero in 1999. At the same time, over the last 50 years, the city's population has increased from 4.3 million to over 14 million. With better emission technology, air quality has continued to improve, despite oil consumption in and around the city increasing many times over.
The experience of London and Los Angeles shows that air quality can be improved in the context of rapid population growth. Figures 4.8(A) and (B) show the relationship between pollution, country population density, and per capita GDP for the largest cities in the world (>2 million population). In both graphs, the vertical axis is the air population index, which is PM10. Figure 4.8(A) shows that there is no strong positive correlation between population density and air pollution. In contrast, Figure 4.8(B) shows a clear negative relationship between air pollution and per capita income. Therefore, it is evident that as a country becomes wealthier, its air quality improves regardless of its population density.
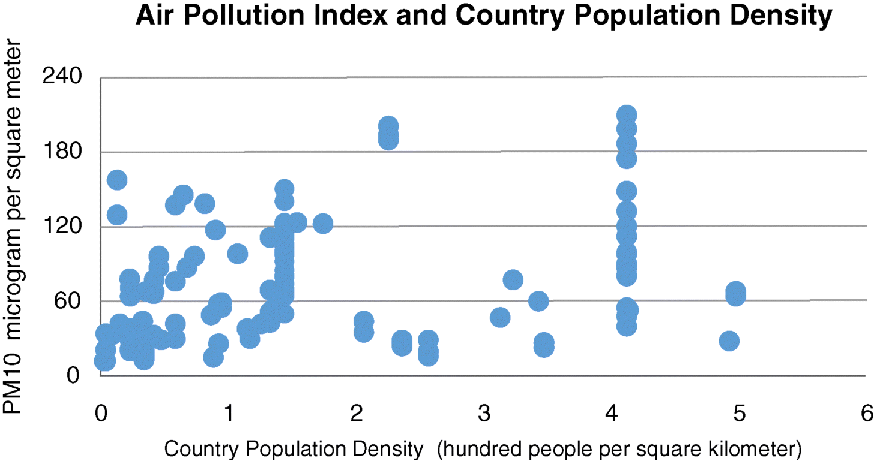
Figure 4.8(a) Relationship between air pollution index and country population density
Data Source: WHO, 2011 and World Bank, 2011.
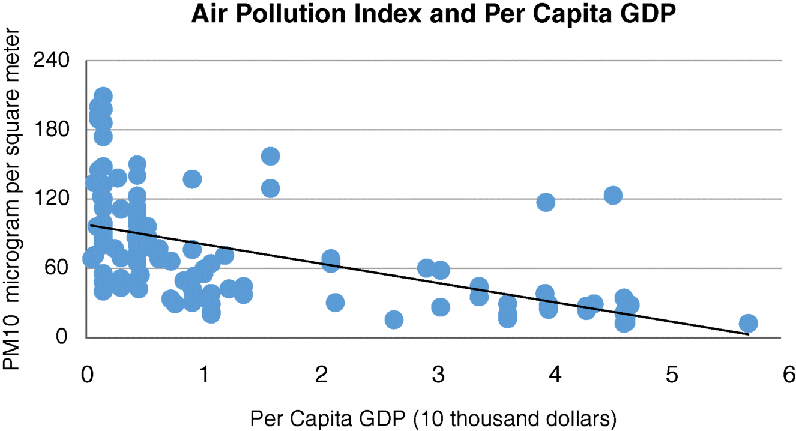
Figure 4.8(b) Relationship between air pollution index and per capita income
Data Source: WHO, 2011 and World Bank, 2011.
For example, Japan and Korea have a much higher population density than China; however, Tokyo and Seoul have much better air quality than Beijing. Mongolia is one of the most sparsely populated countries in the world, but the air quality in its capital, Ulaanbaatar, is among the worst in the world. Densely populated Europe has better air-quality results than sparsely populated Africa. According to a 2013 ranking by the Blacksmith Institute Green Cross, five of the 10 most polluted cities in the world are low-density countries such as Russia, Ukraine, Argentina, and Zambia.
Air quality is just one of the measures of environmental protection. Grossman and Krueger (1995) analyzed the relationship between economic development and various kinds of pollution. They found a common pattern. During the early stages of industrialization, all pollution indexes deteriorate rapidly; however, most of the measures hit a turning point when a country's per capita GDP level reaches US$8,000 to US$10,000. The reason is that when a country becomes wealthier, it will have access to (and be able to afford) better technologies, and will also be able to invest more in environmental protection.
In 2016, China's per capita GDP stood at US$7,500, and it was one of the most polluted countries in the world. But over the next decade, as the per capita GDP exceeds US$10,000, China's environmental conditions will start to improve. A few rich cities located along the coastal regions have already adopted very high environmental standards, and have seen environmental improvement in recent years.
Urban Congestion
In Chapter 3 I discussed the agglomeration effect of the urban population. Not only do large cities have more job opportunities, they also have better health and education facilities. Moreover, innovation occurs disproportionately in large cities. As a result, metropolitan areas of the world keep attracting new residents, and those that are most successful have grown into mega cities with over 10 million in population.
As they have grown, the major cities in populous countries such as India and China have become very congested. People mistakenly believe that city density is related to country density. Does country population density relate to city density? Our analysis of city density uses data from Demographia (2011), which collects information from the major metropolitan areas of the world to calculate the city density of each metropolitan area. Figure 4.9(A) shows the relationship between city density and country population density. In the figure, the vertical axis is the city density and the horizontal axis is the country population density.
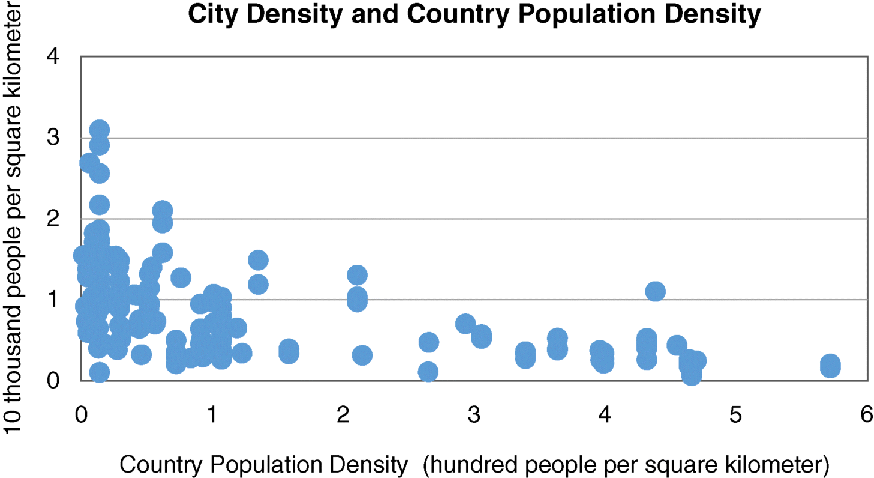
Figure 4.9(a) Relationship between city density and country population density
Data Source: WHO, 2011 and World Bank, 2011.
It is evident from Figure 4.9(A) that city density has no clear relationship with country density. In Argentina, a very low-density country, one-third of its 40 million residents live in Buenos Aires, which has a density higher than that of Beijing. The largest city in Brazil also has a higher population density than Shanghai and Beijing.
Figure 4.9(B) shows the relationship between city density and per capita GDP. The vertical axis is the city density, and the horizontal axis is the per capita GDP income of the country.
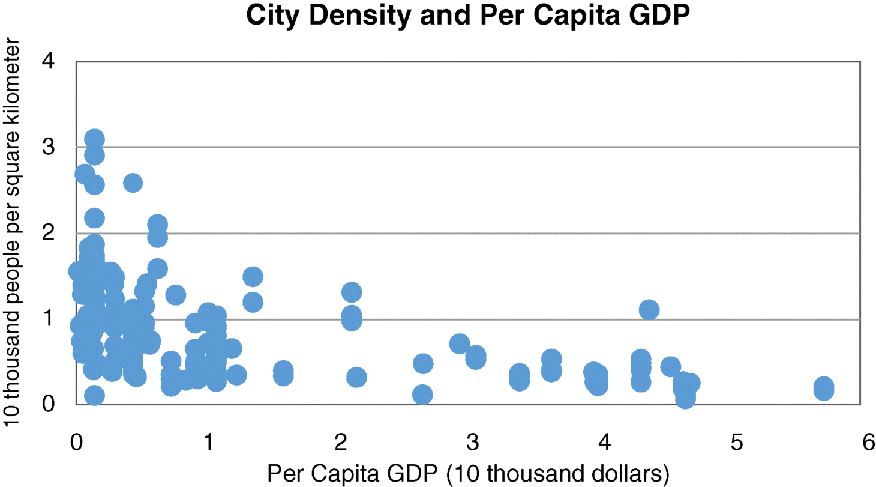
Figure 4.9(b) Relationship between city density and per capita GDP
Data Source: WHO, 2011 and World Bank, 2011.
It is evident from Figure 4.9(B) that city density is negatively correlated with per capita income. As a country becomes wealthier, its cities will cover a larger surface area and have a lower density. This is because, with increased wealth, the cities are able to invest in better roads and public transportation, enabling people to comfortably commute longer distances to work. Los Angeles has a very low population density, because it has a very extensive system of satellite towns and suburbs, all connected with an extensive highway system. Tokyo has 37 million residents, but it has the largest public transportation system in the world, with over 3,000 km of subways and train lines. Poor cities do not have adequate highways or public transportation systems, so residents have to live close to city centers, which become very densely populated and overcrowded as a result.
Let's look at the top 10 most congested cities in the world.
As we can see in Figure 4.10, many congested cities are in Russia and Brazil, which are low-density countries. On the other hand, mega cities such as Tokyo or Seoul are not on the list. So, it is clear that the largest cities are prone to congestion only when countries are relatively poor, regardless of the population density of the country.
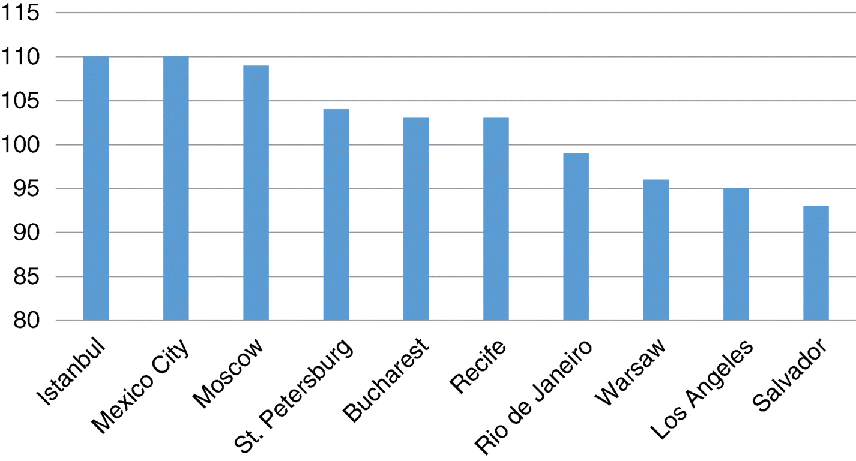
Figure 4.10 The world's worst cities for gridlock
Data Source: Niall McCarthy and Statista, These Are the World's Worst Cities for Gridlock, 2015 (available online at www.forbes.com).
Country Population and City Population
As discussed in Chapter 2, in the recent past, large cities across the world are growing disproportionately larger due to the agglomeration effect (Lu, 2016). In Japan, low fertility has caused a decline in the overall population; nevertheless, the population of Tokyo, its largest city, is still growing. In fact, it is the only place where the population is growing in Japan. In Russia, a low fertility rate has caused many small cities to decline in population; however, the population of Moscow has grown significantly in recent years. Even though the overall population is nearly stable in China, the population of Beijing and Shanghai has grown to over 23 million and counting. How large can these cities grow? Are Chinese mega cities too big?
There are two basic competing forces that determine how large a city can become. On the one hand, people are attracted to large cities, which have more jobs and better public services; on the other hand, they are deterred by high housing prices and a potentially long commute. The balance of these two forces will determine the size of a city. Because major cities attract people from rural areas and other small cities in the same country, the population in the largest city is positively related to the country's population size.
By this logic, Shanghai and Beijing should be the most populous cities in the world. However, their populations hover around just 23 million, which is much smaller than the populations of other mega cities in Asia. This is primarily due to the Chinese government's restriction on internal migration. Japan, with only one-tenth of the population of China, is home to the largest city in the world (Tokyo), with 37 million residents. Korea's largest city, Seoul, is also larger, with a population of 26 million. Optimally, therefore, Shanghai and Beijing should both be metropolises of around 40–50 million people.
Too Many People in Beijing?
This may come as a surprise to many people who have lived in or visited Beijing. Beijing is notoriously polluted and congested, but it is also too small in terms of population size in relation to the size of the country. Poor urban planning rather than population size is the main culprit for its pollution and congestion problems.
The density of Beijing is similar to that of other large cities in the world. Table 4.1 compares the number of cars, city population, and area of the major cities of the world. Beijing has fewer vehicles than New York and Los Angeles, and a lower population density than Tokyo.
Table 4.1 Car ownership in selected major cities of the world
Data Source: Related government websites and media sources.
| Car ownership statistics | Demographia agglomeration | |||||
| Scope | Carownership | Landmass | Population | Landmass | Population | |
| Beijing | Subdistrict | 502 | 16,808 | 2,019 | 3,479 | 1,731 |
| New York | New York's 5th district | 196 | 850 | 780 | 11,642 | 2,046 |
| New York and suburban areas | 1,037 | 30,670 | 2,209 | |||
| Tokyo | Tokyo City | 385 | 2,188 | 1,319 | 8,547 | 3,713 |
| Tokyo City and 3 other suburban areas | 1,379 | 13,556 | 3,562 | |||
| LA | Los Angeles district | 580 | 10,518 | 989 | 6,299 | 1,490 |
| 2nd district | 832 | 12,520 | 1,283 | |||
| 5th district | 1,052 | 87,490 | 1,808 | |||
| London | Greater London | 269 | 1,572 | 817 | 1,623 | 859 |
| Paris | Greater Paris | 489 | 12,012 | 1,179 | 2,844 | 1,076 |
| San Paulo | San Paulo city district | 697 | 7,944 | 1,989 | 3,173 | 2,019 |
| Note: Landmass, population, and car ownership units of quantity, respectively, are the square kilometer, 10,000 people, and 10,000 vehicles. Greater London and Paris car ownership shown only accounts for private and light vehicles. | ||||||
So, why is Beijing so congested? The two photos in Figure 4.11 reveal the reasons. Comparing the two satellite photos, we can see that the road density in New York is much higher than that in Beijing. In New York, 25% of the total landmass is covered with roads (New York City Bureau of Transportation), whereas in Beijing, only 7% of the total landmass is covered with roads (Beijing Statistical Year Book, 2012).
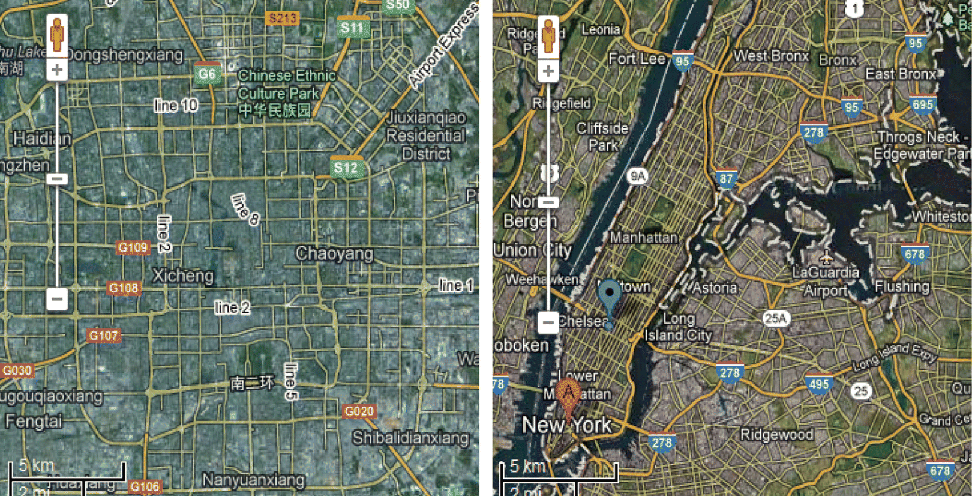
Figure 4.11 Comparison of city road density between Beijing and New York
Source: Google Maps, 2016.
Moreover, the subway/railway density in Beijing is not very high compared with other cities around the world. In 2015, the total subway length was 600 km; only 30 km per million residents. However, in Tokyo and London, the length of subway/railway per million residents in 2015 was 69 km and 192 km, respectively. Consequently, Tokyo is much less congested, even though it has over 37 million residents, a population that is 90% larger than that of Beijing.
Obviously, Beijing's congestion is caused by underinvestment and poor planning of roads and public transportation. As a wealthy city, Beijing has the resources to invest heavily in infrastructure. And, of course, as India grows wealthier, the same pattern will need to be repeated in its large cities.
Planning for a Mega City Comprised of 30 Million People
I have argued that large cities are good for innovation, and cities such as Shanghai and New York should be larger. But both Shanghai and New York already have over 15 million people; does this mean there is no more room for growth? Population growth in a city is not limited by space but by commute time, which could become intolerable for residents.
Mega cities like Shanghai and New York can learn from Tokyo, which uses high-speed railway to connect satellite cities. Yokohoma is a satellite city 28 km away from Tokyo's city center, and a non-stop high-speed railway connects Yokohoma to the city center in less than 20 minutes. High-speed train technology in Japan has been around for almost 40 years. China's high-speed railway is even faster, with a speed of 350 km/h. The Chinese high-speed railway can connect a satellite city center 40 km away to the metropolitan city center in less than 10 minutes non-stop, and in less than 20 minutes with three to four stops. If fast metro lines were to be built on top of existing metro lines, the commute time could be reduced significantly.
For mass transit systems to work efficiently, the population density of a city needs to be high. The population densities of most cities in the United States are too low. Singapore has a density of 10,000 people per square kilometer, while Tokyo has a density of 5,000 people per square kilometer. New York and Los Angeles have a population density of only about 2,000 people per square kilometer (although the population density in Manhattan is much higher). If high-speed railways can connect satellite cities 40 km away to city centers in less than 20 minutes, the city can be enlarged to have a diameter of 80 km, which will be roughly 5,000 km2 in landmass. With a density of 10,000 people per square kilometer, a city can have over 50 million people, and residents can still travel from any location to the city center in under 40 minutes.
To further reduce commute times, current zoning laws need to be revised. It is clearly necessary to separate industrial areas and residential areas, but the separation of commercial and residential areas is unnecessary and contributes to longer commute times. Today, even the concentration of banks and financial firms in central business districts is unnecessary, because (unlike in the past) financial transactions no longer require face-to-face meetings. Still, creative workers need face-to-face interaction with other team members; however, the typical team size is just a few dozen to a few hundred. Moreover, high-tech firms do not create nearly as much traffic in the neighborhood as other businesses such as banks, and do not need to be located close to other businesses or in a central business district. Therefore, most high-tech firms can be located near residential areas, thus reducing commute time. Of course, some employees still may not be able to move to a residential area close to the office for a variety of reasons, for example their spouse may need to work for a far-away firm. But for many people, and overall by mixing commercial and residential areas, commute times can be reduced.
Lastly, with the emergence of Uber-like bike rental services, the last-mile connection to the metro railway is made easier. In China, a new startup is providing on-demand bike rental services by which anybody can locate a nearby bike using a smartphone. People are using bicycles to ride to and from subways to reduce their commute time. Further down the line, as automated driving technology becomes legal and commercially available, driving will be less tiring and parking will be easier as well. In sum, the combination of high-speed rail, Uber-like services, and automatic driving technologies will likely solve the commuting problems of the mega cities of the future.
I would like to conclude this chapter by discussing the view of the prominent American economist, Nobel Laureate, Gary Becker. I was fortunate to have the opportunity to carry out postdoctoral research under his guidance from 2011 to 2012 at the University of Chicago (Figure 4.12). He was a pioneer in the field of human capital and labor economics, and wrote extensively on public policy in many areas, including environment and population. In commenting on the 2011 United Nations' forecast of 10 billion people by the end of the century, he wrote a blog entitled “Yes, the world will have ample resources for 10 billion people.” First, he thinks that the UN forecast of 10 billion people by the end of the century may be an overestimate—if the GDP per capita in many developing countries continues to rise, their fertility rates will drop and it is likely that the peak world population will be significantly smaller than 10 billion. Then he explains why the growing demand for food, water, and other resources can be met by adopting improved technology and innovations. At the end of the article, he concludes:
If world population grew to 10 billion by the end of the century—an unlikely outcome—that would present considerable challenges. However, greater population would add real benefits as well, and I am inclined toward the view that the benefits will exceed the harm.

Figure 4.12 Author's photo with Gary Becker in 2011
Photo Credit: James Liang.