
2
Maturity
2.1. Context
Any product goes through a number of industrial phases throughout its lifetime; this is known as the product lifecycle. Chronologically, these phases can be listed as follows:
- – product specification, conducted by the system manufacturer or the end user;
- – product design, conducted by the equipment manufacturer;
- – product manufacturing, conducted by the equipment manufacturer;
- – product integration, conducted by the system manufacturer;
- – product operation, conducted by the end user.
These various stages are illustrated in Figure 2.1 below.
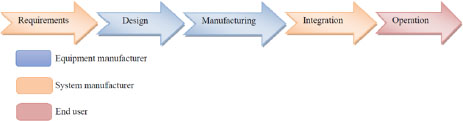
Figure 2.1. Phases of the product lifecycle. For a color version of this figure, see www.iste.co.uk/bayle/maturity1.zip
All of these stages have the potential to produce defects that are often specific to each of them. These defects will potentially generate failures during the operational life of the product with the end user.
The specification stage runs the risk of generating:
- – youth failures, as a result of failures that occur early on in the product lifecycle because a specification has been poorly met, understood or interpreted;
- – premature aging failures, for example, as a result of a performance specification that is much lower than necessary for the product;
- – catastrophic failures due to the lack of specifications on the operational constraints that the product will be subjected to.
The design stage runs the risk of generating:
- – youth failures due to poor design of a given product function;
- – premature aging failures because, for example, a component is under too high “stress” with respect to the performances guaranteed by the manufacturer;
- – catastrophic failures due to the lack of margins on certain operational constraints.
The manufacturing stage runs the risk of generating:
- – youth failures due to poor manufacturing of the product (poor welding, component errors, etc.);
- – premature aging failures due to a component undergoing too much “stress” during product manufacturing or testing.
Finally, the integration stage runs the risk of generating catastrophic failures due to product handling errors when undergoing stress (ESD, for example), etc. All of these potential defects will affect the operational reliability of the product, having a direct impact on its maturity. But they also impact the brand image of the equipment manufacturer as perceived by the system manufacturer or the end user. They can also generate significant costs for the equipment manufacturer.
Therefore, in order to counteract these harmful effects on maturity, a certain number of analyses and tests can be implemented in order to minimize their number and therefore their impact (unfortunately, zero defect does not exist). This book relates exclusively to the level of the equipment manufacturer. Maturity can then be broken down into two large activities as depicted in Figure 2.2.
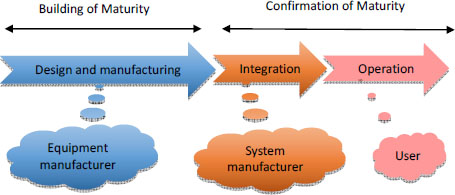
Figure 2.2. Stages of maturity. For a color version of this figure, see www.iste.co.uk/bayle/maturity1.zip
2.2. Normative context and its implications
2.2.1. Quality standards
Standards reflect the willingness of nations and individuals to exchange products or services. This trade has always required the parties’ mutual trust. The legal system containing the hierarchy of standards and the quality bearing the documentary pyramid contributed to consolidating this trust over time.
This led to the creation of the world’s largest standardization system in 1947, known as the International Organization for Standardization (ISO). Nowadays, to ensure their continued existence, organizations must have a certified quality management system.
ISO 9001 (ISO 2015), an international standard with worldwide coverage for several decades, sets out the criteria related to the processes that are part of the quality management systems. Having products or services offering, since the very start of operation, the ability expected by the clients is part of the objectives set through the project management process. Making sure that the project management process reaches its objectives throughout the lifecycle of the products or service is at the core of quality assurance management.
2.2.2. Quality management system and product quality
The introduction of a risk-based approach in ISO 9001:2015 [2] changed the way in which quality and quality assurance are managed within projects. The organizations must better understand their context and base their planning on risk determination, which requires a performance orientation of the criteria of this new version.
ISO 31000 (ISO 2018) defines the guidelines of risk management and states that it improves performance in reaching objectives. The PR-NF-EN 31010 (ISO 2018) standard supports this standard by providing recommendations concerning risk management and various techniques for taking uncertainty into account. Moreover, the ISO 9000 (ISO 2015) standard related to quality management systems, essential principles and terminology, defines the concepts used.
It provides clear definitions of objective, project, result, resource, risk, performance, efficiency, effectiveness and indicator. Consequently, the themes involved in project-based product quality management can be schematically represented by the Gilbert model.
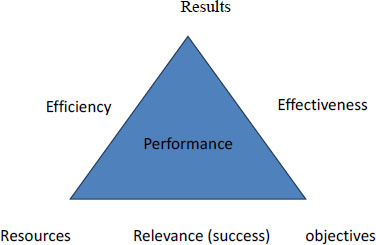
The project objective concerns the expected product quality and meeting the cost and deadlines.
The project result concerns product quality performance, costs and deadlines.
Performance corresponds to the measurable result. Effectiveness is defined as achieving the planned activities and obtaining the planned results. Efficiency is the ratio between the achieved result and the resources used.
Success relates to a balance between economic or financial interests (resources) and the needs of the stakeholders. Risks are the effects of uncertainties. Here, the uncertainties are the causes that are susceptible to gaps with respect to the expected results.
Risk management therefore involves avoiding:
- – gaps between objectives and results, affecting the project effectiveness;
- – exceeding resources, affecting project efficiency.
The Ishikawa method with the “5 whys” technique is used to identify causes based on the adverse effects of a risk. The FMECA method (failure modes, effects and criticality analysis) can be used to deduce, based on the identification of risk causes, the consequences for the products in order to achieve the required improvement.
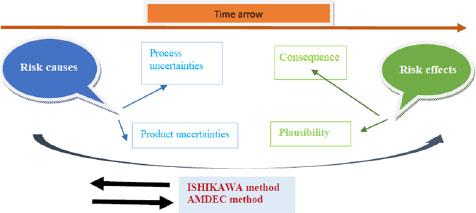
Figure 2.4. Ishikawa method. For a color version of this figure, see www.iste.co.uk/bayle/maturity1.zip
Successful risk management involves reaching the objectives within the allocated resources upon project completion. In this case, project performance is successful in terms of effectiveness and efficiency. It contributes to innovation by creating and preserving value. Project progress is evaluated by taking into account the identified risk factors.
The main quality objective assigned to projects is the supply of compliant products. Compliance addresses the concept of effectiveness: the product (result) must meet the client requirements (objective). Therefore, the product quality risk is essentially related to effectiveness. Indicators are used to determine, measure and control project performances. This explains the importance of their choice for product quality management.
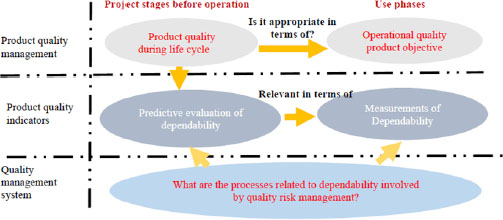
Figure 2.5. Dependability in quality risk managment. For a color version of this figure, see www.iste.co.uk/bayle/maturity1.zip
2.2.3. Product quality and dependability
According to the ISO 9000 [1] standard, the relationship between the concepts of product quality and dependability is defined as follows:
- – quality designates “the ability of a set of inherent characteristics of an object to fulfill requirements”;
- – dependability is “the ability to perform as and when required”;
- – the object is “anything perceivable or conceivable”, which is the product here.
ISO 9000 (ISO 2015) represents the associative relationships between quality, object and dependability as depicted in Figure 2.6.
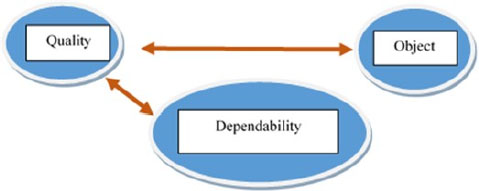
Figure 2.6. The relationship between product quality and dependability
Aiming to provide products that will operate perfectly throughout their operational time is completely unrealistic. The possibility that anomalies, breakdowns or failures may occur must be accepted. However, such occurrences must be limited and managed.
Managing the “operational” and “non-operational” amounts is a further way to define dependability.
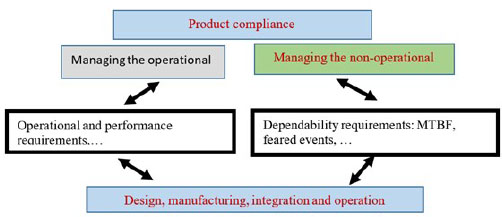
Figure 2.7. Managing the operational and non-operational. For a color version of this figure, see www.iste.co.uk/bayle/maturity1.zip
Dependability activities comprise two stages:
- – during the operational stage, the measurement of dependability performances;
- – before the operational stage, the predictive evaluation of dependability performances, which takes into account:
- - the modeling of failure mechanisms,
- - the existing environmental and use conditions,
- - the quality of processes and activities applied throughout the lifecycle of the products,
- - the inherent quality of the elementary components of the products.
The first component involves the quality control of products during their operational stage. This control is conducted by means of dependability indicators, such as the removal rate and MTBF. The second component involves a prediction of the product dependability performances that will be measured later, during the operational stage.
Before the operational stage, product compliance with the dependability requirements should be managed as a risk for the following reasons:
- – there is an uncertainty related to the fact that products will comply during operation;
- – this uncertainty may lead to not fulfilling the objectives related to the dependability performances.
Dependability deals with the main product quality risk, hence the interest to use it as a product quality indicator.
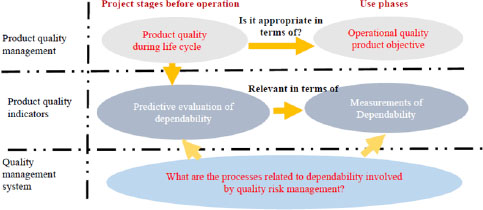
Figure 2.8. Dependability in quality risk management. For a color version of this figure, see www.iste.co.uk/bayle/maturity1.zip
2.2.4. Product dependability and maturity
2.2.4.1. Components and indicators
There are various preexisting standards dedicated to dependability. The European standard EN 60300-1 (IEC 2014) reproduces IEC 60300-1, referred to as ISO 9001 (ISO 2015). It states that “dependability creates trust and affects the ability of an organization to meet its objectives”.
The above definition is very close to that of ISO 9000 (ISO 2015): “Dependability is the ability of an item to perform as and when required”. The term “item” corresponds here to “product”.
Furthermore: “Dependability includes availability, reliability, testability, maintainability and the performances of maintenance logistics and, in certain cases, other characteristics such as durability, security and safety”.
Dependability commonly has four components: reliability, availability, maintainability and safety (harmlessness). A complementary component is often added, namely testability.
Reliability is the ability of an item to perform as required, without failure, for a given time interval, under given conditions. Reliability also designates the value of reliability, in which case it is the probability of a given item to fulfill a required function, under given conditions, during a given time interval.
Maintainability is the ability of an item to be retained in or restored to a state to perform as required, under given conditions of use and maintenance. When maintenance is performed under given conditions and with specified processes and means, it is part of logistical support. Maintainability is characterized by the probability of successfully achieving maintenance or by the duration and cost required to achieve maintenance.
Availability is the ability of an item to be in a state to perform as required. Availability also designates the value of availability. The availability of a product depends on its reliability and maintainability. Indeed, a product is able to perform at a given instant provided that it has either not stopped performing (reliability) or could be restored to a state to perform in case of failure (maintainability).
Safety (harmlessness) is the ability of a product to meet, throughout its life stages, an acceptable level of risk of accidents susceptible to harm personnel or seriously damage the product or its environment. Safety is characterized by the probability of an unacceptable accident to occur within a given time interval.
Testability is the ability of a system to be declared defective within specified time limits, according to specified processes and under given conditions. The testability of a component contributes to the maintainability of the equipment it contains. It is characterized by the coverage rate that is defined by the number of testable breakdowns to the total potential number of breakdowns.
Dependability performances depend on the quality of processes and activities applied during the lifecycle of products. They are defined according to the indicators in Figure 2.8. Note, for example, the proper functioning rate concerning availability, the rate of occurrence of dreaded events related to safety, the mean time between failures (MTBF) and the removal rate for reliability.
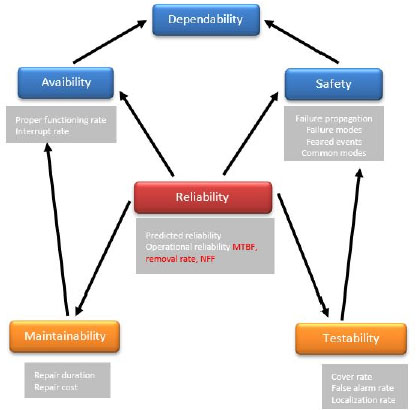
Figure 2.9. Dependability. For a color version of this figure, see www.iste.co.uk/bayle/maturity1.zip
2.2.4.2. Product maturity
The notion of product maturity is not defined by ISO 9000. Nevertheless, a measurement system is employed for the evaluation of the maturity level of a technology within the innovation framework covered by the NF ISO 16290 standard.
It was first developed and used by NASA, but its application has been extended to all domains. The scale has nine levels of maturity relying on qualification criteria. Several standards refer to the maturity of organizations and processes. NF EN ISO 9004 (ISO 2018) gives guidelines for organizations to achieve sustained success. It states: “an organization is considered mature if it performs in an effective, efficient and sustainable manner”. The maturity of the organization is established by qualitative evaluation of the maturity of each of the individual processes following five levels”.
The ISO/IEC 33001 standard provides complementary elements concerning software, systems and services. The internationally known Capability Maturity Model Integration CMMi (Capability Maturity Model Integration (CMMI) 2018) also involves five levels for the evaluation of the maturity of processes and organizations.
Nowadays, product maturity is a notion used by various organizations. It is sometimes defined according to the reliability component:
State of a product that meets the expected reliability level as soon as it becomes operational.
Sometimes it is defined according to the availability component:
State of a product that meets the availability requirement as soon as it becomes operational.
The definitions are very similar and they relate to dependability. In recent decades, manufacturers were interested in accelerated tests, at the core of the building and confirmation of product maturity, and CNES RNC-CNES-Q-20-523 can be quoted:
Reliability clauses followed the evolutions of an industrial context in which specialization became a generalized trend: certain companies specialized in design or manufacturing, or in product assembly for a contract giver. At present, these clauses do not uniquely relate to objectives in terms of MTBF, but rather to the probabilities of failure upon the first energizing, or to the number of defects tolerable throughout the youth period, or still to the durability criteria. Moreover, these objectives must be met from the very beginning of the commercial life of the product. To meet these objectives, the manufacturers are increasingly required to respond in terms of robustness, maturity of products and their manufacturing processes (RNC 2006).
Therefore the product maturity strategy refers to all of the activities contributing to meeting the dependability objectives. Moreover, its objective is to make sure that product reliability is under control as soon as it becomes operational. The state of maturity of products therefore depends on youth and end of life according to the bathtub curve used in reliability.
The product maturity strategy is defined according to a process that is referred to here as “building and confirmation of maturity”.
The period referred to as “maturity” corresponds to the area where product reliability and therefore quality are controlled under operation. It corresponds to the period when failure intensity is constant in time, modeled by an exponential law where λ is the failure rate. When certain elements are subjected to aging and preventive maintenance, reliability is controlled by failure intensity.
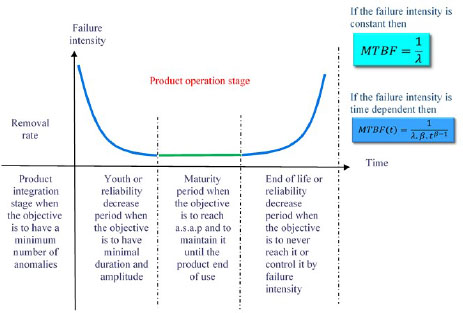
Figure 2.10. Product operation stage. For a color version of this figure, see www.iste.co.uk/bayle/maturity1.zip
This leads to the following representation of the relationship between product quality and product maturity.
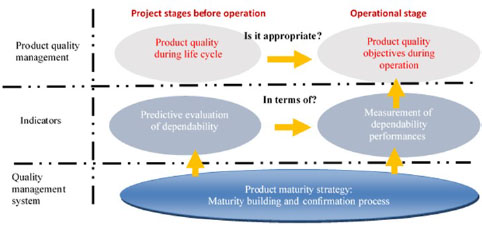
Figure 2.11. Maturity building and confirmation process. For a color version of this figure, see www.iste.co.uk/bayle/maturity1.zip
2.2.4.3. PDCA and product maturity
The processes belonging to a quality management system follow the PDCA cycle according to ISO 9001 (ISO 2015).
[P]: Plan. [D]: Do. [C]: Check. [A]: Act
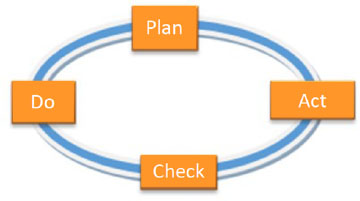
Figure 2.12. PDCA. For a color version of this figure, see www.iste.co.uk/bayle/maturity1.zip
The maturity building and confirmation process involves the following stages:
- – planning (P) the product maturity strategy relying on the maturity building and confirmation process;
- – doing (D) activities throughout the lifecycles of the products involved in the plans, without ignoring those concerning the predictive evaluations of dependability;
- – checking (C) dependability performances during integration and operation, without ignoring their comparisons to predictive evaluations;
- – acting for the improvement (A) of maturity building and confirmation processes according to the feedback.
2.2.5. Standards in various domains
The international system ISO applies to all organizations. Various domains such as the medical, railway, nuclear, space, aeronautics, defense and automotive sectors completed the ISO 9001 standard according to their specificities.
Dependability challenges are part of the main criteria involved in the complementary contributions. In the automotive field, there is a methodology dedicated to the risk-based approach to product quality management, APQP-PPAP.
It aims to optimize product quality and the associated costs by anticipating activities depending on the identified risks. In the aeronautics, space and defense fields, this approach was resumed in the form of a standard, namely PR NF EN 9145. Its objective is to provide safe and reliable products as soon as possible.
Nowadays, it can be used by any manufacturer with the suitable adjustments for best taking into account risk management.
2.2.6. Perspectives
2.2.6.1. Opportunity
Reliability is the dependability component that is connected with all of the others; see Figure 2.7. Therefore, the predictive evaluations of dependability mainly rely on reliability and failure rate control. In recent decades, the quality and reliability fields became highly specialized. Nowadays, quality engineers do not always consider using the dependability evaluations and measurements as a tool for product quality management.
Reliability engineers do not consider cooperating with quality engineers for the validation of process quality hypotheses formulated in the dependability evaluations. However, during the same period, new methods for predictive evaluations of reliability were developed, such as FIDES by the Risk Management Institute and 217Plus by RIAC (2015).
They use process quality factors, referred to as pi-process, evaluated through audit, as recommended by the FIDES guide. These factors aim to evaluate the quality level of the activities performed throughout the product lifecycle, and to quantify the impact on the values of failure rates and MTBF.
The calculation of failure rates, also referred to as risk rates, takes into account all of the activities of maturity building and confirmation associated with the set of dependability indicators.
On this subject, the FIDES guide notes that the audit is a tool for risk management concerning particularly:
- – the robustness of product definition;
- – the environment of operational products;
- – the effective consideration of reliability throughout the lifecycle.
The FIDES audit can be used in addition to the ISO 9001 V2000 audit, which is more specific and dependability oriented. The specific objectives of conducting a FIDES audit are:
- – evaluation of a quantified quality indicator that is representative of the capacity of the company to manage the reliability of its products (pi-process);
- – evaluation of a reliability sizing factor: pi-process calculation;
- – identification of the company strengths and weaknesses and formulation of targeted recommendations for the improvement of the internal process.
To the extent that product quality management, predictive evaluation and measurement of dependability performances are jointly conducted, it is possible to build quantified indicators related to product quality risks.
2.2.6.2. Building a quantified product maturity indicator
Projects must have relevant indicators to manage quality risks. Indicators established according to quantitative criteria are preferable; they are more robust and reliable than the qualitative ones, whose evaluations depend on those conducting them.
Failure rate and MTBF indicators can be used to quantify the quality risks during operation and compare them with requirements, as shown in Figure 2.8. But they are not effective in managing quality risks in the upstream stages, before the delivery of products.
Thanks to the pi-process of the FIDES and 217Plus methods, the evaluation of the quality level of the activities applied throughout the lifecycle of products can be used to quantify the impact on predictive reliability, the image of quality risks perceived by clients during operation stage.
At the start of the project, the planning stage [P] defines the activities involved by the maturity building and confirmation process. In the subsequent stages, activities are conducted and evaluated [D]. Pi-process-based evaluations after each activity offer the possibility of real-time updates on the value of predictive MTBF.
During these stages, the risk-based approach involves the adjustment of predictive MTBF so that it is higher than the objective MTBF by means of the choice and/or level of quality of activities. The measurement of operational MTBF can be used to calibrate the predictive reliability model [C] and improve the maturity of the process of maturity building and confirmation [A]. During this operational stage, the risk-based approach involves maintaining the functionality of the products and checking that the operational MTBF is always higher than the objective MTBF.
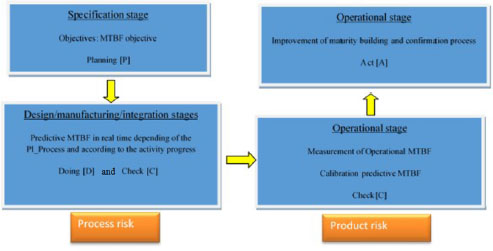
Figure 2.13. Process and product risk. For a color version of this figure, see www.iste.co.uk/bayle/maturity1.zip
As previously noted, process maturity is related to effective and efficient functioning objectives. Product maturity is related to the objective of reaching the reliability level as soon as the product is operational. Quality indicators are essentially related to effectiveness. It is however possible to create product maturity indicators that are also related to efficiency.
As previously explained, the risks to be managed before and after the operational stage are not the same. The operational MTBF considered here is the one measured when the product becomes operational. This is how the youth period of the bathtub curve is taken into account.
2.2.6.2.1. Process risk quantified indicator
Before the operational stage, the value of operational MTBF cannot be measured. Quality risk concerns the activities of the maturity building and confirmation process. The risk is to apply a maturity building and confirmation process that does not allow the objective MTBF to be reached.
The value of predictive MTBF can be compared to that of the objective MTBF. This amounts to managing process risks using the Rprocess indicator.
Given:
- – If Rprocess > 1, the process is not sufficiently effective, the quality level must be improved or the choice of activities must be reviewed. See Figure 2.1.
- – If Rprocess < 1, the process is sufficiently effective.
- – If Rprocess << 1, the process is effective, but it is all the less efficient as the [R process] gets farther from 1. There is an opportunity for limiting the resources. See Figure 2.1.
2.2.6.2.2. Product maturity quantified indicator
In the operational stage, the value of operational MTBF is measurable. The risks are related to the product. Product risks are managed by the product maturity indicator: M product. The risk is to have failures more frequently than the objective expected by the client.
- – If Mproduct > 1, the product is not sufficiently mature.
- – If Mproduct< 1, the product is sufficiently mature.
- – If Mproduct≪ 1, the product is significantly more mature than required. A value analysis should be conducted.
2.2.6.2.3. Process maturity quantified indicator
The maturity building and confirmation process is effective if the predictive MTBF calculated by taking into account the choice and quality level of the applied activities is higher than the operational MTBF. The maturity building and confirmation process is all the more efficient as the predictive MTBF is closer to operational MTBF. In this case, the deployed resources are up to the objective. The maturity level of the maturity building and confirmation process can be evaluated based on the following indicator:
- – If Mprocess > 1, the process is sufficiently effective.
- – If Mprocess < 1, the process is not sufficiently effective, the choice must be reviewed and/or the quality of the applied activities must be improved. The process is not sufficiently mature.
- – If Mprocess ≫ 1, the process is effective, but all the less efficient as the [M process] gets farther from 1. There is an opportunity for limiting the resources.
- – If Mprocess > 1 but close to 1, the process is effective and efficient, it is mature.
- – If the calibration of predictive reliability models can be used to calibrate the process quality contributor, here referred to as the pi-process, it is possible to transpose these indicators defined according to MTBF values using the pi-process corresponding values.
2.3. Building of maturity
The aim is to implement actions that ensure product maturity before its operation by the end user. Therefore, for the design stage, the following analyses are proposed:
- – derating: this analysis is the subject of Chapter 4;
- – components with limited life duration: this analysis will be the subject of Chapter 5;
- – worst-case analysis: this analysis will be the subject of Chapter 6.
For the manufacturing stage, the following tests are proposed:
- – robustness test or accelerated test: this test will be the subject of Chapter 7;
- – burn-in test: this test will be the subject of Chapter 8;
- – run-in test: this test will be the subject of Chapter 2 of a second volume by the author, Product Maturity 2: Principles and Illustrations, hereinafter referred to as Volume 2;
- – manufacturing sampling: this method will be the subject of Chapter 3 of Volume 2;
- – compliance test: this test will be the subject of Chapter 4 of Volume 2;
- – non-regression test: this test will be the subject of Chapter 5 of Volume 2;
- – reliability proof: this test will be the subject of Chapter 6 of Volume 2;
- – reliability management: this analysis will be the subject of Chapter 7 of Volume 2;
- – confirmation of maturity: this analysis will be the subject of Chapter 8 of Volume 2.
According to Figure 2.8, the stage of maturity building is conducted by the equipment manufacturer, prior to any delivery to the system manufacturer, during the design and manufacturing stages. The aim of this activity is to limit and even eliminate the defects generated during the two stages. A certain number of tests can be conducted for this purpose. For the defects in the manufacturing stage, burn-in tests can be conducted on all of the products before their delivery. This will be the subject of Chapter 8.
For the design stage, besides the qualification tests specified by the system manufacturer, robustness tests can be conducted. This robustness can be assessed by tests referred to as accelerated. Figure 2.14 illustrates the correspondence between various types of tests.
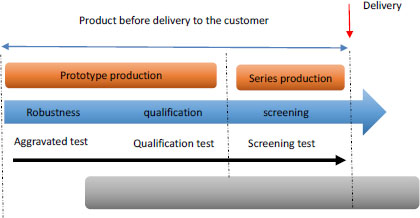
Figure 2.14. Tests during the manufacturing stage. For a color version of this figure, see www.iste.co.uk/bayle/maturity1.zip
NOTE.– The qualification stage is often contractual and relies on a standard. The qualification tests aim to check that the product is able to function within a specified environment before becoming operational. Time is not involved, so they cannot be used to evaluate product reliability.
Product maturity is built based on a certain number of analyses, rules, etc. touching all stages of the lifecycle of the product. Their objective is, among others, to reach the required product reliability and consequently, the various failure categories.
Youth failures, though rare and with no major impact on reliability (MTBF), have a direct impact on the brand image for the end user. The inconvenience resulting from a failure occurring within several days of buying a car, domestic appliance or any other product can easily be understood. The other important point is that youth failures can have financial impacts when they are observed too rapidly. This can take the form of a warranty (automobile, domestic appliance, etc.) or financial penalties based on the removal rate at the equipment manufacturer.
It is a known fact that, according to the second law of thermodynamics, everything degrades over time. Therefore, any component is subject to aging phenomena. These should be taken very seriously, as they concern the entire population of operational products. The aim should therefore be, particularly during the design stage, to avoid the occurrence of this type of failure throughout the operational life of the product. As for the catastrophic failures, they may be so numerous that the required level of reliability cannot be met. Their occurrence frequency can be reduced by obtaining robustness margins, worst-case analyses, etc.
2.4. Confirmation of maturity
Product maturity is obviously measured during the operational stage. This aims to check the product maturity, but most of all if the analyses implemented in the stage of maturity building are effective. For example:
- – the detection of too high composed reliability: this analysis will be the subject of Chapter 7 of Volume 2;
- – the estimation of the operational reliability of the product: this analysis will be the subject of Chapter 8 of Volume 2.
In order to make sure that the product is actually mature (exempt from youth defects and properly designed to avoid rapid wear), it is important to confirm its maturity. Maturity confirmation is conducted in two stages:
- – The first stage is conducted by the system manufacturer by measuring the removal rate, the original fit rate or 0 defects. Quite often, the system manufacturer provides an objective removal rate with pending penalties, if the objective is not met.
- – The second stage, involving the evaluation of the effectiveness of burn-in and accelerated tests, is conducted by the equipment manufacturer based on the operation data provided by the system manufacturer and the end user.
This very important stage of maturity confirmation is illustrated in Figure 2.15.
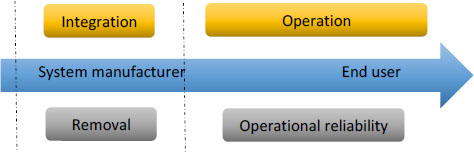
Figure 2.15. Confirmation of maturity. For a color version of this figure, see www.iste.co.uk/bayle/maturity1.zip
Chapter written by Serge ZANINOTTI.