
CHAPTER 9
Goals‐Based Reporting
“I don't understand you, you don't understand me. What else do we have in common?”
—Ashleigh Brilliant
I remember, early in my career, I was excited to show a client what a good job we had done in the recovery post‐2008. Through some effective stock picks, we had generated substantial alpha relative to the market as a whole. During the meeting, I pointed out the alpha figure and, much to my disappointment, my client responded, “What does that mean?” Unfortunately, rather than take the hint, I dove headlong into an explanation, equations and all, of how important alpha was as a risk‐adjusted measure of returns. It did not help. My client did not care about his risk‐adjusted performance relative to a benchmark. My client cared about achieving his goals! Alpha, to him, was a meaningless statistic.
So much of our current client reporting paradigm is consistent with the quip at the top of the chapter. We, as an industry, spend inordinate time and ink presenting metrics and data that we care about, and quite little on what it is the client cares about. Financial plans are a staple, of course, and that is good. But when it comes to monthly or quarterly performance reporting, the financial plan is drawered, and the meaningless metrics come back in force.
I want to explore how we might update our reporting to be consistent with a goals‐based framework, to move away from the myriad meaningless metrics toward the metrics real people actually care about. I do not claim that this is the only way reporting should be done; by contrast, I am a bit of a neophyte when it comes to the challenges of client reporting. Like most practitioners, I rely on my technology services to generate and deliver reports without much second thought. This discussion is my attempt at a second thought on the matter, and it is my sincere hope that this discussion prompts others to add their wisdom and experience to the conversation. Hopefully, then, the industry can coalesce around a new and more meaningful norm for client reporting.
Rather than walk through the deficiencies of existing reports and how we might fix them, let's begin this discussion with a blank slate. Given the goals‐based framework, what information is relevant and meaningful to the investor? As we have discussed, goals‐based investing sits at the intersection of the “big world” and the investor's world. It stands to reason, then, that we need some reporting on both. First and foremost, an investor cares about her world—the world of her dreams, wants, wishes, and needs. Is the portfolio manager helping her achieve those objectives or not? But those objectives can only be achieved with the help from the big world of capital markets because the big world represents the opportunity set from which our investor can draw. If, for instance, the opportunity set only offered below‐average returns, it is important our investor understands that the firm's sub‐par performance relative to her need is not necessarily due to insufficient skill on the part of the portfolio manager, but rather due to a poor opportunity set (and the inverse is also true, so this cuts both ways!). Good goals‐based reporting should strike the right balance between the two (Figure 9.1).
In my mind, proper goals‐based reporting opens with a quick summary of the client's goals, and the client's current financial picture with respect to them, as shown in Table 9.1. Front and center is the only metric that really matters: our client's forecasted probability of goal achievement. I imagine this figure generated from the firm's capital market expectations and the client's goal variables; however, I also recognize that firms could jury‐rig their CMEs to produce figures here that are higher than they really should be. Rather than the objective measure that it should be, this could easily be a subjective measure—but more on that in a second. For now, let's admit the tension inherent in how the figure is generated but remain committed to its presentation. It is the point of all this, after all.
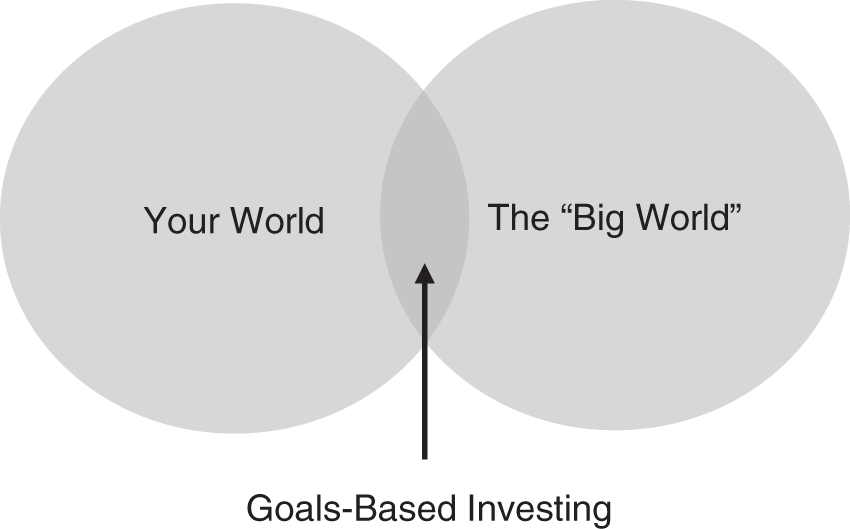
FIGURE 9.1 Goals‐Based Investing
Next, I've laid out the goal variables our client has specified: the required future balance to fund the goal, the time horizon within which the goal must be accomplished, and the current account balance dedicated to the goal. From there it is a simple matter to calculate the required annualized return. I think it important to consistently reflect the client's objectives, as stated by them. It gives both the investor and the advisor a chance to review these figures and have a conversation, restating them if necessary. Furthermore, it contextualizes the figures to follow, namely the portfolio's actual return over the previous period, which is compared to, primarily, the return required by the client's goal, but also the benchmark return (the opportunity set from which the client can draw). By flanking the actual portfolio performance with both what is needed and what was offered, our investor can immediately see both how they are doing and whether that is from good or bad portfolio management.
Example Goals‐Based Reporting Summary
| Progress Toward Your Goals ‐ Summary | ||||
|---|---|---|---|---|
| Retirement | Vacation Home | Philanthropic Endowment | Wealth Building | |
| Expected Probability of Achievement end of last period | 68.5% | 58.4% | 48.4% | N/A |
| Expected Probability of Achievement end most recent period | 68.8% | 62.7% | 45.8% | N/A |
| Current Balance as of 30 Sept 2021 | $3,781,989 | $354,232 | $113,948 | $243,000 |
| Required Balance | $6,000,000 | $550,000 | $1,000,000 | N/A |
| Time Horizon | 12.25 years | 6.75 years | 22.5 years | N/A |
| Required Return most recent period, annualized | 3.84% | 7.62% | 10.38% | N/A |
| Actual Return most recent period, annualized | 7.12% | 8.43% | 4.32% | 6.33% |
| Bechmark Return most recent period, annualized | 5.93% | 9.21% | 3.77% | 6.18% |
In our Vacation Home sample goal, for instance, our client attained a return much better than needed. This gained ground for her in achievement probability, moving from a 58.4% chance last period to a 62.7% chance this period. While this portfolio underperformed its benchmark by 78 basis points, that is less concerning since we simultaneously outperformed the return required by a greater margin, 81 basis points. Of course, consistent and significant underperformance relative to a benchmark might be a signal that a portfolio manager should be replaced, which is why the information needs to be presented, but that should not be the primary focus of reporting, in my view.
Relative performance is also contextualized by the gain/loss in goal achievement probability at the top of the page. By outperforming our required return, our client should see gains in her achievement probability over time. Underperformance does the opposite. Again, rather than a focus on how many basis points of under/overperformance the portfolio realized to a benchmark, presenting portfolio performance along with how many basis points of achievement probability have been gained/lost contextualizes the portfolio manager's work more appropriately. Portfolio losses can also be contextualized more meaningfully with these metrics. Investors do not fear losses in the abstract, they fear not achieving their goals. Investors intuitively understand that portfolio losses mean a lower probability of goal achievement, but without the actual figure they are left guessing (and usually guessing for the worse). By doing that quantitative work and showing investors plainly how much portfolio moves affect their achievement probability, practitioners will likely find the nature of their conversations changing. Long‐dated goals, for example, are considerably less affected by portfolio losses than most investors think. The underperformance of our example philanthropy portfolio did little to move the needle of achievement probability, and that should reassure our investor somewhat.
One important goal metric that is not included in the summary report is the goal's relative value. As I discussed in previous chapters, this is an elusive figure, and I am not sure that presenting it is particularly clarifying for an investor. That is not to say it should not be reviewed—it absolutely should be oft reviewed. Rather, because it does not carry intuitive meaning to our client, it is a metric that only we as practitioners care about in the end, and so I am inclined to exclude it.
That said, we cannot assume that goal values are constant through time. I have an intuition that an individual's value for a goal, relative to the others in the goals‐space, is inversely proportional to how likely it is to be achieved. In other words, as the achievement of a foundational goal becomes more and more likely, I would expect individuals to want to shift resources away from that goal toward other goals with less relative value and less probability of achievement. This is an exogenous factor for the goals‐based model, though we can adjust for it through time by revising the value‐of‐goals metric on an ongoing basis and reoptimizing wealth across the goals‐space. Some research here may be warranted, as, for the time being, this is just an hypothesis.
Graphics can further highlight important goals‐based metrics and help to contextualize not just the current reporting period but also the progress of our investor across the lifetime of our relationship. I do find that the more traditional asset allocation and portfolio growth graphics are useful, but I believe they should be presented on a secondary basis to goals‐based ones. Again, asset allocation is an important variable to communicate, but it is not particularly meaningful to most investors. It should be viewed in the context of goals‐based achievement metrics.
In the next figures, we have three examples of how visuals can augment the central points. Figure 9.2 (Panel a) is how our example retirement goal has progressed over the 3¾ years that our client has been with us. In this plot, we see our client's account value plotted, not against a benchmark (though one could be added), but primarily against the required growth curve that was set when we started. This plot clearly shows that the portfolio has grown more than the goal requires, and certainly helps to conceptualize the recent portfolio loss—we are still well above where we need to be.
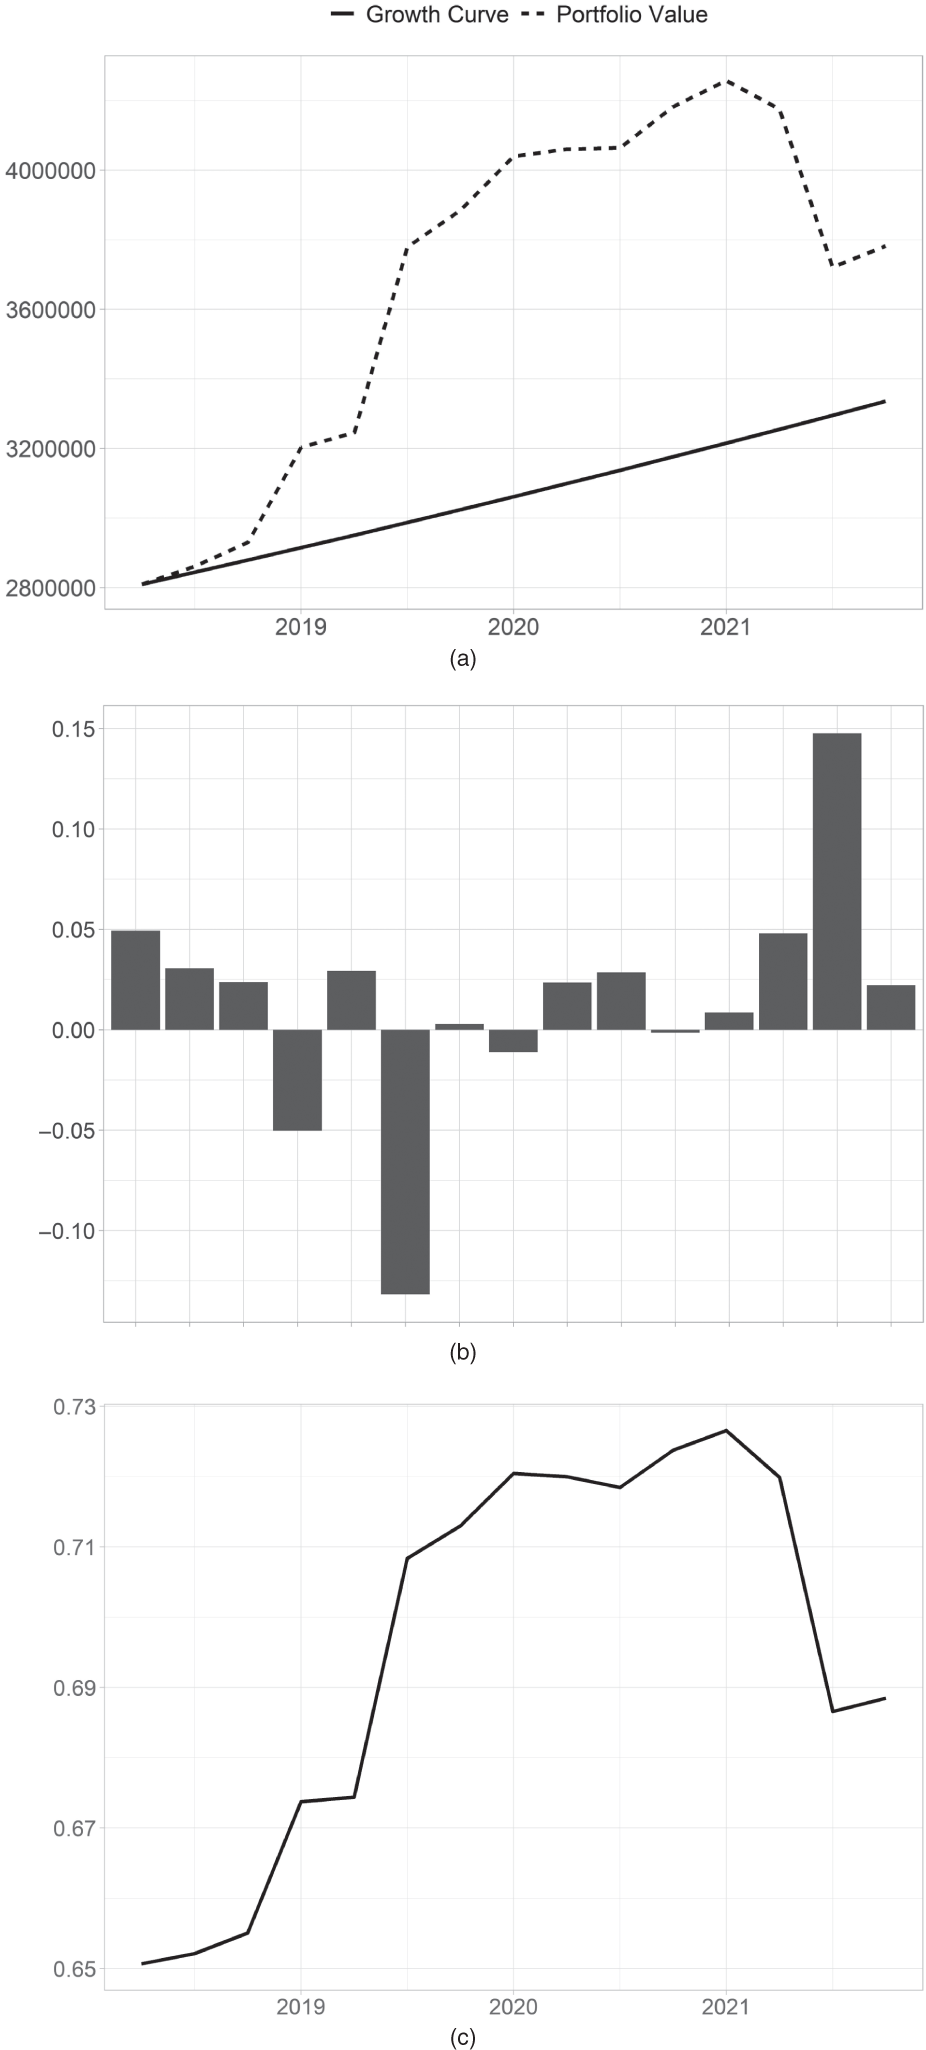
FIGURE 9.2 Sample Retirement Goal, Goals‐Based Graphics: (a) Account Value Relative to the Required Growth Curve; (b) Quarter‐Over‐Quarter Over/Underperformance Relative to Required Return; (c) Probability of Goal Achievement over Time. All values are simulated.
Figure 9.2 (b) presents similar information, but with an adaptation. Instead of the original required line, we update the required return at the end of every quarter. This is to reflect the idea that we are rebalancing and reoptimizing on an ongoing basis, so our required return is always in flux. Is the portfolio manager able to maintain her performance relative to that ongoing shift in requirement, rather than the static one presented in Figure 9.2 (a)? A line delineating the average over time might be appropriate here, as well.
Finally, Figure 9.2 (c) presents the central figure with which clients (and we) are concerned: how our client's probability of goal achievement has evolved over time. Ideally, this figure increases every year until the account has grown enough to fully fund the goal. In a way similar to Figure 9.2 (a), presenting the probability of goal achievement through time also conceptualizes the recent portfolio drawdown. While it has damaged the probability, we are still further along than we were when we started.
Deguest, Martellini, and Milhau1 also suggest including the maximum expected shortfall of a goal. To calculate this figure, we look at the outcomes that fall short of the goal requirement and take their average (this is the conditional shortfall); then we divide by the probability of the shortfall:
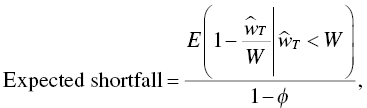
where ![]() is the simulated portfolio value at the end of the goal horizon,
is the simulated portfolio value at the end of the goal horizon, ![]() ,
, ![]() is the wealth required to achieve the goal, and
is the wealth required to achieve the goal, and ![]() is the probability of achieving the goal.
is the probability of achieving the goal. ![]() , then, is the average shortfall of the portfolio for all worlds in which the portfolio fails to achieve the goal. Generating this figure requires simulating possible portfolio paths and so it is subject to errors in model choice and errors in forecasts (or outright hacking). It is also not intuitive. Even so, it can be a useful figure once trained a bit.
, then, is the average shortfall of the portfolio for all worlds in which the portfolio fails to achieve the goal. Generating this figure requires simulating possible portfolio paths and so it is subject to errors in model choice and errors in forecasts (or outright hacking). It is also not intuitive. Even so, it can be a useful figure once trained a bit.
With all of these figures, we are trying to place portfolio movements within the context of a client goal. Over time, Figures 9.2 (a) and (c) will also capture another important result of the goals‐based framework. Recall how the probability mass in a portfolio's distribution of returns is pushed well above the required return. This means that, over time and on average, goals‐based portfolios should outperform their required returns by some significant margin. This is, of course, how our probability increases every year, and how the difference between the portfolio's required return and actual return in the first graph will come to diverge so significantly. This is, in part, the purpose of the middle plot—to show how a portfolio manager is adapting to the very fluid nature of our required return target, to “normalize” the reporting on an ongoing basis.
An investor focus on different metrics will also pace a different focus on portfolio managers. If clients do not judge a firm by risk‐adjusted returns, but rather by how well they help them to achieve goals, then we should reward or punish portfolio managers by different metrics, too. How do we know if a portfolio manager is good at her job if alpha is not our objective? To what should we hold the manager to account if benchmark returns are not our primary concern?
One thing goals‐based practitioners should value quite highly is accuracy of forecasts. Our client's goals depend on being fairly right about markets most of the time. If we are consistently wrong in our capital market expectations, we are not adding value, we are destroying it. Happily, the goals‐based framework gives us a very convenient metric by which to judge the accuracy of forecasts. Despite the apparent complexity of the problem, we make a very simple forecast every single period. We forecast that our client's required return will be hit some specified percentage of the time. We can judge the accuracy of our forecasts, then, using a Brier score. A Brier score is the average of squared deviations of our forecasts from what actually happened, or
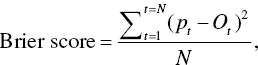
where ![]() is the forecasted probability of achieving the required return in a given period and
is the forecasted probability of achieving the required return in a given period and ![]() if our return was actually attained and
if our return was actually attained and ![]() if our return was not attained,
if our return was not attained, ![]() is the evaluation period (a month, quarter, or year, for example), and
is the evaluation period (a month, quarter, or year, for example), and ![]() is the number of periods over which we are measuring.
is the number of periods over which we are measuring.
A Brier score, then, is much like golf: lower scores are better and higher scores are worse. Random predictions, coupled with random outcomes, will generate a Brier score of 0.33, and this is our threshold. A portfolio manager with a Brier score greater than 0.33 is doing worse than chance. A portfolio manager with a Brier score of less than 0.33 is doing better than chance. One study found that a Brier score was closely related to portfolio outperformance, and a score of less than 0.20 was necessary to consistently produce alpha.2 While alpha is not necessarily relevant to goals‐based investors, the accuracy of our capital market expectations is absolutely critical. Hence, some method for judging this accuracy is needed.
Now, whether this information is displayed on a client report is another question altogether. It is certainly part of how a client should judge a portfolio manager, along with the other metrics with which we are all familiar. A secondary space on the statement could be dedicated to this question: “How good is your portfolio manager?” Although it is unlikely most clients will understand how to read all of those metrics, a Brier score could potentially be included here. For internal use, however, among the firms, this score could be quite valuable as a way to evaluate portfolio managers that is consistent with the goals‐based framework (whereas more traditional metrics may not be).
There are downsides to a Brier score, of course. They can be hacked, and they do not take into account the extremity nor cost of wrongness. For example, suppose the probability of a portfolio going to $0 is 10%. If I were evaluated by a Brier score alone, the optimal strategy is to predict the probability of this event as 0% in every period. Though my Brier score would be quite good, 0.10, my real‐life results would not be. After 10‐ish periods, all of the portfolios I managed would now be worth nothing and our investors would likely be filing lawsuits. It is doubtful that “I had a good Brier score” will suffice as a defense. Obviously, some real‐world wisdom, good faith, and oversight is required to ensure portfolio managers are not gaming their metrics.
Another potential goals‐based portfolio manager evaluation tool, one that could help offset the deficiencies of a Brier score, is a metric that accounts for a goal's value and also the gain/loss in probability of achievement over multiple periods. Keep in mind that this is a first pass, but something like a value‐weighted average of our client's gain/loss in achievement probability. It could look like this
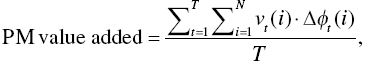
where ![]() is the number of time periods over which we are measuring,
is the number of time periods over which we are measuring, ![]() is the number of goals in our client's goals‐space,
is the number of goals in our client's goals‐space, ![]() , is the value of goal
, is the value of goal ![]() at time
at time ![]() , and
, and ![]() is the change in probability for goal
is the change in probability for goal ![]() in time
in time ![]() . A metric such as this would reward portfolio managers who delivered portfolio results that directly increased investor utility, which is, at the end of the day, how a firm is judged by its clients whether consciously or unconsciously. As well as offsetting some of the Brier score deficiencies, this metric also discriminates between what is more important and what is less important to our client. As we have discussed, aspirational goals have low probabilities of achievement, but since they also carry lower value to the investor, this metric weights progress toward that goal appropriately low. Portfolio managers, then, can be rewarded for delivering value where it is most needed.
. A metric such as this would reward portfolio managers who delivered portfolio results that directly increased investor utility, which is, at the end of the day, how a firm is judged by its clients whether consciously or unconsciously. As well as offsetting some of the Brier score deficiencies, this metric also discriminates between what is more important and what is less important to our client. As we have discussed, aspirational goals have low probabilities of achievement, but since they also carry lower value to the investor, this metric weights progress toward that goal appropriately low. Portfolio managers, then, can be rewarded for delivering value where it is most needed.
There are deficiencies to goals‐based reporting, many of which I am sure will not be clear until they are implemented. Iteration will be key; I do not hold any of these ideas as gospel truth. I can imagine that a reporting rubric with achievement probability as the centerpiece will push investors to focus on this figure, perhaps obsessively. I could see investors unhealthily caught up in the volatility of the achievement probability metric. Were it adopted as industry standard, the industry would, no doubt, find ways to artificially suppress the volatility of this figure so as to ease the minds of their fee‐paying clients. No doubt lower volatility of this figure would be financially rewarded over higher volatility (I even sense a peer‐reviewed paper or two on the subject).
Even so, putting a focus on probability of achievement, and contextualizing portfolio results within that framework at least puts the focus on the right metrics. To the extent that this yields an unhealthy obsession is more a commentary on how metrics drive behavior, whether rightly or wrongly, than whether the metric is measuring something meaningful. Clearly, this is the meaningful metric; all else is secondary. Can it, as a metric, be abused? Of course. But let's not throw out the baby with the bathwater. The metric is valuable, but no metrics should be obsessed over. Just as with all else in life, wisdom and context matter quite a lot.
There are other complications, of course. For example, I am unsure how to account for the human capital problem in these metrics. They are included in the model so the data is there, but should that be included on an official client report? Client reports are (and should continue to be) sacrosanct. Something like the discounted value of all future savings, with its considerable nuance and uncertainty, may not be appropriate to include in so important a document. Excluding it also leaves out critical assumptions that did drive the portfolio allocation decision of the portfolio manager. I admit to being at an impasse. There is a strong argument for and a strong argument against. This tension would extend to any and all of the financial planning assumptions we might tap to produce these metrics (inheritance, projected dates of death, and so on). No doubt regulators will have the final word on questions such as these.
This also brings up reporting on impact and ESG objectives, if there are any. As we have discussed, impact and ESG objectives are very often important and personal goals to investors. It would be appropriate to include the progress toward their achievement. That said, impact reporting is an entire book unto itself, currently with varied opinions and debates of its own. I doubt my ability to properly tackle such a discussion. However, it would be appropriate, on some level, to adopt best practices for such reporting, and include them on a client statement. Especially when returns are being sacrificed for the accomplishment of an impact objective, ignoring it altogether seems inappropriate—even if it is just a line item on a goals‐based statement for the time being.
Lastly, clients often have a pool of wealth with no specific objective. I have labeled this as “Wealth Building” in our sample statement. While I have not enumerated it, I would propose that such a portfolio be reported as we have traditionally reported investments. What's more, I do not want to give the impression that the rest of a performance/activity statement should be thrown away. Quite the contrary! Let's keep what is working and what is familiar. I am proposing firms add goals‐based reporting metrics and bring them to the fore of investor reporting.
I would be surprised by the current lack of goals‐based reporting except for the technology investment that I know it will take. Keeping up with multiple goals for every client in the firm's book is no small task. It is a multiplicative problem: for every 100 clients, each with five goals, the firm must actively track progress on 500 individual objectives. No small feat, to be sure. Most investment managers will find this unruly, so we will have to rely on our technology partners to help us make this possible. The competitive edge for the investment advisor is obvious. For the technology firm that gets this right, the competitive edge is even more apparent, but more on that in a later chapter.
For now, let us conclude with some agreement that goals‐based reporting is an obvious addition to the current reporting structure for individual investors. Firms stand to better communicate their value in a way that clients understand (unlike my failed attempt to sell alpha to one of my early clients). And clients stand to gain the metrics and figures that are most relevant to them, not tangled up in the financialese that “sophisticated” reporting has become.
Notes
- 1 R. Deguest, L. Martellini, and V. Milhau, Goal‐Based Investing: Theory and Practice (World Scientific Publishing, 2021).
- 2 J. A. Cerniglia and P.E. Tetlock, “Accelerating Learning in Active Management: The Alpha‐Brier Process,” The Journal of Portfolio Management 45, no. 5 (2019): 125–135. DOI:
https://doi.org/10.3905/jpm.2019.45.5.125.