
3
Financial Statements
Introduction
One of the most important competencies of an entrepreneur is understanding the financial statements of her own enterprise. Therefore, the discussion in this chapter is intended as an overview of the main relevant issues concerning key financial statements. The objective is to teach the purpose of the different statements, their components, and their significance to entrepreneurs who are not financial managers. This is the final step toward making financial statement analysis, which will be the focus of the next chapter, simple and user-friendly.
Financial statements are important because they provide valuable information that is always used by business managers and investors. However, it is not necessary for the entrepreneur to be able to personally develop financial statements. She can hire someone else to do that job, but it is essential for her to completely comprehend each statement.
Projecting the future is challenging, but it must be done. Debt and equity investors know that financial projections that go out three to five years into the future are at best guesstimates—they have to be, as no one can predict the future (unless, of course, guaranteed future contracts have been signed). Potential investors are looking for projections that are grounded in defensible logic. When asked how financiers know when pro formas are correct, a venture capitalist responded, “We don’t know. In all likelihood, they will be ultimately wrong. In a start-up, it is rare for pro formas to ever match reality. We are looking for logical, defensible reasoning behind the numbers versus B.S.—‘Blue Sky’—projections simply pulled out of the air.”
In this chapter, we will focus on three financial statements: the income statement, the balance sheet, and the statement of cash flows. Each of these statements, in one way or another, describes a company’s financial health. For example, the income statement describes a company’s profitability. It is a measurement of the company’s financial performance over time. Is the company making or losing money? On the other hand, the balance sheet describes the financial condition of a company at a particular time. Does it own more than it owes? Can it remain in business?
The Income Statement
The income statement, also known as the profit and loss (P&L) statement, is a scoreboard for a business and is usually prepared in accordance with generally accepted accounting principles (GAAP). It records the performance of the company over time by stating its financial condition over the course of a period of time, usually a month, quarter, or year. In its simplest terms, it shows the revenues (sales) achieved by a company during that particular period and the expenses (costs) associated with generating these revenues. That is the reason why the income statement, in addition to being known as the P&L statement, is also referred to as the statement of revenues and expenses.
The income statement is divided into two sections: “revenues” are the sales of products or services, and “expenses” are the cost associated with the selling of these products or services. The difference between a company’s total revenues and its total expenses is its net income, which can be positive or negative. When the revenues are greater than the expenses, the company has earned a profit. When the expenses are greater than the revenues, the company has incurred a loss. Thus, Revenues – Expenses = Net Income.
In addition to highlighting a company’s profitability, the income statement is used to calculate a company’s cash flow, which is also known as EBITDA: earnings (net income or profit) before interest expense (the cost of debt), taxes (the payments to the government based on a company’s profit), depreciation (noncash expenditures for the decline in value of tangible assets), and amortization (noncash expenditures for the decline in value of intangible assets such as patents or goodwill). To determine a company’s EBITDA for any period—the cash being generated by the company after paying all the expenses directly related to its operations, and therefore the cash available to pay for nonoperational expenses such as taxes and principal and interest payments on debt—one must utilize the income statement. A sample income statement is provided in Figure 3-1.
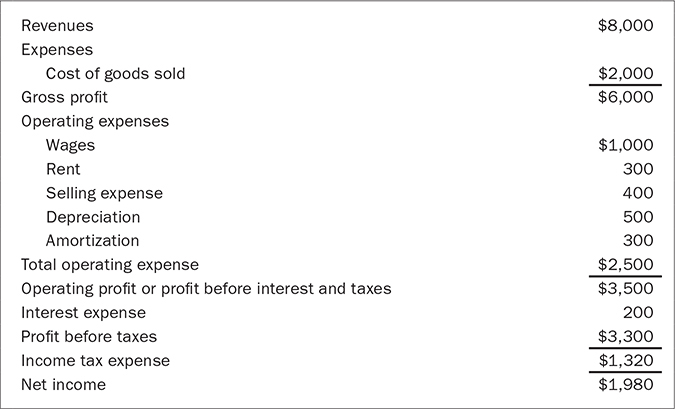
FIGURE 3-1 Bruce Company Income Statement, Year Ended 12/31/2019
Using the information contained in Figure 3-1, we can calculate EBITDA at the end of the year for the Bruce Company, as shown in Figure 3-2. As you can see, we added back “noncash” expenses, or those for which no cash is actually disbursed, such as depreciation and amortization, to determine the company’s true cash position—EBITDA.
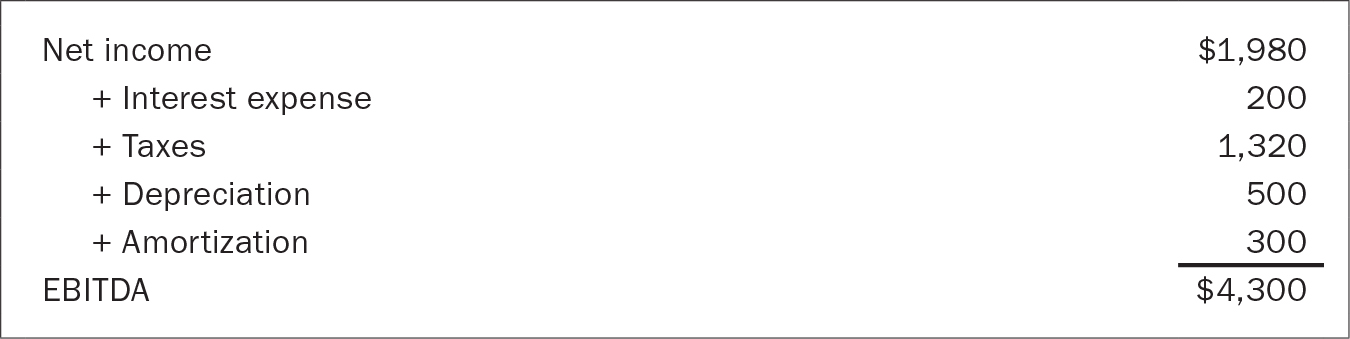
FIGURE 3-2 Sample EBITDA Calculation
Let us define and analyze each revenue and expense item on the typical income statement.
Revenues
• Receipts from the sale of products and services
• Returns on investments, such as interest earned on a company’s marketable securities, including stocks and bonds
• Franchising fees paid by franchisees
• Rental property income
Expenses
• Cost of goods sold
• Operating expenses
• Financing expenses
• Tax expenses
Cost of Goods Sold
The cost of goods sold (known as the COGS) or the cost of services rendered (for a service company without a product) is the cost of the raw materials and direct labor required to produce the product or service that generated the revenue. The COGS does not include any overhead, such as utilities or management costs. The difference between revenues and the COGS is gross profit, also known as gross margin. The proper way to calculate the gross profit is simply to subtract the COGS, as defined earlier, from the revenues produced by the sale of the company’s goods or services. Other income, such as interest earned on investments, should not be included.
The reason for this is that in the world of finance, internal comparisons of a company’s year-to-year performance, and external comparisons of a company’s performance to that of another company or an entire industry, are quite common. These kinds of comparisons are called internal and external benchmarking. Therefore, in order to make “apples-to-apples” comparisons that are not skewed by, for example, Company A’s revenues being stronger than Company B’s because the former is getting higher interest payments on its investments, only the revenues from operations are used. To determine gross profit from total revenues, regardless of the source, would be to ignore the obvious definition of the COGS, which is the cost of only the goods that are sold to generate revenues.
Operating Expenses
Operating expenses, also known as selling, general, and administrative expenses (SG&A), are all of the other tangible and intangible (e.g., depreciation and amortization) expenses required to carry on the day-to-day activities of a company. Included in this category are fixed costs (those costs that do not vary with the volume of business), such as insurance, rent, and management salaries, and variable costs (the costs that vary depending upon the volume produced), such as utilities (e.g., electricity and water) and invoice documents. For example, in the Bruce income statement in Figure 3-1, the rent is $300 per year—an amount that remains the same whether 200 or 2,000 widgets per year were produced.
Another simple way to think about fixed versus variable costs is to determine the expenses that would be affected by, for example, closing the company for a month. The rent would still be due to the landlord, and interest payments on bank loans would still be due to the bank. These are the fixed costs. On the other hand, since the company is closed and is not producing or shipping anything for a month, there would be no need to buy invoice documents, and the utility bills would decrease dramatically, since electricity and water were not being used.
Excluded from this category are interest expenses, which are not operating expenses, but rather financing expenses. Therefore, revenues minus the sum of the COGS and operating expenses equals operating income, or EBIT (earnings before interest and taxes). The operating income is then used to make any interest payments on debt. The balance is called earnings before taxes (EBT), and these funds are then used to pay taxes on the company’s EBT figure.
As stated earlier, “intangible, noncash” expenses—expenses that do not require actual cash disbursements, such as depreciation and amortization—are also included in the operating expenses category. Under GAAP, every company is allowed to “write off” (expense) a portion of its tangible assets each year over the life of the asset. The theory behind this practice is that the value of all assets typically depreciates over time as a result of natural deterioration and regular use. Therefore, the depreciation of an asset is a cost to the company because the value of the asset is declining. As we will see in the discussion of the balance sheet later in this chapter, the depreciated value of the asset is recognized on the balance sheet, and the amount the asset depreciates each year is presented on the income statement.
The amount to be depreciated each year is determined by the accounting method that the company selects to recognize depreciation. The most common methods are straight-line (in which an equal percentage of the asset’s cost minus salvage value is recognized each year for a predetermined number of useful years) and accelerated (double-declining-balance or sum-of-the-years’-digits, which recognize a larger portion of the depreciation in the early years).
The method used to calculate depreciation can have a significant impact on the timing of reported income. Using the straight-line depreciation method rather than one of the two accelerated methods, double-declining-balance or sum-of-the-years’-digits, will result in a higher net income in the early periods and lower net income in the later years of an asset’s estimated useful life. Also, the change in net income from one period to the next is greater under the double-declining-balance method than it is under the sum-of-the-years’-digits method. This makes the former method the most extreme form of depreciation. Finally, the two accelerated methods produce low levels of net income in the early periods that increase rapidly over the asset’s life.1
While depreciation is the expensing of tangible assets, amortization is the expensing of intangible assets. Intangible assets include such items as goodwill (the surplus paid over an asset’s book value), franchise rights, patents, trademarks, exploration rights, copyrights, and noncompete agreements. These items must be amortized, generally in equal annual amounts, over 15 years.
Other Expenses
Expenses that come from debt financing are basically the interest payments made on loans to the business. And finally, tax expenses are the taxes due on the company’s profits. There are also other taxes that a company incurs, including unemployment and real estate taxes, but these fall into the operating expenses (SG&A) category.
If a company has a negative profit before taxes—in other words, a loss, which is called its “burn rate”—then corporate taxes are not due to the government. In fact, not only will taxes not be due, but the company’s losses can also be used to reduce tax obligations on future positive profits. This is called a tax loss carryforward, where a company’s previous losses can be carried forward against future profits. This is exactly how President Trump avoided paying federal income taxes. In 1995, his company had a $916 million loss. As the New York Times reported, “Mr. Trump could have avoided paying more than $50 million a year in taxable income over 18 years.”2
Interestingly, a company with a history of annual losses can be more valuable to a prospective buyer than a company that regularly has a breakeven or profitable financial history. Since tax loss carryforwards are transferable from seller to buyer, they are attractive to a prospective buyer because they are assets for companies that are trying to shield future profits. Popular companies such as Uber, Lyft, and Twitter have never generated profits. When they do, those profits will not be taxed due to their ability to apply tax loss carryforwards.
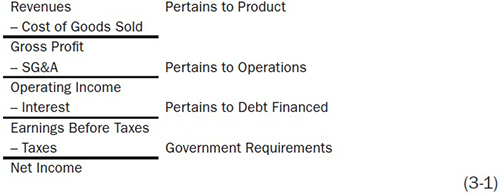
While the simplest way to think about an income statement is Revenue – Expenses = Profit, another way to think about it is as a comprehensive financial overview of the company’s product/service, its operations, the way that it has been financed, and its profitability. The following sample income statement highlights the aforementioned:
At the end of the year, if a company’s net income after taxes is positive, it is kept in the form of retained earnings, reflected on the next year’s beginning balance sheet, or distributed to investors as dividends, as shown in Equation 3-2.
Retained Earnings and Shareholders’ Dividends
![]()
Before we end the discussion of the income statement, it is imperative that we clear up a few terms that are commonly used interchangeably. These include:
• Revenues and sales
• Margins, profits, earnings, and income
The three different kinds of margins—profits, earnings, and income—are as follows (in the order of their appearance on the income statement):
• Gross. The difference between revenues and COGS.
• Operating. Revenues – (COGS + operating expenses).
• Net. The difference between revenues and all of the company’s costs.
Cash Versus Accrual Accounting
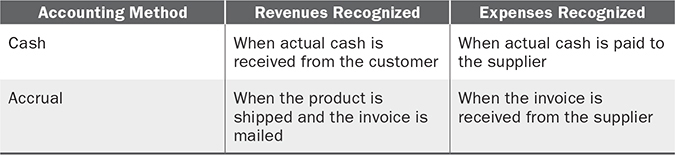
A final point to be made about the income statement is that it can be affected by the accounting method selected by the entrepreneur. The options for the entrepreneur are cash or accrual accounting. Typically, a company will select the accounting method that provides the greatest immediate tax benefit. It must also be noted that a company can, during its lifetime, change from one method to another only once, and this change must be approved by the Internal Revenue Service (IRS). The IRS usually approves a requested switch from cash to accrual accounting, but it usually rejects a request to change from accrual to cash accounting. What is the main difference between cash and accrual accounting? Simply stated, it is the time at which a company recognizes its revenues and expenses. Table 3-1 clearly shows the difference.
TABLE 3-1 Cash Versus Accrual Accounting
The accrual accounting method gives the reader of the income statement a richer and more complete depiction of the business’s financial condition, since all revenues generated by the business and all expenses incurred are included, regardless of whether actual cash has been received or disbursed. Because this method recognizes items immediately, many business owners try to use it to their advantage. For example, just before the end of the year, many owners will increase their inventories dramatically. The result is an increase in expenses and therefore a reduction in profits and taxes.
For publicly owned companies, where the markets reward revenue and profit growth with an increasing stock price, many owners prefer to use the accrual method because it helps them achieve the aforementioned increases. Unlike many privately owned companies, which seek to minimize taxes by reducing their reported EBT, public companies seek to show the highest possible EBT, as well as revenue growth. Given this objective, it is not unheard of for a company’s owner to get too aggressive and sometimes even act unethically with regard to growth.
For example, Premier Laser Systems, Inc., a spin-off from Pfizer, won FDA approval for a new laser device that promised to make drilling cavities painless. The publicly owned company, trading on the Nasdaq stock exchange, shipped and recognized revenues on $2.5 million in products to Henry Schein, Inc., the powerhouse distributor in the dental business. The only problem was that Henry Schein claimed that it had never ordered the products, refused to pay, and alleged that the products had been shipped to it so that Premier could show current and future stockholders an increase in revenues. Obviously, the supplier used the accrual method, which allowed it to recognize the revenue immediately upon shipment. Had its accounting method been cash, the revenue would have never been recognized because the recipient company refused to pay.3 Premier settled a number of class action suits; it also cooperated with a securities investigation and replaced its CEO. The company eventually filed for Chapter 11 bankruptcy years later.4
Private-practice physicians usually operate some of the most profitable small businesses in the country. Typically, doctors use the cash accounting method, which gives the reader a more limited picture of the company’s financial condition. Physicians and others who use this method do so primarily because their revenues come from notoriously slow payers, such as insurance companies and the government, also known as third-party payers. Therefore, instead of recognizing this unpaid revenue and paying taxes immediately on the profits that it helps to generate, they use the cash method to delay revenue recognition until the cash is actually received, thereby reducing the company’s profit before taxes and consequently the taxes paid. Using this method does not result in tax avoidance or elimination, however; it simply delays tax payments into future years.
Not all companies are allowed to use the cash method, including the following:
• Companies with average annual revenues of $10 million or more
• Companies where inventories are a heavy part of their business, such as auto dealerships and grocery wholesalers
Let’s look at Figure 3-3, which shows an end-of-the-year income statement using both methods. The company has sold and invoiced $1 million worth of merchandise and has received payment for $600,000. The merchandise cost was $500,000, an amount for which the company has been billed. The company has paid its suppliers $400,000.
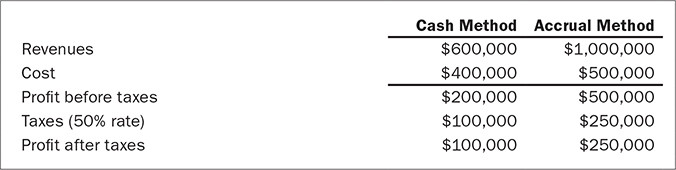
FIGURE 3-3 Cash Versus Accrual Accounting Example
As is obvious from this simple example, the accounting method that a company uses can affect not only the taxes owed, but also the three profit categories mentioned earlier. All three would be lower as a percentage of revenues under the cash method than under the accrual method. Therefore, it is imperative that when comparing income statement items against those of other companies, the comparison be made with the statements of companies using the same accounting method.
As mentioned earlier, a company can change its accounting method with the approval of the IRS. To see the impact of these changes, examine Figure 3-4.
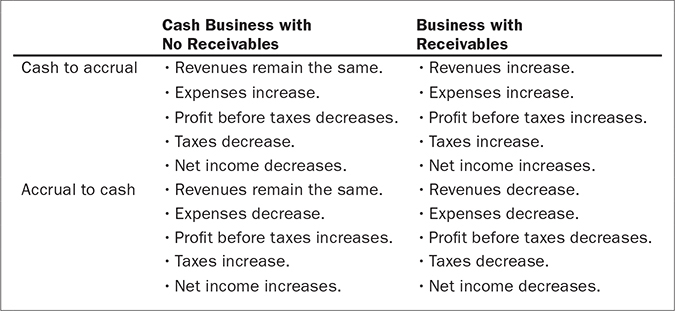
FIGURE 3-4 Comparison of Changes in Accounting Methods
Why would someone in a business with receivables want to switch from the cash method to the accrual accounting method when the result can be an increase in taxes? There could be several legitimate business reasons, including the following:
• For better comparison purposes, the company may want to use the same accounting method used by its competitors.
• The entrepreneur may be preparing the company to go public or to be sold. The accrual method would show the company to be bigger and more profitable than it would appear using the cash method.
Before ending the discussion on accounting methods, it should be pointed out that in December 1999, the IRS issued several rules regarding this topic. Specifically, the IRS ruled, “if you produce, purchase, or sell merchandise in your business, you must keep an inventory and use the accrual method for purchases and sales of merchandise,” with the exception that taxpayers with three years’ average annual gross income under $1 million or small businesses with three years’ average annual gross income less than $10 million can choose the cash method.5
The Tax Cuts and Jobs Act (P.L. 115-97) in 2017 expanded the eligibility of small businesses who could use the cash method of accounting. The requirement to keep inventory was eliminated, allowing those companies who, for example, use “drop shipments” from their suppliers directly to their customers, to use the cash method.6
The Balance Sheet
An example of a balance sheet is shown in Figure 3-5.
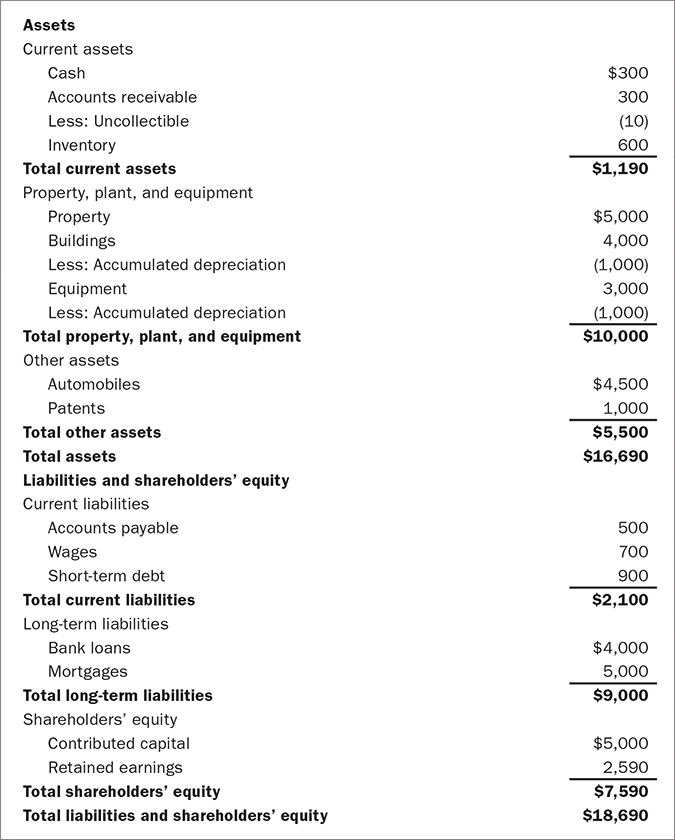
FIGURE 3-5 Bruce Company Balance Sheet, Year End 12/31/2019
The information contained on the balance sheet is also often presented in the format shown in Figure 3-6. The balance sheet is a financial snapshot of a company’s assets, liabilities, and stockholders’ equity at a particular time. It tells what a company owns (its assets), and what it owes (its liabilities). Bankers have historically relied on the analysis of ratios of various assets and liabilities on the balance sheet to determine a company’s creditworthiness and solvency position. For example, companies that have never shown a profit on their income statement, like Uber, Lyft, and Twitter, are able to remain solvent because they have millions of dollars on their balance sheets, which they use to finance the operations of their companies.
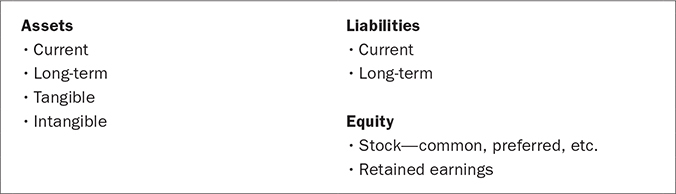
FIGURE 3-6 Balance Sheet Information
On the balance sheet, a company’s assets are separated into current and long-term categories. Current assets are those items that can be converted into cash within one year, including a company’s cash balance, the dollar amount due to the company from customers (accounts receivable), inventory, marketable securities, and prepaid expenses.
Long-term assets, tangible and intangible, are the remaining assets. They are recorded at their original cost, not their present market value, minus the accumulated depreciation from each year’s depreciation expense, which is found on the income statement. The assets that fall into this category include buildings, land, equipment, furnaces, automobiles, trucks, and lighting fixtures.
As stated earlier in this chapter, all long-term assets, except land, can be depreciated over time. This is permissible under GAAP despite the fact that some assets, in fact, appreciate over time. An example is real estate, which usually tends to appreciate over time, although the balance sheet does not reflect this fact. Therefore, it is commonly known that the balance sheet often undervalues a company’s assets, especially when real estate is owned. This fact was highlighted in the mid-1980s during the leveraged-buyout hostile takeover craze. Corporate raiders, as the hostile-takeover artists were known, would forcibly buy a company at an exorbitant price because they believed that the company had “hidden value” in excess of what the financial statements showed. One of the primary items they were concerned with was the real estate that the company owned, which was recorded on the balance sheet at cost minus accumulated depreciation. The raiders would take over the company, financing the purchase primarily with debt. Then they would sell the real estate at market prices, using the proceeds to reduce their debt obligations, and lease the property from the new owners.
The other components of the balance sheet are the liabilities and shareholders’ (stockholders’) equity sections. A company’s liabilities consist of the amounts that the company owes to its creditors as secured and unsecured debt. The liabilities section of the balance sheet, like the assets section, is divided into current and long-term categories. Current liabilities are those that must be paid within 12 months. Included in this category is the current portion of any principal payments due on loans for which the company is responsible—remember, the current interest payments on the loan are on the income statement—and accounts payable, which is very simply money owed to suppliers. Long-term liabilities are all of the company’s other obligations. For example, if the company owns real estate and has a mortgage, the total balance due on that mortgage minus the current portion would be reflected in the long-term liabilities category.
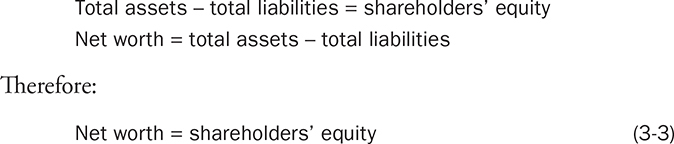
Stockholders’ equity is the difference between total assets and total liabilities. It is the net worth of the company, including the stock issued by the company and the accumulated earnings that the company has retained each year. Remember, the retained earnings are an accumulation of the profits from the income statement. Therefore, the company’s net worth is not necessarily the company’s value or what it would sell for. A company with a negative net worth, where total liabilities exceed total assets, may sell for quite a bit of money without any problems. As we will see in Chapter 6, a company’s net worth typically has no bearing on its valuation. A few important equations to remember are shown in Equation 3-3.
Shareholders’ Equity
Finally, the items on the balance sheet are also used to compute a company’s working capital and working capital needs. Net working capital is simply a measure of the company’s ability to pay its bills—in other words, the company’s short-term financial strength. A company’s net working capital is measured as shown in Equation 3-4.
Net Working Capital
![]()
The fact that two companies have the exact same level of working capital does not mean that they have equal short-term financial strength. Look, for example, at Figure 3-7. While both companies have the same amount of working capital, a banker would prefer to lend to Cheers Company because Cheers has greater financial strength. Specifically, for every dollar that Cheers owes, it has $6 in potentially liquid assets, whereas Hill Company has only $2 in assets for every dollar owed.
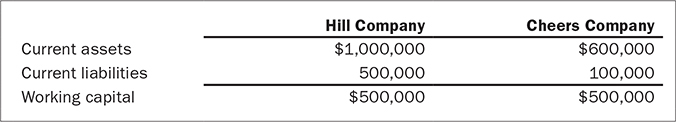
FIGURE 3-7 Working Capital Comparison
Now look at the example in Figure 3-8. It shows that a company with greater working capital than another is again not necessarily stronger. With a 10-to-1 asset-to-liability ratio, Jardine is obviously financially stronger than Webb, which has a 2-to-1 ratio, despite the fact that Webb has more working capital.
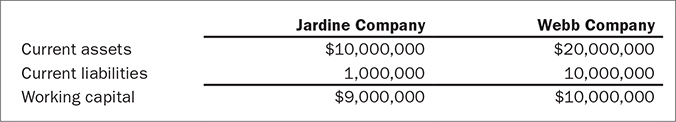
FIGURE 3-8 Working Capital Comparison
The entrepreneur must recognize that potential investors use the company’s working capital situation to determine whether they will provide financing. In addition, loan covenants may establish a working capital level that the company must always maintain or risk technical loan default, resulting in the entire loan being called for immediate payment.
One of the major differences between the balance sheet for manufacturing companies and for service companies are tangible assets, such as machinery and real estate, which is more common for the former, whereas the latter tend to have people as their primary assets.
The Statement of Cash Flows
The statement of cash flows uses information from the two other financial statements, the balance sheet (B/S) and the income statement (I/S), to develop a statement that explains changes in cash flows resulting from operations, investing, and financing activities. Figure 3-9 (see next page) provides an example of a cash flow statement.
The relationship between the sources and uses of cash is shown in Equation 3-5.
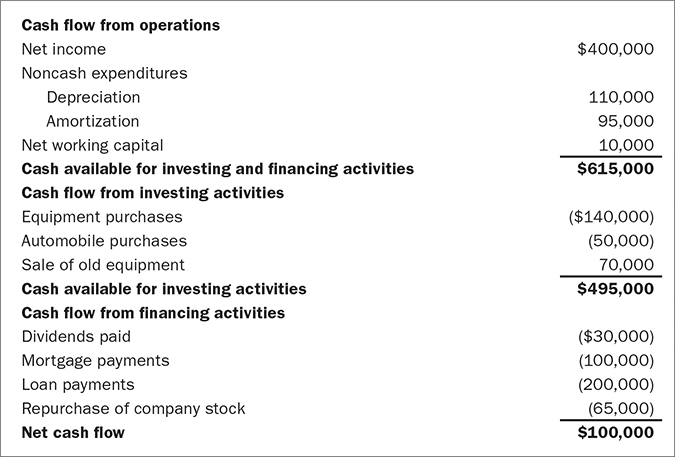
FIGURE 3-9 Richardson Company Cash Flow Statement, Year Ended 12/31/2019
Cash Flow

Cash Flow Ledgers and Planners
The cash flow ledger, regardless of accounting issues such as the cash versus the accrual method or noncash expenses such as depreciation, provides a summary of the increases (inflows) and decreases (outflows) in actual cash over a period of time. It provides important information primarily to the entrepreneur, but also possibly to investors and creditors (such as banks), about the balance of the cash account, enabling them to assess a company’s ability to meet its debt payments when they come due. A famous (but unnamed) economist once said, “Cash flow is more important than your mother”—well, maybe it is not more important, but it is essential because it is the lifeline of any business. Cash flow is different from profit and more important, as we will see later in this chapter.
The cash flow at the end of a period (e.g., a month) is calculated as shown in Figure 3-10, and Figure 3-11 provides an example of a monthly cash flow ledger. It indicates, on a transaction basis, all the cash received and disbursed during a monthlong period. As shown, the cash balance at the end of the month is equal to the total cash received less the total cash disbursed for the month.
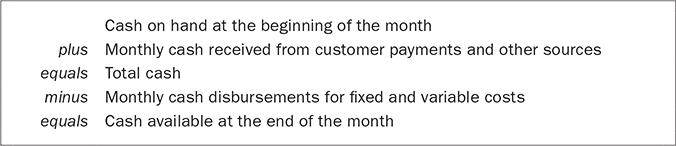
FIGURE 3-10 Sample Cash Flow Calculation
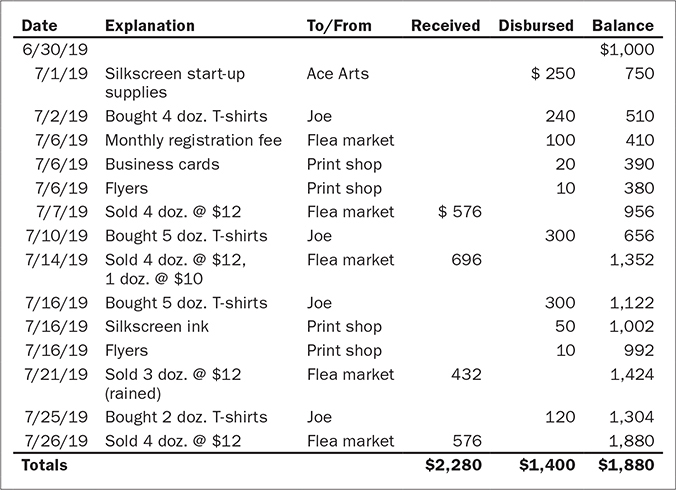
FIGURE 3-11 Oscar’s Business Ledger
Source: Adapted from Steve Mariotti, The Young Entrepreneur’s Guide to Starting and Running a Business (New York: Times Business, 1996).
The successful entrepreneurs are those who know their company’s actual cash position on any given day. Therefore, unlike the comparatively few times that they need to reread the income statement and balance sheet, it is recommended that entrepreneurs, especially the inexperienced and those in the early stages of their ventures, review the cash flow ledger at least weekly.
Figure 3-12 provides a weekly cash flow projection summary, which every new and inexperienced entrepreneur should prepare immediately upon opening for business and each month thereafter. It indicates the anticipated cash inflows during the month and the cash payments to be made. In the figure, the anticipated cash inflows for the month (59) are less than the expected cash outflows for the month (60); therefore, the cash balance for the month will be negative 1.
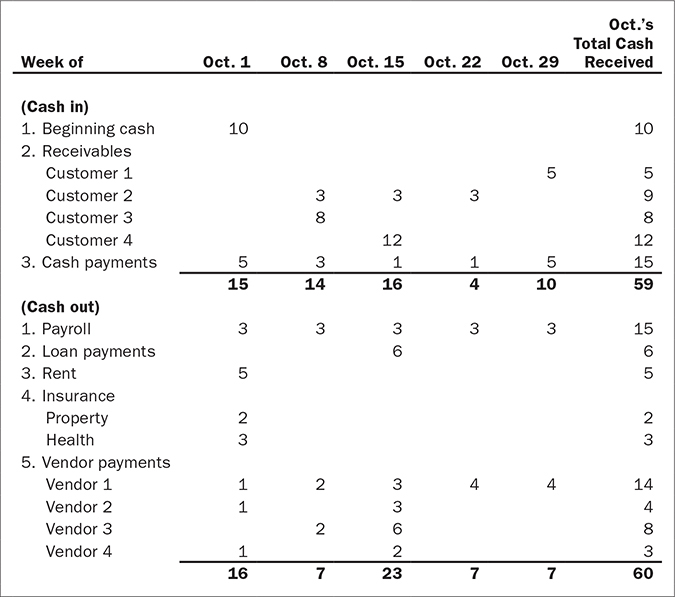
FIGURE 3-12 Sample Weekly Cash Flow Projections
Source: Teri Lammers, “The Weekly Cash-Flow Planner,” Inc., June 1992, p. 99.
The projection in Figure 3-12 was prepared at the end of September for the following month. It anticipates the cash inflows during the month and the cash payments to be made. The “Cash in” section includes expected payments from specific customers based on the terms of the invoices and the aging of the corresponding receivables. The terms were net 30, which means that the payment was due 30 days following the invoice date. However, the entrepreneur who completed this projection did not simply project October 29 because that was 30 days after invoicing. To do so would be too theoretical and, quite frankly, naive on the entrepreneur’s part. Instead, he used common sense and factored in the extra 7 days that Customer 1 typically takes before paying her bills. Thus, the product was invoiced on September 22, and the entrepreneur is forecasting the actual receipt of payment on October 29. This section also includes the cash payments expected each week throughout the month. These are expected to be actual cash payments that customers make when they pick up their merchandise. In these cases, the entrepreneur is not supplying any credit to the customer.
By doing this kind of projection each month, the entrepreneur can schedule his payments to suppliers to match his expected cash receipts. This planner allows him to be proactive, as all entrepreneurs should be, with regard to the money that he owes to his suppliers. It enables him to let specific vendors know in advance that his payment will probably be late. The cash flow ledger and planner are simple and very useful tools that the entrepreneur should use to manage cash flow successfully.
Development of Pro Formas
Entrepreneurs should develop pro forma financial statements for all new entrepreneurial opportunities, including either start-ups or existing companies that are being purchased. Any pro forma should have figures for at least three years and three scenarios—a best-case, a worst-case, and a most-likely-case scenario. If only one scenario is provided, then the automatic assumption is that it is the best case because most people always put their best, not their worst, foot forward. A company’s historical performance drives the financial projections for that company’s future, unless there is other information that indicates that past performance is not a good indicator of future performance.
For example, if a new contract has been signed with a new customer, then this could be used to adjust the financial projections. Otherwise, historical numbers must be used.
When there are no historical data, financial projections for a start-up company can be determined in one of the following ways:
• Conduct an industry analysis and select a company within the same industry that can be used as a comparable. Where possible, review the sales figures for this company to determine its sales history from Year 1 as well as its sales growth in the past few years. Extrapolate from these figures and use the data to determine sales growth for your company. Cost figures may be determined from cost data obtained through research on, for example, a publicly owned company in the same industry.
• If you have already secured sales commitments, use these commitments to calculate the worst-case scenario. Use larger amounts to calculate the best-case and most-likely-case scenarios.
• If the product or service is completely new, market research can be undertaken to determine the overall market demand for this new product or service. Identify the size of the market and assume that the company will get a specific percentage of the total market, depending on the total number of competitors. Also, identify the potential customers and estimate the number of units that can be sold to each. It is critical that, whenever possible, this market research be based on both secondary research (third-party market reports and/or articles from credible sources) and primary research (direct conversations with and/or surveys of potential customers in the targeted segment). This ensures that the projections are based on reliable, defensible information sources and are not just “back of the envelope” guesses.
• Alternatively, you can use specific figures for your projections, based on your own assumptions or expectations. It is important that you state what these assumptions are and justify why you believe them to be realistic.
An important issue for a start-up company to consider is to make sure that all the necessary equipment financing needs are included.
Before closing this section on pro forma development, a major warning must be given. It is important that the worst-case-scenario pro formas show that the cash flow can service the company’s debt. Otherwise, procuring financing, particularly debt financing, may prove to be virtually impossible. This does not mean that the pro formas should be developed by working backward and “plugging” numbers. For example, if the principal payments on debt obligations are $7,000 per month, it would be wrong to forecast the monthly revenue size, gross margins, and so on such that at least $7,000 in after-tax cash flow would be generated to service this obligation.
Pro formas should be developed from the top down, forecasting defensible revenues, legitimate variable costs, including labor and materials; and market-rate fixed costs such as rent. If, after developing the pro formas in this manner, it is clear that the debt cannot be serviced, the action that needs to be taken is not to plug numbers, but rather to:
• Reduce the amount of the debt.
• Lower the interest rates on the debt.
• Extend the terms of the loan.
All of these actions are designed to free up cash flow to service short-term debt.
Even if the entrepreneur is successful in raising capital using pro formas filled with plugged numbers, she will ultimately experience difficulties when the company’s performance proves to be lower than the projections and the cash flow is not sufficient to meet the debt obligations. Finally, experienced business investors, such as bankers and venture capitalists, can easily detect pro formas filled with plugged numbers because the projections are typically at a level showing that all the company’s debt can be serviced, with maybe a little cash left over. Therefore, do not plug numbers. A pro forma development case study for Turner Company is included at the end of Chapter 4.
Checklist of Financial Information
To enable investors to better understand the information presented in the pro formas, it is best to provide a summary of financial data and then present the detailed financial tables. Data should include:
• Historical financial statements (for three to five years):
• Cash flow statement.
• Income statement.
• Balance sheet.
• Pro formas (for three to five years). Financial projections (as described previously) should be provided under three scenarios—best, worst, and most-likely cases—where each scenario is based upon a different set of assumptions. For example, the worst-case scenario may assume no growth from Year 1 to Year 2, the best-case scenario may assume 5% growth, and the most-likely-case scenario may assume a 2% growth rate. A summary of the assumptions should also be provided.
• Detailed description of banking relationships for business accounts and payroll.
• The terms and rates of loans and their amortization period.
• The proposed financing plan, including:
• The amount being requested.
– Sources and uses of funds. (Note: This information is important for several reasons. First, financiers need to know how their funds are going to be used. Second, identifying other investors who are willing to provide you with resources [sources] will encourage potential investors to make a similar commitment—people find it easier to invest once they know that others have already done so. Third, value-added investors may be able to help you find alternative ways of getting resources.)
• Payback and collateral.
– Proposed strategy for the liquidation of investors’ positions.
• Financing plan for the immediate term, short term, and long term.
• Working capital needs.
• Line of credit.
• Cash flow from operations—outside investors, sell debt, or IPO.