
Charting the Progress of a Risk Management Plan
Managers often use charts to show the progress of a risk management plan. The risk management plan should include a risk register, where the following items are documented: (1) identified risks, (2) when risks are assessed/evaluated, (3) the chosen risk responses/mitigating actions, and (4) the reassessed or residual risk. Charts provide a graphic representation of key information. As the saying goes, “a picture is worth a thousand words.” Similarly, a chart is worth a thousand words. The following sections cover some of the common charts managers use to track a plan’s progress.
Milestone Plan Chart
A milestone plan chart is a simple graphic representation of major milestones, showing them laid out in a graphic format. If dependencies exist between the milestones, this chart will show them. In other words, if milestone 2 can’t begin until milestone 1 has been completed, this chart will show this dependency.
Commonly, actual start and end dates are included in the chart. FIGURE 4-4 shows an example of a milestone plan chart.
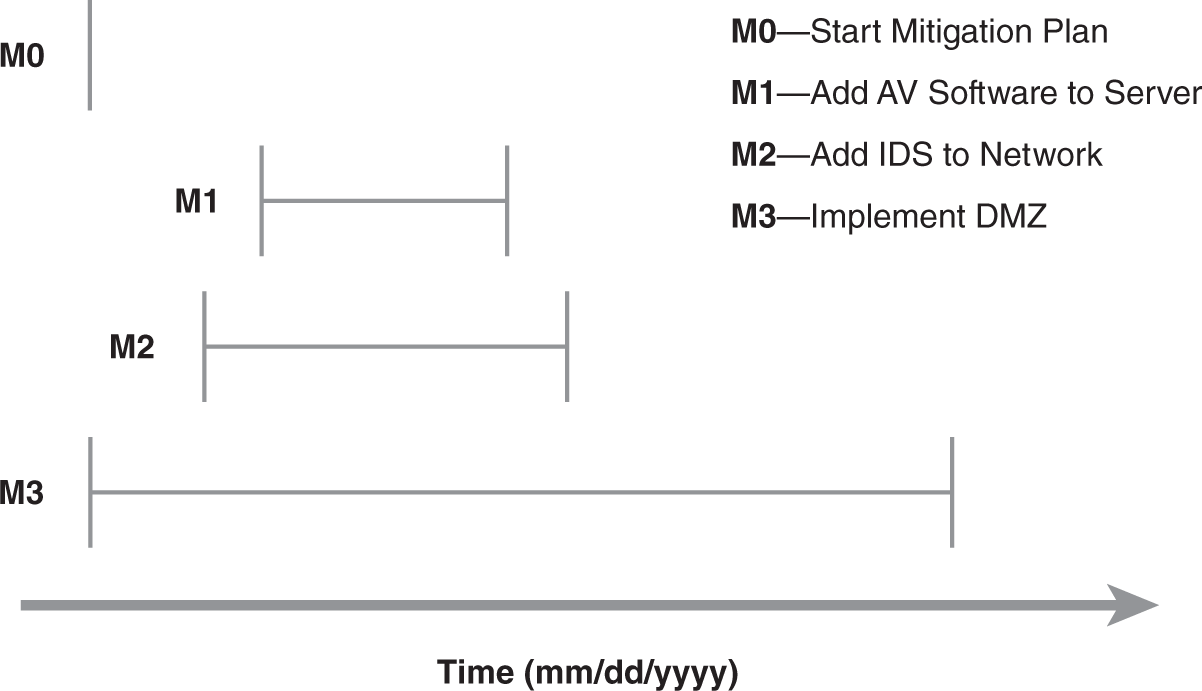
FIGURE 4-4 Milestone plan chart.
The milestone plan chart can also help allocate resources. For example, the tasks in Figure 4-4 aren’t dependent on one another, as indicated in the chart by the staggered tasks, thus allowing each task to start at the same time. However, if the same person or department will be performing all the tasks, starting each one at the same time may not be possible.
In this case, the task milestone that will take the longest time to complete should be started first. In Figure 4-4, the M3 milestone will implement a DMZ and will take the longest. Once the firewalls have been ordered, another task can be started while waiting for the firewalls to arrive. M2 can start at that point. Once the IDS software has been ordered, milestone M1 can be started.
This chart can also help management change the priority of any of the milestones. The installation of antivirus software may be considered the most important first step. Figure 4-4 shows that M1 is being delayed so that M3 can start first. This can be changed so M1 starts first with an accepted delay in the implementation of the DMZ.
Gantt Chart
A Gantt chart shows a project schedule. Gantt charts are commonly used in project management. The primary difference between the milestone plan chart and the Gantt chart is that the Gantt chart shows more detail.
FIGURE 4-5 shows an example of a Gantt chart. The shaded items show the tasks that have been completed. Notice that the Gantt chart is showing the detailed steps for the implementation of the DMZ.
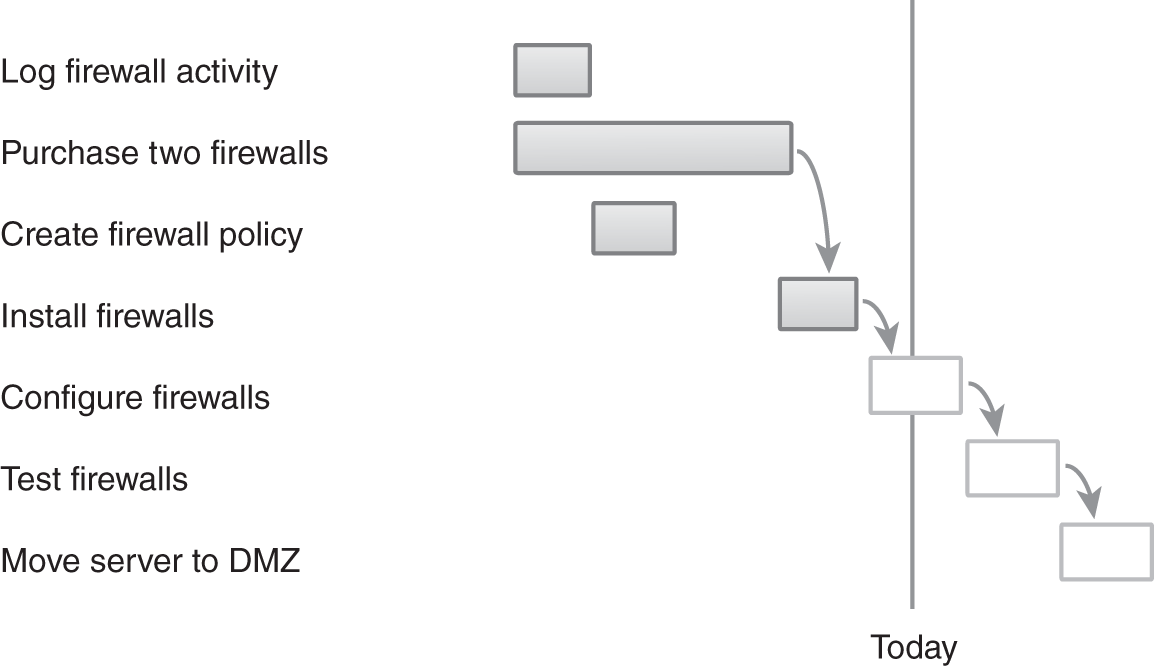
FIGURE 4-5 Gantt chart.
The Gantt chart allows managers to quickly view the progression and status of the project. In Figure 4-5, all the tasks that were supposed to have been completed before today have been completed. The PM needs only to focus on the tasks in progress or future tasks.
 NOTE
NOTE
The Gantt chart was developed by Henry Gantt, who worked with the Army Bureau of Ordnance during World War I. He realized that processes could be controlled more easily if they were broken down into smaller elements. As the often-repeated saying goes, “How do you eat an elephant? One bite at a time.”
On the other hand, if previous tasks weren’t completed, the PM can quickly identify where to focus attention. For example, if the firewalls weren’t installed yet, the Install Firewalls task would not be shaded. The PM could see this element is past due and address the issue.
Most project management software automates the creation of Gantt charts. Additionally, as the tasks in the project are completed, the chart will automatically indicate completion in the chart. Before computers were popular, these charts would be filled in by hand.
Critical Path Chart
Some tasks within a project can be delayed without impacting the project’s finish date. Other tasks must be completed on time. A critical path chart shows a list of project tasks that must be completed on time. If tasks in the path are delayed, the overall project will be delayed.
For example, a firewall cannot be installed until the firewall has been purchased. If the purchase is delayed, the installation will be delayed. These two items would be in the critical path. On the other hand, creating a log of current firewall activity can be delayed. As long as the delay isn’t too long, the delay won’t impact the overall schedule.
FIGURE 4-6 shows an example of a critical path chart for the firewall project. Compare Figures 4-5 and 4-6. Notice that two tasks are missing in Figure 4-6, Log Firewall Activity and Create Firewall Policy. If these two tasks are slightly delayed, they will not delay the entire project. The only requirement is that they be completed before the Install Firewalls task starts.
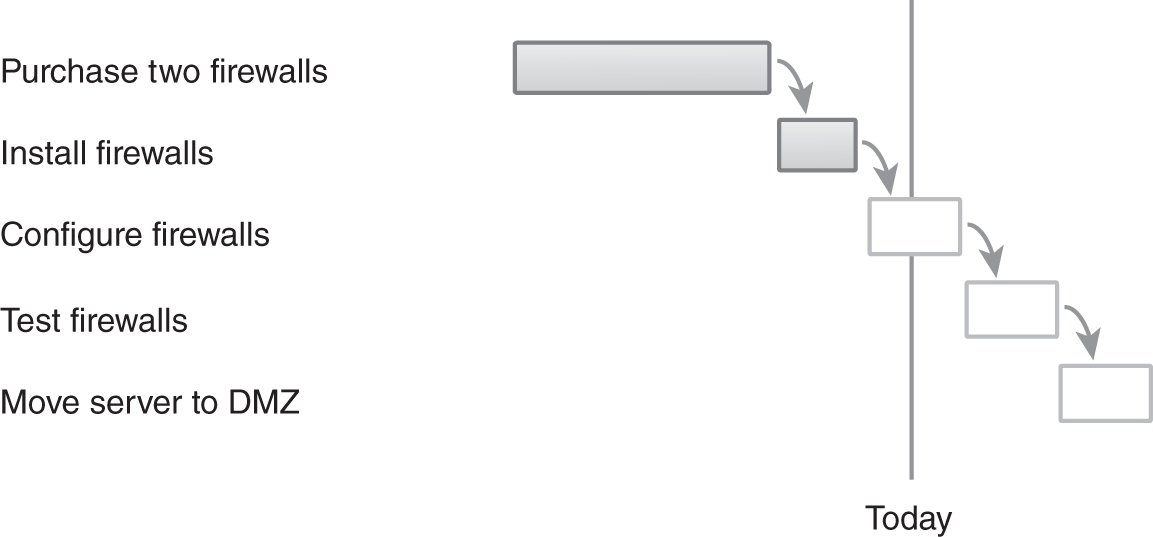
FIGURE 4-6 Critical path chart.