
Types of Risk Assessments
When considering a risk assessment, which method to use must first be identified. The two primary methods used in the IT field are:
- Quantitative—The quantitative method is objective. It uses numbers, such as actual dollar values. A quantitative risk assessment requires a significant amount of data. Gathering this data often takes time. If the data is available, this type of risk assessment becomes a simple math problem with the use of formulas.
- Qualitative—The qualitative method is subjective. It uses relative values based on opinions from experts. Experts provide their input on the probability and impact of a risk. A qualitative risk assessment uses words, such as low, medium, and high, instead of numbers. It can be completed relatively quickly.
Both of these methods are explored in greater depth in the following sections.
That neither method is superior to the other is important to keep in mind. They both have benefits and limitations. However, one method works better than the other in specific situations. Being aware of the options makes choosing the right method for the right situation easier.
Quantitative Risk Assessments
A quantitative risk assessment uses numbers, such as dollar values. Data is gathered and then entered into standard formulas. The results can help identify the priority of risks. The results can also be used to determine the effectiveness of controls.
Some of the key terms associated with quantitative risk assessments are:
- Single loss expectancy—The total loss expected from a single incident is the single loss expectancy (SLE). An incident occurs when a threat exploits a vulnerability. The loss is expressed as a dollar value, such as $5,000. The dollar value of the loss includes the value of hardware, software, and data. The asset value (AV) multiplied by the exposure factor (EF) equals SLE. The EF describes the loss that will happen to the asset as a result of the threat, which is expressed as a percentage value. Hence, SLE = AV × EF. For example, if AV is $10,000 and EF is 0.5 (i.e., 50 percent exposure to a threat), then SLE is $5,000.
- Annual rate of occurrence (ARO)—The number of times an incident is expected to occur in a year is the annual rate of occurrence (ARO). If an incident occurred once a month in the past year, the ARO is 12. Assuming nothing changes, the incident’s occurring 12 times next year is likely.
- Annual loss expectancy—The expected loss for a year is the annual loss expectancy (ALE). ALE is calculated by multiplying SLE × ARO. Because SLE is given as a dollar value, ALE is given as a dollar value. For example, if the SLE is $5,000 and the ARO is 12, the ALE is $60,000.
- Safeguard value—The cost of a control is the safeguard value. Controls are used to mitigate risk. For example, antivirus software could have an average cost of $50 for each computer. Therefore, the safeguard value of 100 computers is $5,000.
In this scenario, a company issues laptop computers to employees. The value of each laptop is $2,000, which includes the hardware, software, and data. About 100 laptops are being used at any time. In the past two years, the company has lost an average of one laptop per quarter. These laptops were stolen when systems were left unattended. With this information, the following questions can be answered:
- What’s the SLE?
- What’s the ARO?
- What’s the ALE?
 TIP
TIP
Understanding the types of risk assessments for the (ISC)2 Systems Security Certified Practitioner (SSCP) and Certified Information Systems Security Professional (CISSP) exams is important. Having a good understanding of quantitative and qualitative methods is necessary, which includes all the associated terms of quantitative methods.
FYI
A hardware lock is a metal cable that can attach a laptop computer to furniture. The cable is looped around a desk or chair and then connected to the laptop. Once the lock, which is usually a combination lock, is secured, the combination needs to be entered to remove the lock from the laptop. Even though a thief could use bolt cutters to cut the cable or could carry the laptop out with the desk, both actions would look suspicious.
Because the value of each laptop is $2,000, the SLE is $2,000. One laptop is lost each quarter, resulting in an ARO of 4. The ALE is calculated as $2,000 × 4, or $8,000.
The ALE can then be used to determine the usefulness of a control. For example, the company could purchase hardware locks for the laptops in bulk at a cost of $10 each. The safeguard value is $10 × 100 laptops, or $1,000. The estimation is that, if the locks are purchased, the ARO will decrease from 4 to 1. Should the company purchase these locks?
The effectiveness of the control can be determined using the following calculations:
- Current ALE = $8,000 (ARO of 4 × $2,000)
- ARO with control = 1
- ALE with control = $2,000 (ARO of 1 × $2,000)
- Savings with control = $6,000 (Current ALE of $8,000 − ALE with control of $2,000)
- Safeguard value (cost of control) = $1,000 ($10 × 100)
- Realized savings = $5,000 (Savings with control of $6,000 – Safeguard value of $1,000)
In this example, the savings in the first year is $5,000, which provides a cost-benefit analysis (CBA) and clearly indicates the locks should be purchased. If nothing is done, the company will likely lose $8,000. However, by purchasing the locks at a cost of $1,000, the company will lose only $2,000. In other words, the company is spending $1,000 to save $6,000.
Benefits
One of the primary benefits of a quantitative risk assessment is that it becomes a simple math problem, which is especially true if tools that automate the assessment are used. For example, applications are available that allow the SLE, ARO, and safeguard values to be plugged in. The application then calculates the results and provides a recommendation. Because the application performs the calculations, the data is often more accurate.
Another big benefit of a quantitative risk assessment is that it provides a CBA. When the SLE, ARO, and safeguard values are accurate, a CBA can also be calculated, which was discussed in the previous section.
Management is often familiar with quantitative assessment terminology. For example, a quantitative assessment uses dollar terms to express losses. Because of this, it becomes easy for management to grasp the details of the assessment and its recommendations.
 NOTE
NOTE
These formulas typically look at a single year. The calculations can become quite complex if other costs are included. Depreciation, maintenance, and replacement costs for follow-on years are usually not included in the calculations.
Last, the formulas use verifiable and objective measurements. If a website makes $2,000 in revenue an hour, it will lose that revenue if it is down for one hour, which is a verifiable fact.
Limitations
Using a quantitative analysis has its limitations. One of the biggest limitations is that accurate data isn’t always available, which is especially true when identifying ARO reductions. The accuracy of these estimates can be difficult to verify.
For example, an earlier example stated that, if hardware locks were purchased, the ARO would decrease from 4 to 1. In other words, instead of four laptops being stolen each year, only one laptop would be stolen. Decreasing the ARO from 4 to 1 sounds good, but is it true? This difficulty is also a vulnerability when reporting to skeptical or unsupportive managers.
Another limitation is ensuring that people use the control as expected. Hardware locks were mentioned in the example to protect the laptops. As long as everyone uses the hardware locks, they will work. However, users may consider them inconvenient. Just because the organization purchased the locks doesn’t mean employees will use them.
NOTE
A cost-benefit analysis provides meaningful data to decision makers. If the benefits of a control outweigh the costs, the control can be implemented to reduce the risk. If the costs are greater than the benefits, then the risk can be accepted.
Additional steps may need to be taken to ensure users are aware of the importance of the control. Even though laptop computers are stolen all the time, users are still very surprised when it happens to them. Policies may need to be created that require the use of the control. Additionally, training may need to be included to reinforce the importance of the control.
Qualitative Risk Assessments
A qualitative risk assessment doesn’t assign dollar values. Instead, it determines the level of risk based on a more subjective assignment of the probability and impact of a risk, unlike a quantitative risk assessment, which is calculated based on cost estimates. These values are determined by gathering the opinions of experts.
Probability and impact are defined as follows:
- Probability—The likelihood that a threat will exploit a vulnerability. The risk occurs when a threat exploits a vulnerability. A scale can be used to define the probability that a risk will occur. The scale can be based on word values, such as low, medium, or high. Then, percentage values can be assigned to these words. For example, a value of 10 percent could be assigned to a low probability and 100 percent to a high probability.
- Impact—The negative result if a risk occurs. Impact is used to identify the magnitude of a risk. The risk results in some type of loss. However, instead of quantifying the loss as a dollar amount, an impact assessment could use words, such as low, medium, or high. These categories can also be used to identify probabilities. However, where a probability is expressed as a percentage, impact is expressed as a relative value. For example, low could be 10, medium could be 50, and high could be 100.
The risk level can be calculated with the following formula:
Risk level = Probability × Impact
TABLES 5-1 and 5-2 show one way the scales can be defined in a risk assessment. The values for each of these scales are assigned based on current known threats and vulnerabilities as well as current controls. Note that the expert assigns the probability and impact as words, such as low and medium. Later, the person completing the risk assessment converts the words to numbers based on the scale. For example, if the expert assigns a low probability, the risk assessment gives it a value of 10 percent. The experts won’t necessarily know the actual values and ranges. Instead, they make their decisions based on the descriptions.
| PROBABILITY | DESCRIPTION | VALUE AND RANGE |
|---|---|---|
| Low | The risk is unlikely to occur. Threats are not active. Vulnerabilities either are not known or have been mitigated. | 10 percent (0 to 10 percent) |
| Medium | A moderate chance exists that the risk will occur. It has occurred in the past, but mitigation controls have reduced recent occurrences. | 50 percent (11 to 50 percent) |
| High | A high probability exists that the risk will occur. It has occurred in the past and will occur again if not mitigated. | 100 percent (51 to 100 percent) |
| IMPACT | DESCRIPTION | VALUE AND RANGE |
|---|---|---|
| Low | If the risk occurs, it will have minimal impact on the company. The attack will not impact any critical data or systems. | 10 (1 to 10) |
| Medium | If the risk occurs, it will have a moderate impact on the company. It may affect critical data or systems but not to a large extent. | 50 (11 to 50) |
| High | If the risk occurs, it will have a high impact on the company. It will affect critical data or systems and cause substantial losses. | 100 (51 to 100) |
NOTE
An important point to realize about the qualitative risk assessment is that the scale must be defined. However, there is no single standard. One company may use three values of low, medium, and high. Another company may use five values of slight, slightly moderate, moderate, moderately severe, and severe. As long as the scale in the risk assessment is defined, any scale can be used.
A qualitative analysis can be divided into two sections:
- The first section attempts to prioritize the risk.
- The second section evaluates the effectiveness of controls.
Both sections can be performed at the same time. However, for clarity, they are presented as two separate actions in this chapter.
Prioritizing the Risk
The goal of this part of the risk assessment is to identify which risks are most important. Identifying the most important risks is done by assigning probability and impact values to known risks.
For example, a company website sells company products. Because of recent outages, the most important risks to the website need to be identified. A list is derived based on feedback from several experts. These risks now need to be prioritized.
The risk categories are:
- DoS attack—Any denial of service (DoS) or distributed DoS (DDoS) attack that results in an outage.
- Web defacing—Modification of the website by unauthorized parties.
- Loss of data from unauthorized access—Any loss of confidentiality. This loss could be from an attacker accessing customer data or any internal private data. The loss does not include the loss of public data, which is freely available.
- Loss of website data from hardware failure—The loss of any website data. This loss can include data used to show the webpages to customers or the website application used to retrieve and format the data into webpages.
The website is protected in a demilitarized zone (DMZ) and has antivirus software installed. The qualitative analysis survey could be distributed to key experts to determine risks.
These surveys can be conducted in several ways: via surveys that are filled out independently, by interviewing experts, or within a meeting but without discussion. If there is discussion, the boss might say, “Clearly, any loss of data will have a high impact,” which may influence subordinates. Some may have thought the value was low but may instead enter it as high or medium.
After the data has been gathered from the experts, it must be compiled and summarized. If numerical values are assigned to low, medium, and high, such as 10, 50, and 100, the averages can be calculated.
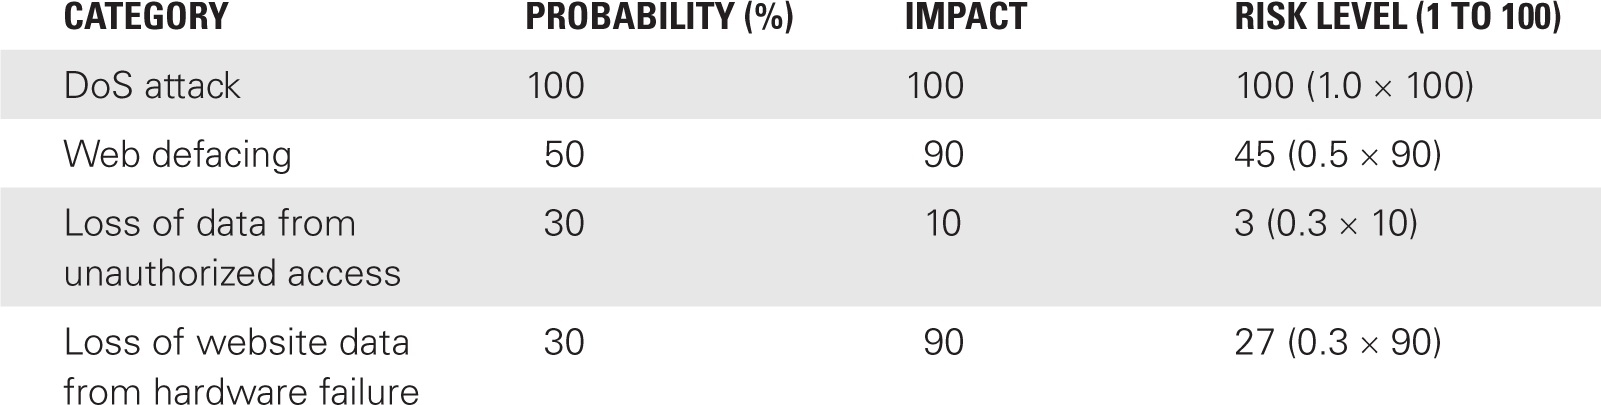
TABLE 5-3 shows how the results could look. The average probabilities and impacts have been summarized and entered into each box. For example, for the DoS attack, the average probability and the impact were both determined to be 100. The probability and impact were calculated by averaging each of the inputs by the different experts. The risk level was determined by the formula Probability × Impact.
This data can be presented graphically in many ways. The risk matrix in FIGURE 5-2 shows one method.
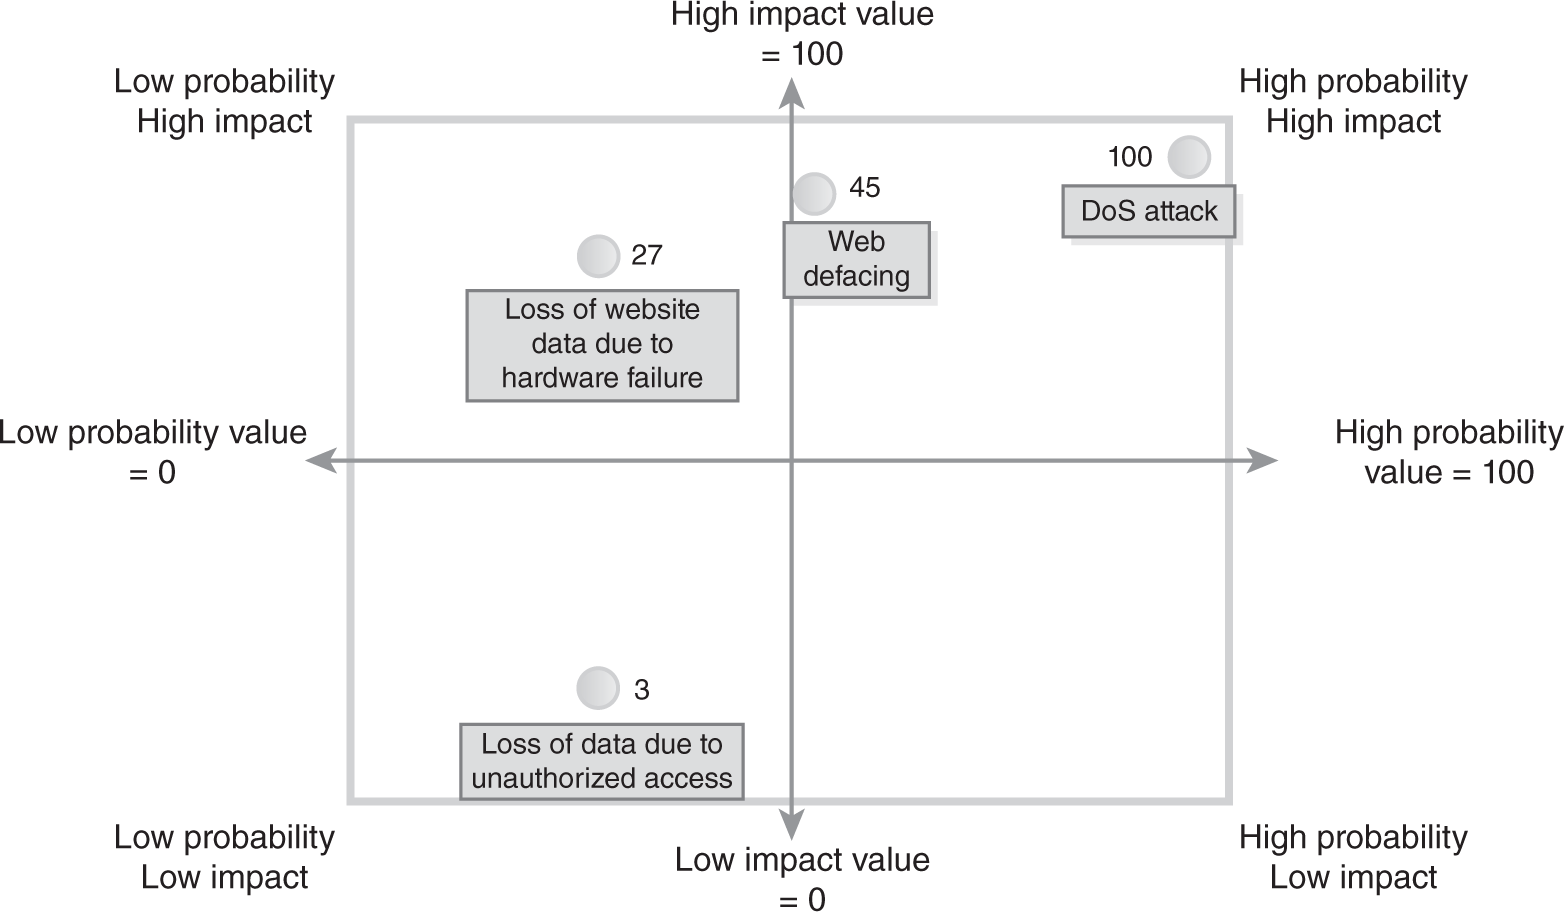
FIGURE 5-2 Risk matrix.
At this point, Table 5-3 shows that the highest risk is from a DoS attack, which has a risk level of 100. The lowest risk level is 3 for the loss of data from unauthorized access.
Loss of data sounds as if it would be very important. However, if existing controls and practices have removed most of the risk, the impact is reduced. For example, administrators might have already removed all private data from the website. Although someone may try to hack into the website to get the data, the impact is low because the site holds only public data.
On the other hand, the risk of a DoS attack clearly rises to the top as the biggest risk. Based on the current controls, the experts agree that the system will be attacked. When it is attacked, they also agree that the impact will be high.
FYI
Different redundant array of independent disks (RAID), which is also called redundant array of inexpensive disks, configurations allow a system to continue to run even if a disk drive fails. Sophisticated RAIDs allow a system to operate even if more than one disk drive fails. RAID also provides fault tolerance. A fault can occur, and the disk subsystem can tolerate it, meaning it will continue to operate.
The list of risks from most to least important is:
- Priority 1—DoS attack, with a value of 100
- Priority 2—Web defacing, with a value of 45
- Priority 3—Loss of website data from hardware failure, with a value of 27
- Priority 4—Loss of data from unauthorized access, with a value of 3
Evaluating the Effectiveness of Controls
At this point, which safeguards or controls should be applied for high-impact risks can be determined. A survey could help here also. For example, the mitigation choices survey could be used.
Notice that “Loss of data from unauthorized access” is not included in the survey table. Because the experts have agreed that it doesn’t present a significant risk, there is no need to mitigate it. Said another way, management in this case has decided to accept the residual risk.
Survey for Determining Safeguards or Controls
The following table lists controls in the left column. Across the top, it lists risks. Please enter a value of low, medium, or high under each heading. The value you enter should indicate the value of the control to mitigate the risk. For example, if you think placing the web server in a DMZ will have a high success rate in preventing DoS attacks, enter high under this heading. If you think it will have a low success rate, enter low.

Just as the risks can be summarized, so, too, can the effectiveness of the controls. TABLE 5-4 shows the presumed results of the survey. As in other surveys, high has a value of 100, medium has a value of 50, and low has a value of 10.
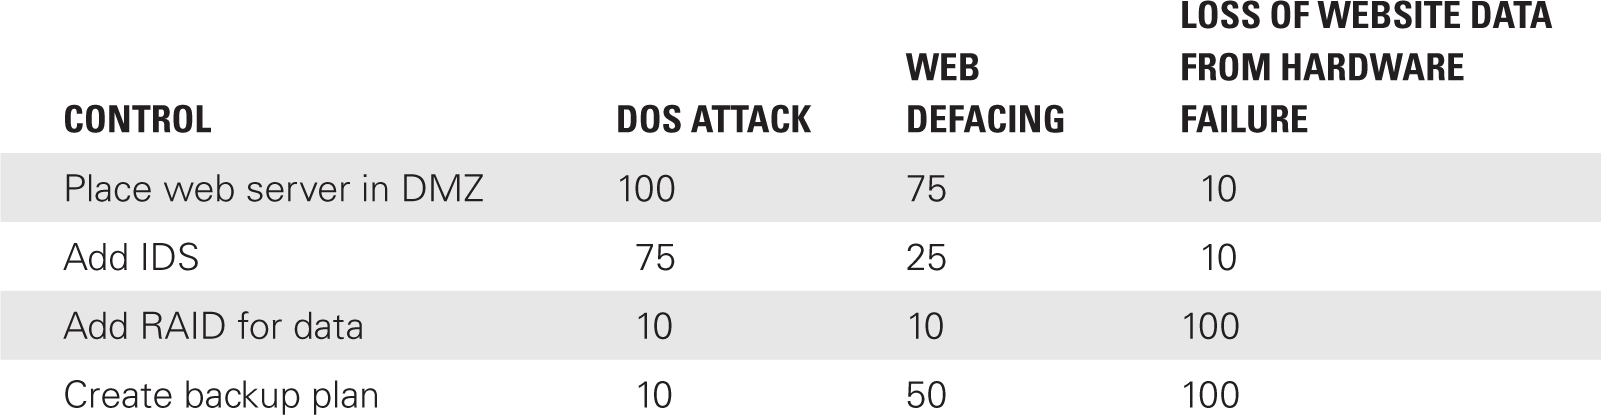
Table 5-4 shows that placing the server in the DMZ will provide the best protection from a DoS attack. Additionally, an IDS will also provide a high level of protection. The table helps to match up the best controls for the individual risks as follows:
- DoS attack—Protect with DMZ and/or IDS
- Web defacing—Protect with DMZ
- Loss of website data from hardware failure—Protect with RAID and backup plan
Benefits
A qualitative assessment has several primary benefits:
- Uses the opinions of experts
- Is easy to complete
- Uses words, instead of numbers, which are easier to express and understand
Data is gathered from the experts who know the systems the best. Their combined system knowledge and experience allows them to identify the source of problems quickly. As long as experts are available for gathering data, the risk assessment is easy to complete. They can be provided with surveys to complete at their own pace, and they don’t even need to meet together; they can be interviewed separately.
A qualitative risk assessment uses scales, which can easily be adapted to the culture of the organization. The scales allow individuals to understand what the values are by being expressed in everyday words they use, which also makes it easier to involve people who may be experts in their field but are not security or IT experts.
For example, human relations (HR) experts may have significant knowledge about the requirements for HIPAA. They know the dangers from unprotected data and the actual fines that can be assessed or the jail time awarded. HR experts can provide substantial input into a risk assessment.
Limitations
A qualitative assessment has several limitations. These include:
- Subjective—The analysis and results are based on opinions more than facts. A different perspective on these opinions could provide a completely different result. If the opinions are gathered in a group, a strong participant could shape the ideas of the entire group.
- Based on expertise of the experts—The value of the assessment is only as valuable as the expertise of the experts. If the experts have a solid foundation of knowledge and wide breadth of experience, the results can be valuable. On the other hand, if access to real experts is not available, the results may have very limited value.
- No CBA—A qualitative assessment does not include a CBA. The usefulness of the controls isn’t as clear as with a quantitative analysis. Although the opinions of the experts are still valuable, the results may not be as clear to management. Management may have a more difficult time deciding which safeguards to use.
- No real standards—A company needs to define the scales used in the process. For example, the scale can be as simple as low, medium, and high. However, the scale needs to be developed and defined for the participants, which requires the expertise of someone who understands risk assessments and how the data will be used.
Comparing Quantitative and Qualitative Risk Assessments
As a reminder, neither method is considered superior to the other. They both have benefits and limitations. As a summary, here are a few comparisons between quantitative and qualitative risk assessments.
Quantitative analysis:
- Objective
- Uses numeric values, such as dollar amounts
- Reliably repeatable
- More time consuming
- Requires access to a significant amount of historical data
- Data not always easy to obtain
- Based on SLE, ARO, and ALE formulas
- Shows clear losses and savings with dollar values
- Data can easily be used in a CBA
Qualitative analysis:
- Subjective
- Based on opinions of experts
- Can be done quicker at a lower cost than quantitative analysis
- Uses word values, such as low, medium, and high
- Requires a definition of scales used in the risk assessment