
The Numbers
In early stage companies (or projects), there is a need for close control of capital resources. Yet even with staff and control systems in place, money seeps through the cracks, never to be seen again. Clearly, better tools are required to navigate through this quandary. I present a financial model that not only helps control the variability of cash flows, but also allows you to change the assumptions behind the numbers to give it a predictive capability. The change in the accounting and finance functions at each stage of growth will also be presented. They are dramatic and affect each function in the company.
The world of numbers completely embraces the world of commercialization decisions. The value of numbers is that it allows us to measure and compare our performance against larger goals such as corporate return investments and periodic (monthly) goals. It certainly flags issues and allows us the calculus of repairing them. Numbers also allow us to choose between alternatives in such a way that compares various attributes (ratios) in multiple projects. Finally, numbers allow the outside world to observe the performance of projects and activities. Let’s look at each category in more detail.
In the path of commercialization decisions, there is one particular numerical gate for decisions. It is the Return on Investment (ROI). In the simplest terms, it is the calculation of the amount of capital invested in a project and its anticipated returns. If some minimum value cannot be obtained, that becomes a basis for rejecting a project. You read about ROI as a feasibility analysis decision point in Chapter 5. The calculation is as follows:
![]()
There may be mitigating circumstances where an idea is brought forward with a lower than anticipated return, perhaps because it provides the parent organization with a strategic entry to a new market segment. This type of project is sometimes called a “loss leader.” The decision is strategic and can override any financial considerations.
ROI alone does not allow an absolute financial decision about a project to be made. There may be multiple projects that promise attractive returns, but in total would put a significant drain on available capital from the parent organization. A means of calculating the rates of return among projects is needed. It is called the Internal Rate of Return (IRR) and quantifies the rate that capital expenditures will be consumed. It also allows you to compare the parent organization’s ability to raise and provide adequate project funding. There are variations available such as adding investment capital, loans and selling equity (stock) in public markets that can add to the financial options available. These options are commonly used but not without consideration of overall equity dilutions and default penalties in debt financing.
Another financial consideration flows from the perceived strength of the parent organization as measured by its balance sheet (B/S) and its embedded ratios. This document is usually compiled on a monthly basis and represents a presentation of the assets and liabilities of the parent corporation. Within its structure, the cash and tangible assets are shown. In addition, it presents the value of obligation against assets such as loans and accounts payable. It is one of three controlling financial documents. The Income Statement and Statement of Cash Flow are the other two and will be covered later in this chapter. A sample balance sheet (sans numbers) is shown in Figure 8-1.
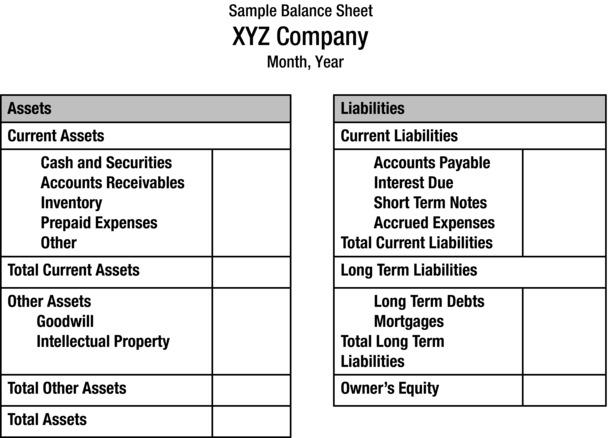
Figure 8-1. Sample balance sheet
The balance sheet presents a listing of all assets and liabilities of the company. The format for this is the same whether it is General Motors or a startup company. They are generally delineated in two sections of current (less than 30 days) and long-term (beyond 30 days) entries. The first assets look at cash, inventories, and accounts receivable (money owed to the company). These are the first items that suggest how much capacity the company has to invest in new commercialization projects. Outside sources such as banks consider assets like inventories and receivables (on a discounted basis) as viable collateral to loans, but that is only one part of the story.
The assets are offset by a listing of the organization’s liabilities. Top ones include payables (such as money owed to vendors) and others like outstanding loans and mortgages on properties. If there are many debt obligations presented, the financial judgment is that the organization is highly “leveraged” and thus vulnerable to risks. Included in this is the judgment of whether the company is ready to absorb the risk of new commercial ventures.
There is an important ratio of current assets to current liabilities called the “current ratio.” A positive number suggests that the organization is capable of absorbing financial risks and responsibilities. It also deals with the question raised during the feasibility analysis as to whether the company is ready for supporting new commercialization activity.
Another consideration is the fact that all commercialization projects are not the same with respect to their timing of both investments and anticipated returns. This is particularly of interest when decisions between project alternatives need to be considered. There is an analytical financial model called the Net Present Value (NPV) that rationalizes time-based components to a present number. NPV allows investments made over periods of time to be mathematically brought to a current value so that it may be compared with other projects being considered. It is particularly effective in simple, linear projects. Projects with large variations in capital investment require more complex analytical tools.
We soon see that there are multiple measurements to characterize and anticipate the capital requirements of a given project. Within the enthusiasm of quantification comes a quick caution about “analysis paralysis.” There may be significant numerical arguments for or against a given project. Many profound decisions have been made on a much more balanced and intuitive “gut” feel. Examples are many and quickly allow us to dwell on the Jobs transformation of Apple. Many good decisions are made on an irrational basis. It’s a bit like a pendulum that swings from both sides and eventually finds an equilibrium that allows both sides to prosper. Before too much effort is focused on finding a balance, we should look at the project’s internal elements.
The Internal Balance
In an earlier chapter we looked at planning and its multiple benefits to the commercialization process. It became obvious that one outcome of the process would be an indication of the capital requirements to fund it. Whether a formal PERT or Gantt methodology is employed, it yields expenditures and the timing of them. Many times the numerical output is also a basis of a budget process. The detail and sophistication of the budget varies with the complexity of the project and the sophistication of the parent company’s internal processes.
It is worthwhile to review the penalty of improperly scoping the numbers. To list a few:
- Missed market window opportunity. Insufficient budgets means improper product development funding or market launch efforts.
- Shoddy technology (not proved or finished). The time and human effort to properly develop technology and test it adequately is somewhat tragic if not realized. It may indeed be a novel or innovative idea, but its improper gestation time for development can compromise its effective space in commercialization. Not only are opportunities missed, but recovery is expensive in terms of overtime and premium delivery rates.
- Staff burnout due to underfunding. Early stage teams tend to be understaffed and the demands on their precious resource of time are overburdened. Driven by inadequate budgets and timelines, it’s fully understood. But the impact on the effectiveness of the delivery is negative. Shortcuts are taken and people simply leave due to the stress. If unrealistic planning and investments are the cause, it becomes one more reason to ensure proper planning and budgets.
- Improper sales/marketing support in place. With the overall scope and speed of the Internet and its phenomenal ability to transmit ideas and products around the world, the commitment to finding new and appropriate channels requires new skills and perspectives. If that requirement alone weren’t important, the ability to recast (change) and adapt ideas moves at the same lightning speed. I recently went to a dealership to shop for a new car. When I asked the salesman for a written brochure, he said they don’t print those anymore and that I should look at the company web page. Old marketing budgets will no longer serve as a benchmark for going forward.
- Simple overall project failure. Even with the most innovative and adaptive thinking about new projects, there is still a potential element of failure. Many times there are external events such as governmental regulation changes and new technologies of products that present unforeseen obstacles. New descriptors of successful projects include words such as “nimble,” “adaptive,” and even “learning” organizations.
In common, the budget formats allow an expression of timing. This is particularly important when funding long lead items such as capital equipment or new physical plant expenditures. Breaking out and committing to long lead items prevents the havoc of scrambling for resources late in the project. Certain project planning tools have the capability to sort out those times automatically. Compounding this is the inevitable overtime labor charges, FedEx premium delivery fees, and vendor penalties. Not to mention the ill will and missed market opportunity windows that come with all this.
Budgeting
In a recent Google search of the word “budget,” I received over 11 million hits. There are many uses of budgets and formats, as well as numbers of suppliers and vendors supporting them. I have been a fan of budget formats that are a) created for a particular use such as commercialization projects and b) that are easily transportable to the overall financial instruments utilized by the parent organization. This is accomplished by adapting common categories (buckets) and adaptation rules. In the end the use of numerical tools must integrate into the overall financial structure. To see this, let’s first look at the income statement shown in Figure 8-2.
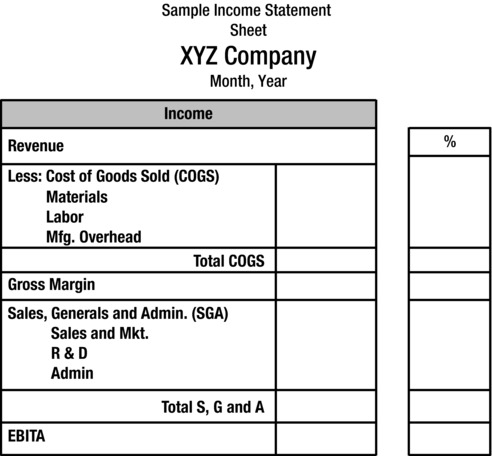
Figure 8-2. Sample income statement
The income statement (I/S) is a compilation of the revenue that is generated and can be generated by a proposed project. It then applies the expenses to be charged against it. Those expenses are delineated in two categories of fixed and variable elements. The statement is a quantification of the breakeven graphic presented earlier in the text. The graphic is a quantified version that shows us where the profitability of the project lies. It is sometimes called the profit and loss statement. If it’s done in the context of the rules and format of the overall cooperate entity, it allows easy transport to the overall financial documents later.
It can also be projected into future time periods. The accountants refer to these forward-looking projections as Pro Forma documents. The term is derived from the Latin “as a matter of form” or “for the sake of form.” As a projection it is not held to the accounting standards (Generally Accepted Accounting Practices—GAAP) and thus may not include certain recurring and exceptional (restructuring) charges. It does, however, provide us with insight as to how the project will fare in the future. It is also a useful tool to compare this project to others through certain ratio analyses. We’ll look at those later. Let’s first drill down into the document itself.
Revenue is the financial capture of events that are sold to others. In the transaction of selling, there is a simple exchange of products and services for financial “consideration.” Consideration is a collective term that refers to cash, cash equivalents, or promise such as credit allowances. The process of selling is controlled by the Uniform Commercial Code (UCC) and presents the opportunity for revenue “recognition” at the time of the sale. That last part of revenue recognition is a bit tricky and focuses on long-term leases or long-term payment plans. The challenging part is usually distorted by other considerations like tax liabilities or offsetting payments obligations.
In the category of revenue there is another source of capture called “passive” revenue. It is the recognition of sources that are not predicated on a selling transaction. Examples include rental income and patent royalties. In common, all sources combined (called the total revenue) offer a basis for a powerful comparison to other companies and projects. In ratio analysis, the revenue becomes the denominator at 100% so that R&D, for example, can be presented as a percentage of sales. This allows one to compare different accounting periods and organizations. It becomes the basis for monitoring trends over time. This is particularly important in tracking a project’s progress toward commercialization. In many comparisons, it is as simple as adding a column of ratios as the percentage of sales on the income statement.
A traditional income statement starts with a presentation of the variable costs of the operation. They are referred to as the cost of goods sold (COGS). Within this category are three conventional buckets. They are Materials, Labor, and Manufacturing Overhead.
If you drill down into the first of these, you see the challenges to management appear. In small volumes, unit material costs are generally higher. Purchasing a part at quantities of 10 to 100 is less efficient than purchasing it in thousands. Labor offers analogous savings as automation and robotics enter the picture.
As the total cost of goods is subtracted from the total revenue, it defines a term called Gross Margin (GM). It is a first measure of the manufacturing efficiency of the company or project under consideration. It allows one to compare competitive projects and see any relative measures of improvement in existing ones.
It also opens up an option of being increasingly utilized. It is the possibility of outsourcing production to others and offshore. We all know of the trend to make goods in the Far East. What triggers this is the inability to compete in gross margins or manufacturing efficiency. This concept reaches into service industries. There we see increasing trends in accounting, software development, and medical record processing being outsourced to India and other places in the world where the labor rate is lower.
Some Are “Fixed”
As we saw in the breakeven analysis, the next category of costs delineated in the Income Statement are fixed costs. They are captured in the accountants called the Sales, General, and Administrative (S, G, and A). These arcane accounting terms embrace the areas of Sales, Marketing, Research and Development (Engineering), and Administrative areas such as Human Resources, Accounting, and Legal. A robust gross margin allows for increased amounts of SGA expenditures. Two major areas are in focus as they benefit future activities.
First are the sales and marketing areas. The value of a significant marketing expenditure allows a project to benefit from advertising, trade show exposure, and adequate support literature. In 1971, Gillette, the personal goods manufacturer located near Boston, announced a relativity new shaving concept and product in its Trac II razor. In design it appeared to be backward from the traditional double-edged technology. It suffered low acceptance. Gillette ran a two-page advertisement in Life magazine in December of 1971 with only incremental results. In a somewhat bold marketing move, they decided to do a mail campaign giving potential consumers a free razor handle and two blades. The results were immediate; today Gillette’s lines of personal products are considered the standard. Adequate marketing funding reserves were sufficient to turn a somewhat soft market response into a positive outcome.
Having adequate sales effort certainly follows. In a telling article entitled “The New Science of Sales Force Productivity,” published in the Harvard Business Review,1 Dianne Ledingham, Mark Kovac, and Heidi Locke Simon of Bain and Co. dispelled certain myths about sales force productivity. The first was that simply adding more sales representatives was not effective. Also, they found that relying on superstars (referred to as “rainmakers”) was not as effective as methodically utilizing a broad range of skills. They demonstrated in five-year sale productivity model that consistently improving the sales force productivity yielded a measure called Sales per Rep productivity of $4.1 million sales per rep, versus a $3.2. That increase was 17% better than a peer group competitor. Measuring ratios against competitors is common practice. It is called “comp” (short for comparable) analysis and considered effective. This is certainly true of more common ratios like sales per revenue, which can also be compared to public companies where the data is easily accessible.
Analogous arguments can be made for R&D expenditures. In earlier times, corporate R&D was characterized by large basic research facilities such as RCA’s Sarnoff Labs, Bell Labs, Homer labs (Bethlehem Steel), and Ford-Philco. R&D had a very tangible presence. I suspect that the commercial advantage of basic technology was less fruitful than anticipated. In addition, government expenditures in university-based basic research continued.
Development continued. Certain industries such as biotech, materials, and semiconductors, for example still pursue a mixture of research and development because of the nature of their business. All of this combines to reward internal commercialization activity for future financial opportunities. One aspect of these trends is that commercial opportunities will become shorter in vision and probably result in more collaborative opportunities and more applied technology. Commercial opportunities will change in that they must prove themselves positive cash generators sooner. The ability to sustain long-term risk has diminished.
There is a broad category, called “other” fixed costs, that indirectly affects this discussion. It is the other administrative costs. They include accounting, legal, utilities, insurance, and so on. The indirect aspect is that they are always under scrutiny to be kept lower. With the breakeven analysis in mind, it becomes apparent that, if fixed costs are lowered, the potential for earlier profits encourages more commercial activity. With this in mind, we now look at results in financial terms.
When all the fixed and variable costs/expenses are charged to the revenue of the income statement, the remainder is referred to as the “operating income.”
Expenses that are variable change with respect to the manufacturing of a product or services. With each unit made, there is a charge for material and labor utilized in manufacturing. The same holds true for services where professional service hours might be substituted for materials and labor. Finally there is overhead charge for the sources and utilities utilized.
The more formal descriptor utilized by accountants for operating income is Earnings Before Interest, Taxes, and Amortization (EBITA). The term recognizes all the elements that come from producing and selling products and services. It allows one to compare projects and companies. The passive components of interest, amortization, and tax obligations are then subtracted from the EBITA to yield the net income for the organization. Included are the tax obligations, net interest, and depreciation.
These passive (non-operating) components of expense can be significant and might be as much as 10% of the stated revenue. Some elements of EBITA are quite strategic. One example is tax obligations. Certain expenses and investments can be sheltered by offsetting tax incentives. R&D tax credits can be applied against R&D expenditures and even be carried forward to future accounting periods. This incentive may sway a parent organization to make that investment. Similar arguments might be made for job creation and even location incentives. Loss carry-forward formulas may even allow tolerance for slower profit growth considerations. The influence and impact of these tax incentives can be significant and this can be factored into the decision processes. These considerations rarely drive the commercialization processes with same intensity and priority as innovation, market share, and growth, which is the way it should be!
Another aspect of the EBITA to net income calculations are loans and the interest expenses they carry. It is seductive to consider the non-dilutive aspect of loans, but the obligations they carry are counter to the operational instincts of most business decisions. To some, like me, debt obligations are an anathema of sound financial decisions. They exist beyond the use of the money and the interest remains fixed on the books. Given that bias, loans can extend a given corporation’s reach into new products, services, and markets.
As with so many business decisions, a balance is required. The implications of balance sheet ratios may finally dictate debt considerations. Many times the amount of debt an organization can incur is dictated by the lending sources such as banks. It takes the form of restrictive covenants that may allow the lender to call the loan if it’s not met. Ratios such current ratios of assets to liabilities are used frequently. If a balance sheet does not indicate a strong enough equity position to absorb debt, these ratios can be adversely affected. It is referred to as the liquidation potential of the firm. Lenders are not in the position to absorb the risk of a project or a company’s future. Risk investments are the role of the equity. Stock offerings are common alternative vehicles to raise the capital needed to fund new projects. That calculation is based on the premise that there will be sufficient future increases in earnings and resultant increases in perceived value proposition to warrant them.
Within this space, before net income, is a place for “other” passive considerations. An increasingly visible one is the impact of regulatory incentives and obligations. The long litany of government interventions such as EPA, SEC, OHSA, and IRS were once not considered material. Today, their magnitude alone dictates that they be given both visibility and strategic considerations. The sum of these items is subtracted from EBITA and results in negative differences in net income.
In a sense, net income is the final arbitrator of the effectiveness of the corporate operating entity. Successful new commercial activity contributes to this and to its growth. Outside evaluation of the corporations rely on this number when the critical ratio of its stock price is compared to its earning on price per share/earnings per share calculation. This is particularly true of companies whose stock shares (equity) are sold in public arenas such as the NY Stock Exchange (or equivalent).
Modeling This
So far the dialogue about the numbers focuses on the importance of each of the financial components and how they relate to the project. The number-link performance (both anticipated and realized) to the corporate environment and numerical attributes of the world of opportunity that the project addresses. Yet, it is known that most projects fail because of lack of cash. In the search for tools that allow us to better predict outcomes, we look at the financial models of the proposed projects.
In my early days of teaching entrepreneurship at WPI, I developed a multilevel model that has proven useful in the analysis of both funded projects and in the classroom. The model mimics the breakeven model cited previously and estimates the balance sheet capital to present first order estimates of the capital required to fund a project.
The model acknowledges the ambiguity of underlying assumptions and offers a process to avoid their implied variability through a series of controlled steps. Delineating the controlling assumptions serves to isolate them for analysis and allows the opportunity to dynamically update them as information quality increases. It also offers a dialogue tool to assimilate multiple inputs of expensive items such as labor manloading and analysis. The model is shown as Figure 8-3.
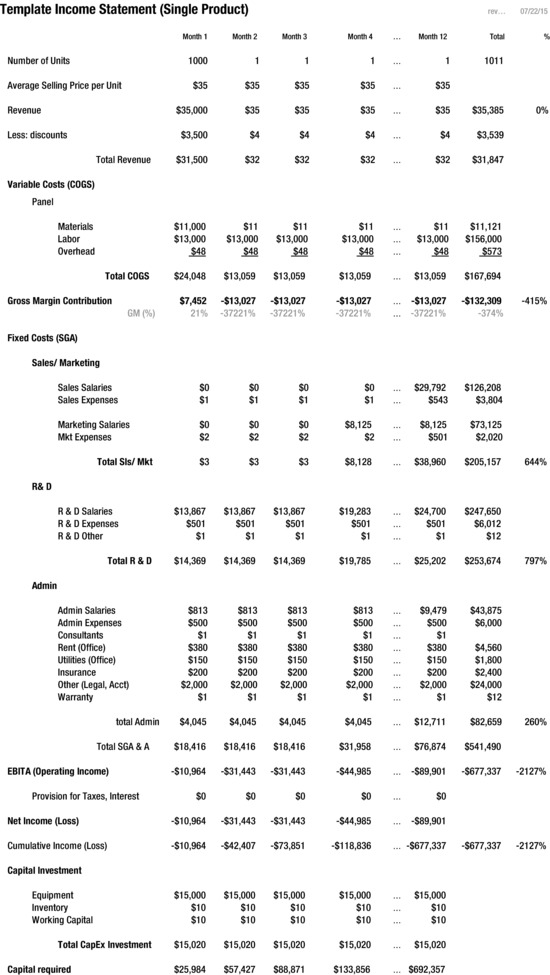
Figure 8-3. Income statement template
![]() Note To download a copy of the income statement template, go to www.apress.com/9781430263524 and click on the source code tab.
Note To download a copy of the income statement template, go to www.apress.com/9781430263524 and click on the source code tab.
In the planning stage of a project, there is significant uncertainty and variability in the supporting numbers. Professional salaries jump out quickly because of their magnitude.
An approach used in this model, for example, would be to look at a given functional salary line in a supporting manloading per month. This would reveal the anticipated timing of hiring plans. A look-up table of salaries and benefits could then be applied as a multiplier to the results of the loading schedule (Figure 8-4). This enables a constructive conclusion about the magnitude of salary expense (an assumption), without the concern of how well the individual cells were loaded with the distribution of the numbers.

Figure 8-4. Manloading and salary look-up table
It shows the bottom-line implications immediately. Utilizing formula relationships does this. The clarity of a salary look-up table allows dialogue about the overall salary more effectively than the mechanics of the model’s distribution. As the model and its projections mature, the accuracy of the data increases and the overall predictive effectiveness of the model follows.
![]() Note To download a copy of the manloading and salary look-up table, go to www.apress.com/9781430263524 and click on the source code tab.
Note To download a copy of the manloading and salary look-up table, go to www.apress.com/9781430263524 and click on the source code tab.
The Outside View
There are multiple views of the numbers from outside the organization worth noting. Beyond the operational governmental agencies like the FDA, FAA, and others that control elements of quality, safety, and the delivery of project activity, there are several that focus on the numbers and their consequences. The first and most invasive one is the Internal Revenue Service (IRS). This Federal agency reports to the Department of Treasury and thus has cabinet level visibility. The IRS has the responsibility to collect taxes and administer the Internal Revenue Code. The Code contains the operating definitions of tax collection that allows the tax process to work. The dimensions of the Code are not trivial and are estimated to be 70,000 pages in length. The agency collects multiple forms of tax revenue and controls corporate taxes, individual taxes, employment taxes gift and estate taxes, and so on. It also administers the tax collection process and the myriad forms utilized by the agency. Since the Code even goes down to the level of codifying what is the definition of an employee, for example, care must be taken in implementing the Code’s provisions. Although it can be done by individuals, it is best left to the domain of specialists and accountants.
Another dominant force on the structure of numbers on a commercial project is the Securities and Exchange Commission (SEC). The focus of the SEC is defining the securities and ownership of large public companies. It also sets the stage for how these securities will be administered. The SEC has three broad mandates. They include the protection of investors, maintaining orderly equity markets, and facilitating capital formation. They accomplish these mandates by an elaborate system of public reporting characterized by corporate annual reports. These are a structured reporting system prepared on an annual (and in some cases quarterly) basis.
The SEC also administers the regulations of the Sarbanes-Oxley and Dodd-Frank bills, which help establish the boundaries of the governance function of the board of directors. Finally, the SEC helps define the structure of equity investment in companies. Here is the basis for a discussion about the equity structure early stage companies. Some issues deal with passive or pass-through provisions of taxes, depreciation, and other expenses that can reduce an investor’s personal tax obligation.
Finally, there is a placeholder for local government regulations. These deal mostly with filings and the number of investors allowed for tax and structural reasons. These provisions are administered on a state-by-state basis.
Summing Up
This “journey” into numbers and accounting serves to show the important impact they have on commercial activities. They reveal an organization’s capacity to embark on new projects as well as the operating income effects of the development and implementation of new products and services. Beyond the metrics of performance, they also can be used to compare organizations and industry standards.
Every element of the parent organization’s numbers is affected by a project’s financial dimensions. This is true whether it is a call on resources like cash or an influx of resources based on the project’s success.
Another dimension of the numbers analysis comes from recognition of where the company is in its lifecycle. Most of analysis of a project’s metrics and their impact on the parent organization in an early stage entity can be performed on computer spreadsheet such as Microsoft’s Excel product. Basic reporting and its repetitive transactions might be well executed on a store-bought “shrink wrap” package such as Intuit’s QuickBooks or Peachtree Accounting (now called Sage 50). They are inexpensive and do not necessarily require significant experience in their execution. As the organization moves along the growth curve, additional financial responsibilities occur in terms of reporting and analysis. Various Federal and external requirements, internal reports to the Board and budget committees, and considerations of multiple currencies enter the discussion.
Finally, the reporting requirements of public entities created by the IRS, SEC, and now Sarbanes-Oxley (the law that controls the information flow for boards) enters the arena. Complex accounting programs capable of consolidating that information, such as SAP and Oracle, now enter the dialogue. They require additional sophistication to the folks who operate them. Management must be capable and sophisticated enough to absorb the information.
How new ideas are implemented becomes as important as the value of the ideas. Beyond the numbers, this is one of the reasons investors look at the team so closely. Their experience and skills represent the ability of the project to deliver its promised results. In the next chapter, we will look at various organizational models and compare the options for acquiring the talent and motivating them to achieve the goals of the project and organization.
________________
1www.HBR.org, September, 2006.