

Develop a Plan of Attack
Step Four
The fourth step in the problem-solving process is developing a plan of attack based on observations, measurements, insights, experience, testing, and any other method that has provided clues. A plan of attack gives you a framework for solving a problem that focuses on the steps you should take based on the nature of the problem. As you’ll see, it also includes assigning an advocate to critical areas.
You formulate the plan of attack after identifying the clues. Isolating the differences allows you to compare the best versus the worst conditions you observe. The description of the differences should be as detailed as possible; this detail will prevent you from unnecessarily evaluating unimportant conditions later.
At this stage, the concept sheet is very important in tying together the clues you have generated from the worksheets, process list, defect scene characteristics list, contrasts of two list, process routings, and other tools you used during problem analysis. The insights you gain from the concept sheet will directly influence your plan of attack.
For example, visual inspection of a defective weld indicated that there was not sufficient penetration of the mating components. We determined this by comparing five good and five rejected assemblies. We observed that all the job instructions were satisfactory and in effect. The welding head was not interfacing adequately with the components to be welded. Consequently, the plan of attack included comparing the samples, checking the compliance to job instructions, visually checking the process, determining which clues were relevant, and concluding what created the problem.
We adjusted the welding head, which resulted in proper weld depth penetration and assembly strength. We then compared five previously welded samples from the old weld operation with five from the new weld operation with the head repositioned. The latest welds were superior, and the change was verified.
The following paragraphs include some additional factors that may be of use when you’re defining a more complex problem and determining its cause.
![]() Note A plan of attack is the method conceived and established by the evaluators to move toward the goal of eliminating the flaw under study. It can involve direct observation, measurement, testing, or sending a component out for chemical analysis, among other things. The plan of attack is based on the complexity of the problem and the required analysis. Examples of problems you’d develop a plan of attack for: Why is the balloon bladder stretched? Why did the casting crankshaft break? Why do refractory bricks fall off of the space shuttle? Any action specified or directed that results in achieving the goal can be construed as a plan of attack. There is no single formula or template for devising a plan of attack. Each problem is different and requires different actions to arrive at a solution. What’s more, there are different routes for solving the same problem. Two different teams might have two entirely different plans of attack for eliminating a problem.
Note A plan of attack is the method conceived and established by the evaluators to move toward the goal of eliminating the flaw under study. It can involve direct observation, measurement, testing, or sending a component out for chemical analysis, among other things. The plan of attack is based on the complexity of the problem and the required analysis. Examples of problems you’d develop a plan of attack for: Why is the balloon bladder stretched? Why did the casting crankshaft break? Why do refractory bricks fall off of the space shuttle? Any action specified or directed that results in achieving the goal can be construed as a plan of attack. There is no single formula or template for devising a plan of attack. Each problem is different and requires different actions to arrive at a solution. What’s more, there are different routes for solving the same problem. Two different teams might have two entirely different plans of attack for eliminating a problem.
Say, for example, that you have a part that does not fit. Generally, the first step is to determine whether the problem originates from the geometry of the part or from the forces that act upon it. When dealing with a part that does not fit, there are three checks you can make:
Is this the part that should be installed here?
Has the part been damaged?
Is the part up to blueprint expectations?
If the problem is related to a broken or cracked part, there are also a few questions to be answered:
Was the part too weak to handle the applied force?
Was excessive force applied to acceptable parts?
Was the damage the result of an impact or pressure force failure?
Comparing major differences between parts allows you to identify the strategy—the plan of attack—that will be the most fruitful.
You can determine any major differences by physically comparing five good and five bad parts. In general, the greater the observed differences between the two groups in malformation, scratches, dimensions, or other characteristics, the easier it is to see the potential problems. Needless to say, it is important to compare the same characteristics in each group. It’s not helpful to compare a size mismatch in one group to surface chips in another.
Use the first three steps of problem resolution previously discussed to generate clues as to your next steps for your plan of attack. Observe how data collection can pinpoint the specific source of the problem. The evaluator can then assess the results to determine a path to resolution.
These points will be discussed more fully when you come to the cause correction sheet. You can compare differences between many different elements—sources, locations, lines, machines, processes, shifts, piece comparisons, locations within the piece, differences over time, and any other elements defined by the investigator.
Evaluation considerations are the criteria present in the manufacturing system because of the nature of the problem: Why is the diameter too small? Why did the lathe overheat? Why did the chemicals in the process congeal and solidify? You must reflect on these properties and evaluate possible causes that could affect the problem under study. Such causes could range from using the wrong drill, using the wrong viscosity lubrication oil, or achieving a critical temperature that has an effect on the process. The problem under study will determine which process characteristics are suspect or viable.
Evaluation is all about questioning. For example, why does a system make some acceptable parts and some that aren’t acceptable? Process parameters have a direct, indirect, or an interactive effect on the quality of the parts being made. A drill with too small a diameter, for example, will result in an undersized hole (direct effect). A lathe that is overheating due to a lack of lubricant may result in shifting the machine ways that produce a lack of machined concentricity (indirect effect). Hot-testing components with a combustible foreign material coating can result in a fire or flame flash (interaction effect). Each of these can influence the final product.
Consequently, it is necessary to verify that the obvious problem sources lead to the actual problem. Further, you must prove that corrective changes will prevent the flaw from recurring. These diverse effects influence forming, machining, and assembly operations; each can influence process variation differences. Service outputs are also affected by process variations.
Photographs of Seal Conditions
Figures 4-1 and 4-2 provide examples of evaluation considerations.
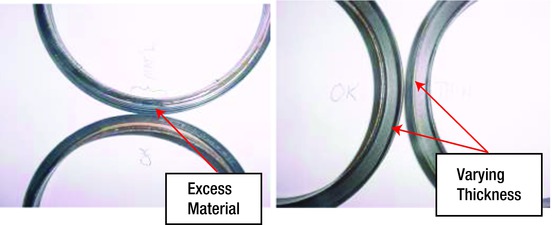
Figure 4-1. Photograph of Seal Conditions
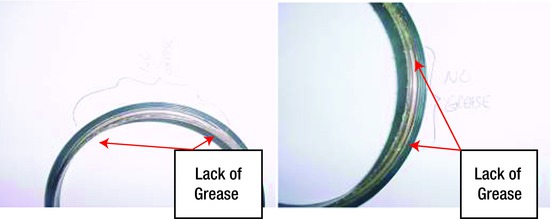
Figure 4-2. Illustration of Seal Grease Coverage
Engines were leaking oil and caused a problem requiring rework. (Rework is the process whereby a defective part or assembly is repaired or corrected to make it acceptable.) The seals were found to be the cause of the leaking oil, because the required coating of rubber wasn’t uniformly dispersed along the periphery of the seals. In addition, some seals had an inadequate amount of grease applied to the sealing surfaces, which prevented accurate sealing. Here’s what we found.
Excess material in the left photograph is shown as discoloration on the seals. A side-by-side comparison of a good seal and a bad seal showed that the material was not of the same thickness. This led to the observation that the excess material thickness was not the same during different cycles of the forming process. Nor was the leakage the same on different pattern serials.1
Since the material was of different thickness on the two parts that were made from different pattern locations and serials, there was something different in the simultaneous process (uneven coating). This indicated that the difference in the process was due to leakage while the rubber portion of the seal was being applied to the seal body.
Upon further inspection, when comparing five acceptable seals to five unacceptable seals, we found that the acceptable and unacceptable samples had dissimilar seal coatings and came from two different die cavities used in production. This is a very strong clue, because there was clear separation of the quality data (differences in the observable quality of the seals) between acceptable seals and defective ones. Some of the best pieces also had some foreign material, but not to the same extent as the worst pieces. (Always compare five of the best pieces to five of the worst pieces to see if there is a clear difference in the desired results. Comparing good vs. bad parts is a powerful diagnostic tool that will be explored in later sections.)
These clues enabled us to form a plan of attack. We were able to identify the supplier’s pattern serials that were worn and defective; we speculated that they were not providing adequate sealing. In this case, it was necessary to physically measure the wear on the patterns and to conduct tests to eliminate the adverse conditions. Once they were repaired or replaced, the pattern serials made the necessary contact to prevent rubber leakage and formed the rubber seal section to specifications.
The lack of sophisticated diagnostic equipment to provide thermal imaging, vibration analysis, or simulation should not be an insurmountable roadblock to solving problems. Simple tools—like micrometers, scales, and visual comparison ratings—are readily available to identify, isolate, test, and measure data. Of course, all the instruments and tools you use for measurement must be accurate and repeatable (calibrated).
Lack of specificity also creates a problem when fault dilemmas occur. There is too much time wasted in search of technical solutions that are applied with a “shotgun” approach. An approach that kills everything in the hopes that the cause will be permanently eliminated is inefficient and wasteful.
If a problem is not defined and agreed upon in its earliest stages, when the fault is recognized, it will create confusion in the ensuing investigation. Some people involved in problem solving will want to run useless tests that are not applicable. We had a fastener breakage problem that we solved by investigating marks appearing on the failed fasteners but not on the acceptable ones. These marks were caused by what is called a “double strike,” in which the machine cycled twice on one part. You wouldn’t believe the complicated tests and experiments proposed by people involved who had no concept of the problem. All of their proposals were impractical. The simpler the tool you use to investigate and achieve results, the faster you can obtain the solution.
One mistaken idea is that all identified variables must be adjusted even when they haven’t been proven to affect the outcome. One manufacturer suggested that there were 25 different items that caused a contamination problem because he was able to list them on a cause-and-effect diagram. Actually, as it turned out, only one condition caused the problem.
Unless problems are sufficiently defined, there is a tendency—such as in this case—to concentrate efforts on obtaining information that is not pertinent or required.
The sketch in Figure 4-3 shows a side-by-side comparison of good versus bad parts. This comparison enables you to generate acceptable clues for problem solutions. This is another example where the basic practice of conducting a visual observation and constructing a concept sheet or sketch can help you generate a plan of attack.
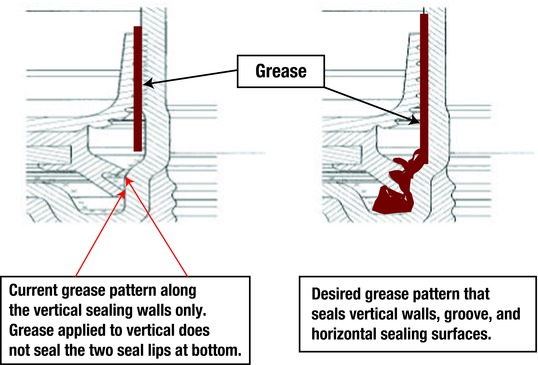
Figure 4-3. Comparison of Good and Bad Grease Application on the Seal
A seal leaking on a different engine caused line rejects and required rework. We started an investigation and the supplier was notified as part of a permanent step in the plant’s plan of attack. (You can create these permanent steps over time by recognizing steps that are present in repetitive problems—like supplier involvement in creating problems—that you encounter.)
In this case, we observed foreign material on the seals and differences in the amount of grease present on each seal. Most seals from the five acceptable samples had more grease than the five leaking seal samples. The sketches in Figure 4-3 show the undesirable and desirable grease coatings. They were important clues. We created the sketch as part of the plan of attack in order to define the condition for all those concerned. We directed the supplier to observe the conditions at his packing facility as another step in the plan of attack, and he identified and eliminated the source of the foreign material. That’s why notifying the supplier should always be included in your plan of attack.
Comparing the good and bad results should also be included in any plan of attack. Although each problem will have different clues and requirements, you should follow each of the steps previously discussed and incorporate them into your plan of attack. In addition to the differences in the amount of foreign material that was present on the seals from the different cavities, there was also a significant difference in the amount of grease applied to the seals before assembly.
One of the conditions, grease coating, was found to be statistically significant, and it was not included on the cause-and-effect diagram (not shown). Another suspect was contamination, which was caused by the pattern mismatch in the vulcanization process and resulted in a defective material flow called “bleeding.” We decided to rate and compare the amount of contamination on the individual samples in order to gain a picture of the length and severity of the bleeding. We also measured the grease coating for acceptable or inadequate presence.
Figure 4-4 shows a plot of four quadrants, each experiencing acceptable or unacceptable grease application and the degree of contamination. The foreign material, FM, prevented flush sealing and allowed a potential leak path to exist due to an imperfect grease seal in the part interface area. Figure 4-4 shows this interaction.
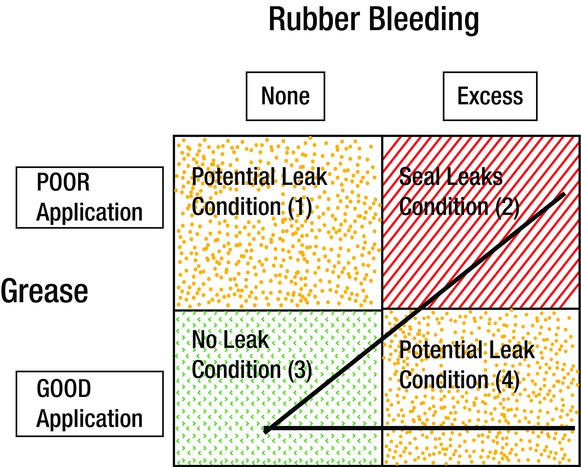
Figure 4-4. Interaction Diagram (Real Seal Air Test Leak)
This illustration is a simple way to visually represent the leaking seal problem condition. It consists of comparing results from two distinct variables—grease presence and the amount of rubber bleeding. It shows the following information in visual form:
When there is no rubber bleeding on the seal, and it has a poor grease application, the seal could potentially leak.
When there is excess bleeding and poor grease application, the seal leaks.
When there is no bleeding and good grease application, there is no leak.
When there is no rubber bleeding on the seal, and a poor grease application, the seal could potentially leak.
There is a potential to leak when no bleeding is present.
There is a potential to leak when grease application is acceptable.
Leaks occur mainly when there is excess bleeding material and a poor grease application.
It should be clear now that you can use simple tools effectively to develop a plan of attack. Each of the previous steps discussed can be a specified step in the plan of attack. The way you attempt to generate clues—observing the job and checking the systems being used, comparing the good and bad samples, taking measurements, collecting data, constructing the concept sheets, creating sketches, and performing checks—should be included in a plan of attack with the individual problem requirements.
This section also introduced the concept of interaction, which is depicted in Figure 4-4 to illustrate a model that can be used with simple data to glean understanding of more difficult problems. For a full explanation and examples of what constitutes an interaction, please refer to Appendix B: Interaction Explained. The presence of interactive effects can also be studied and added to the plan of attack if it is appropriate to the problem.
Acceptable and Unacceptable Thrust Bearings
Your comparisons should contain at least five good and five bad examples of each condition, and they should be grouped side by side. (However, because of space limitations, only three are shown here.) Can you see in Figure 4-5 anything that might cause a machine jam?
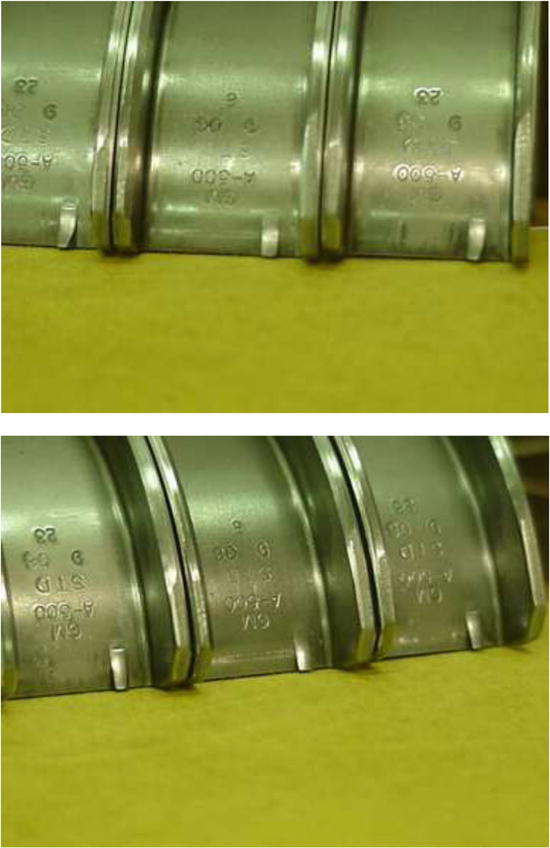
Figure 4-5. Photographs of the Same Three Thrust Bearings Taken from Different Angles
One good and two bad parts are shown here. When you compare parts side by side, it’s easier to spot any differences. Two of the thrust bearings caused jams on the engine assembly line. Sometimes the quickest way to solve production problems is to collect a sample of the parts that are having difficulty and compare them to parts from a previous shipment or a previous trouble-free production run. As with any evaluation, compare the most acceptable samples to the most unacceptable samples available.
Don’t assume that a single sample can accurately show all the conditions. Using a single data point, no matter how clear it seems, will result in poor results unless it can be statistically defined and tested.
For example, team members might look at a single sample and have unbridled confidence about its relationship to the problem. In some cases, the data point may appear to be rational. In most cases, it will be proven to be groundless. Unfortunately, the one data point does not include any variability of the performance range of the population from which it came.
Generally this opinion is based on assumption and not on fact.
You can eliminate most uncertainty by comparing at least five samples of good and bad parts. The collection, analysis, and presentation of relevant information are keys to effective problem solving. You must identify relevant variables in order to allow efficient information gathering. (The basis for the choice of five good and five bad samples is explained in Appendix E.)
Now that you’ve pondered the evaluation considerations, it is time to consider the means for collecting data.
Let’s go back to the thrust bearings. As mentioned, your comparison should contain at least five good and five bad samples of each condition, and they should be grouped by condition. Can you see anything that is different among the tabs in Figures 4-6 and 4-7 that would cause a machine jam? Some tabs have an excessive bend and a ding mark.
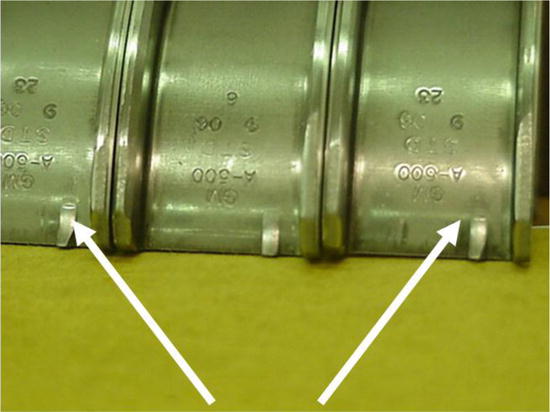
Figure 4-6. Dings in the Tabs Are Signs of Misalignment or Excess Penetration
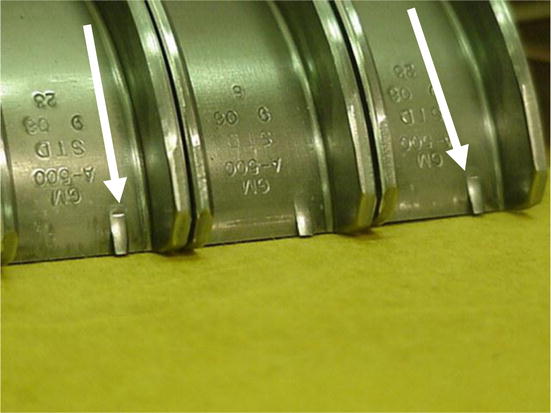
Figure 4-7. The Excess Penetration Caused Interference in the Assembly
DON’T JUMP TO CONCLUSIONS
Imagine two investigators discussing a problem. The first one says that a new intake manifold casting has unacceptable porosity, and he thinks that it is caused by the people pouring the metal. The second person says they should determine the location of the unacceptable porosity.
The first investigator says that this must be the old problem that happened months ago. The solution then was to remove the skimming bars from the area where the iron is poured. So in his view, that’s what they should do now. (Damp skimming bars were used in the past, which allowed moisture to be induced into the castings, thereby creating the porosity.)
He was correct that this condition was rectified in the past using this solution. However, it was not the cause of the problem this time. An inspection of the castings that were being run for the first time with a new pattern revealed an insufficient boss area that prevented continual liquid flow to the interior parts of the casting until they had solidified.
Jumping to a conclusion and a solution based on a sample of one is intolerable. It is always necessary to define the problem and its potential as the relative cause before applying solutions.
Here’s where the plan of attack proves its value. It is a dependent process that focuses on the steps to be taken by the investigator depending upon the problem requirements. It can prevent a shotgun approach, where much time is wasted in search of irrelevant information. It helps you to avoid investigating unimportant areas or accepting conclusions based on a single sample.
Prevention
We would be negligent if we failed to discuss the concept of prevention within the plan of attack. The best way to solve quality problems is to prevent them before their inception. This section provides plans for the following (Figures 4-8 through 4-17):
These example plans that follow are preliminary and can aid in solving manufacturing quality problems. You can revise them to fit each manufacturer’s plan and adjust them as you find additional areas of concern.
There is one key way to build prevention into a manufacturing system: assign responsibility. Responsibilities that are not assigned are generally ignored. Take for example the job of ensuring that the supplier will not send any mixed parts that could jam the customer’s automatic material handling systems. The supervisor is responsible for instructing and checking his employees and their operations to ensure that the parts are not mixed. He might also be involved in checking a list of items in his area to discover and correct mixed parts and other manufacturing problems. But the supervisor’s oversight should not be the only way to avoid the mixed-part problem.
The supervisor may suffer the brunt of mixed-part complaints, but the system may be set up to invite the problem. That’s why, when managers are making plans for production, or recognizing corrections, they must ask questions:
Who acts as the advocate in a quality-planning meeting or the (DFMEA or PFMEA ) design and production failure mode analysis meetings?
Who ensures that the job instructions are acceptable?
Who ensures that effective employee training has been completed?
Who ensures that checks are being made?
Who should establish some method of recording and capturing significant items and practices that can prevent mixed parts from happening a second time for the same reason as the first?
As you can see, there should be many people making sure mixed parts do not get shipped. Allocating an advocate assigns responsibility and allows for accountability.
One of the ways to instill a prevention culture is to design simple plans that point out some of the faults that may occur during the manufacturing operation. The design doesn’t have to be difficult or intricate. Rather, it is possible to create a system that recognizes certain failures or quality issues and provides questions that you can use to direct quality corrective actions as they are needed.
This may appear to be more difficult than it really is. If your facility does not currently have established quality planning meetings, plans, procedures, assigned responsibilities, training, actions, and follow-ups, you can use the following examples to create an initial system.
But first, let’s briefly review what each of these items requires. Quality planning meetings. These meetings are called to address the quality considerations for the product or service being established. It could consist of discussions of design considerations (DFMEA), process considerations (PFMEA),2 means to control the process (the control plan),3 and procedures (safety, mixed parts, labels, missing operations, foreign material, coatings, part identification, spills and sequestrations, communications, supplier compliance, and notifications).
Control Plan. The individual plan or outline discussed in the quality-planning meeting; it ensures that the subject of interest (such as a spill) is discussed.
Procedures. There are about seven basic steps contained in each plan that follows. Each of the steps requires an assignee who will be responsible for ensuring that that step has been completed before the process begins.
Responsibility. In addition, an alternate should be appointed and trained, so that there is continuity if the main assignee is absent due to promotion, illness, transfer, or layoff. This is necessary because when no one is assigned to a task, it isn’t accomplished. If everyone is assigned to that same task, it’s still likely to be ignored because no one is responsible for it. Each of the steps for each plan can be assigned to one or more individuals. However, it’s more efficient when there is one assigned, responsible individual for each of the plans and there is one assigned, responsible alternate for that entire plan.
Training. After ensuring that the part or process is discussed in the DFMEA and PFMEA and the procedures have been established, it’s time to conduct the training. If you’ve conducted each of these considerations satisfactorily, you can check the operation to see if it is operating properly. If the process has not been in compliance with each of the preceding steps, the personnel in the quality-planning meeting must reevaluate each question or decision point that is not in compliance to what is desired. (This can be visualized as shown by the “no” arrow designations as shown in Figures 4-8).
Actions and follow-up. Once you complete all the preliminary steps, you can start the process. You should check the start-up process and the ensuing operations at many levels, and on a randomized basis at specified intervals. If any deviation is observed, the assignee (or alternate) should respond and provide actions to prevent recurrence.
All corrective actions should be initiated as quickly as possible and should be incorporated into the DFMEA, the PFMEA, the control plan, the procedures, and the checks. This helps ensure that, once the problems are corrected, they won’t recur.
There are ten preliminary plans provided in the ensuing pages. Each plan represents a simple method that you can use to improve the current process if one is not available at your facility.
There are other considerations that you can develop later, as required. These additions include:
First piece inspections
Routing parts
Returned materials handling
Container cleanliness
Tagging suspect materials
Others to be determined
Each of the following ten plans is self-explanatory. If you ask the question and attain a positive answer, continue to the next lower level. When you arrive at a “no” answer, you must take immediate corrective actions.
Now that you have the basic concept, additional plans can be developed. Each time you find a deviation in the system, correct it and adjust the process to improve the internal or outgoing quality level.
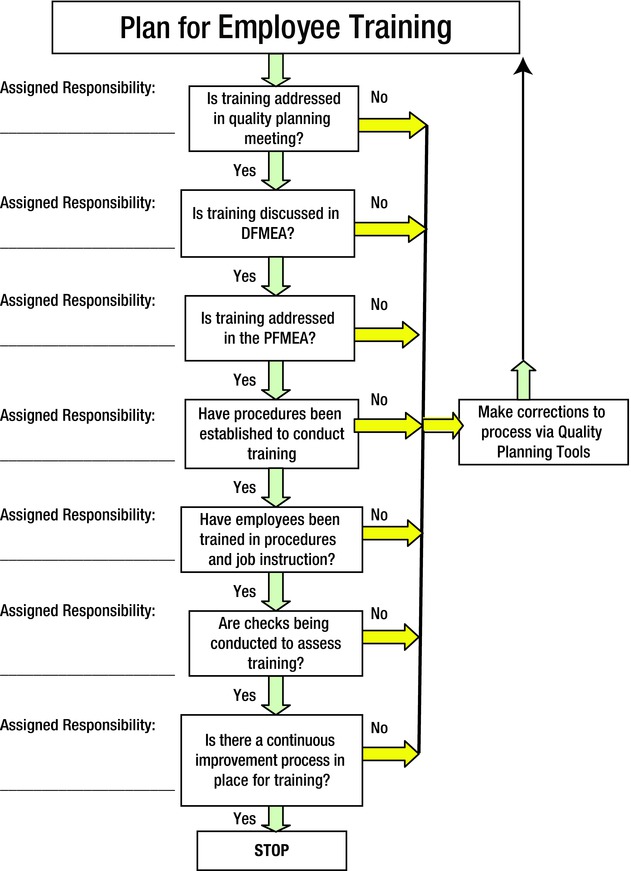
Figure 4-8. Plan for Employee Training
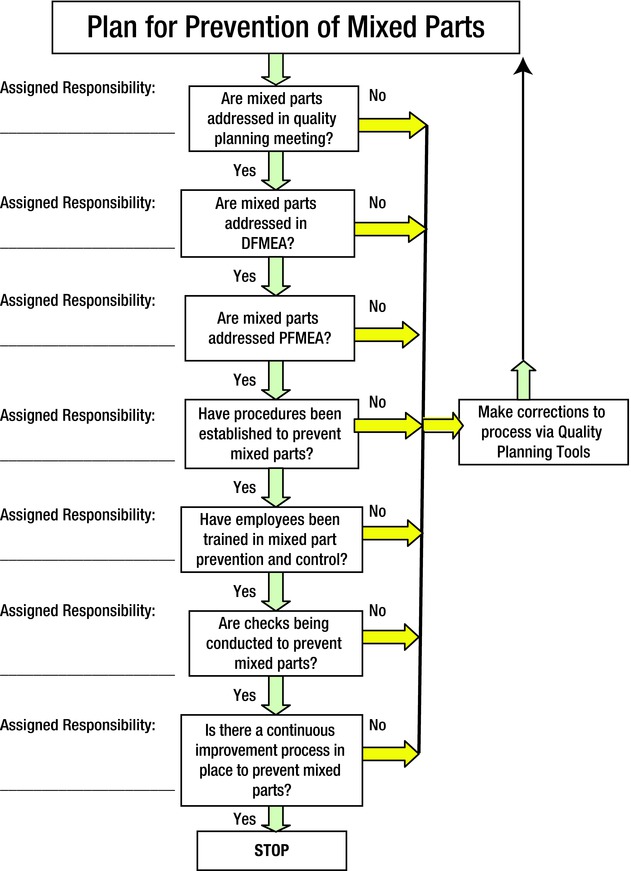
Figure 4-9. Plan for Prevention of Mixed Parts
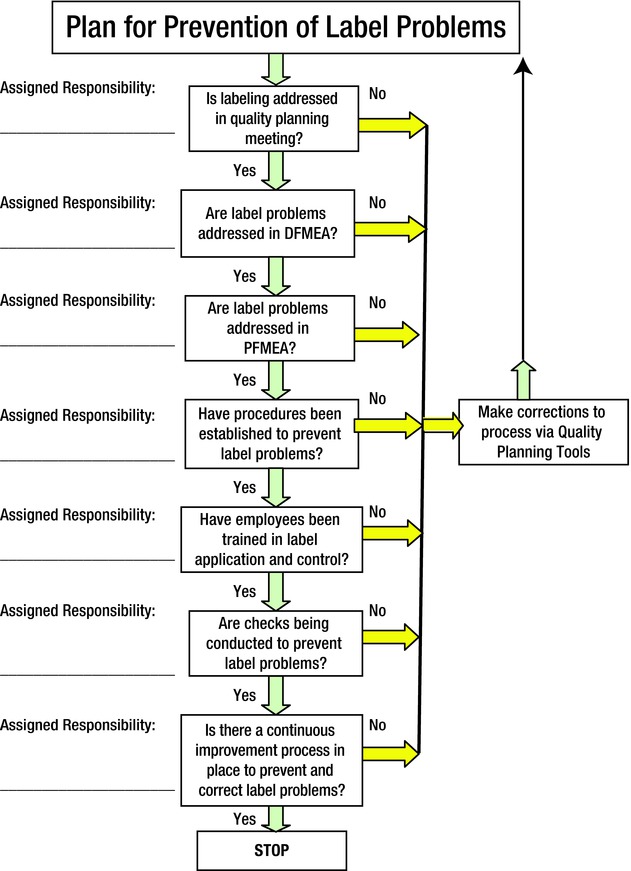
Figure 4-10. Plan for Prevention of Label Problems
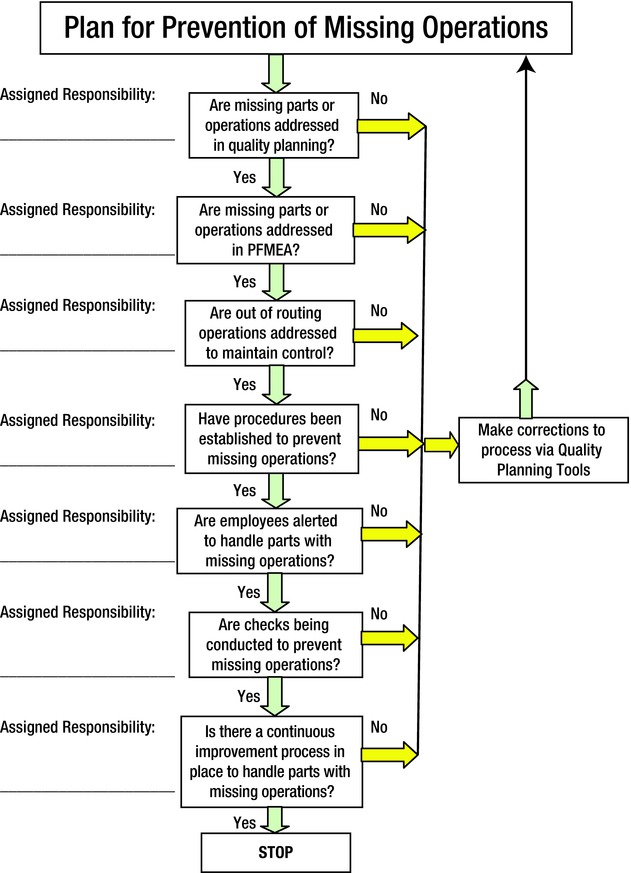
Figure 4-11. Plan for Prevention of Missing Operations
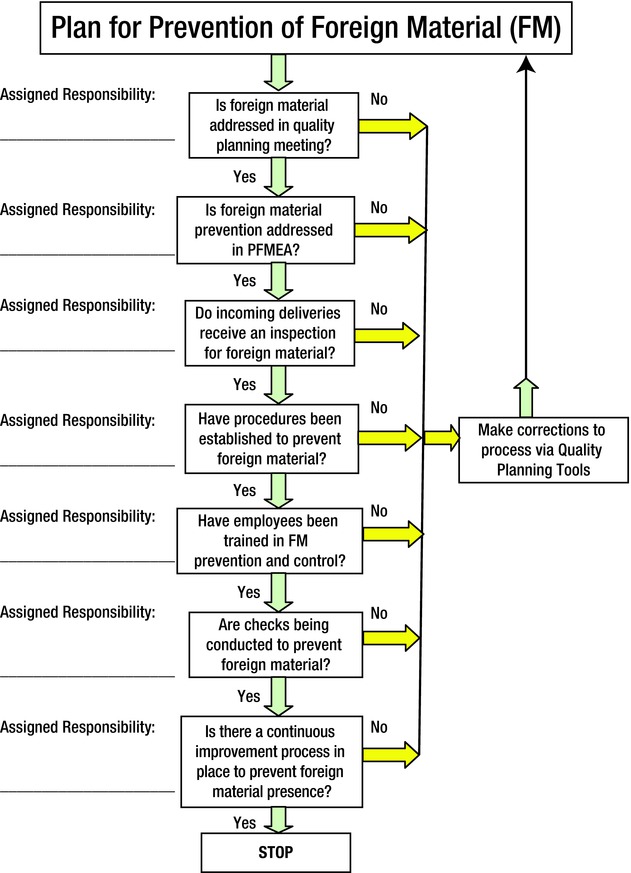
Figure 4-12. Plan for Prevention of Foreign Material
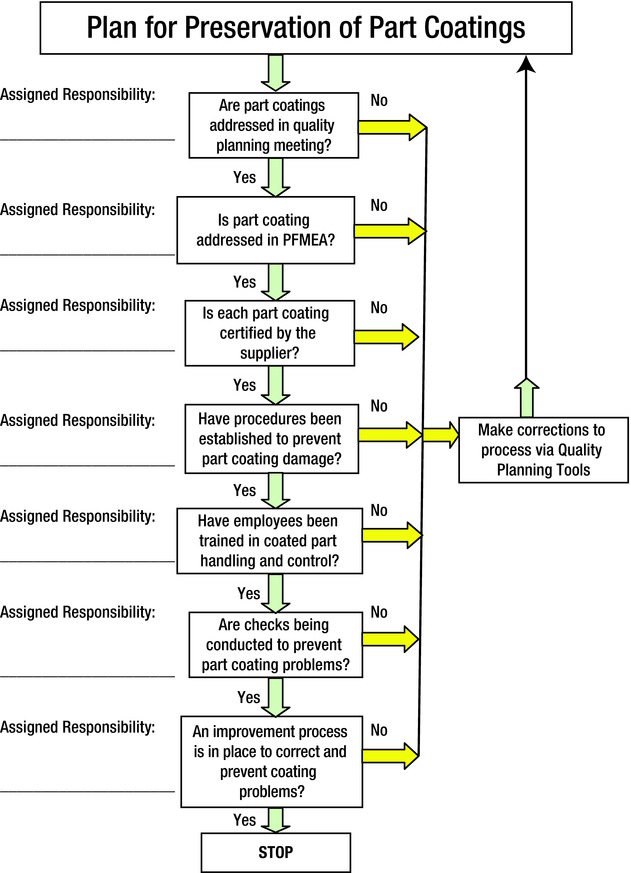
Figure 4-13. Plan for Preservation of Part Coatings
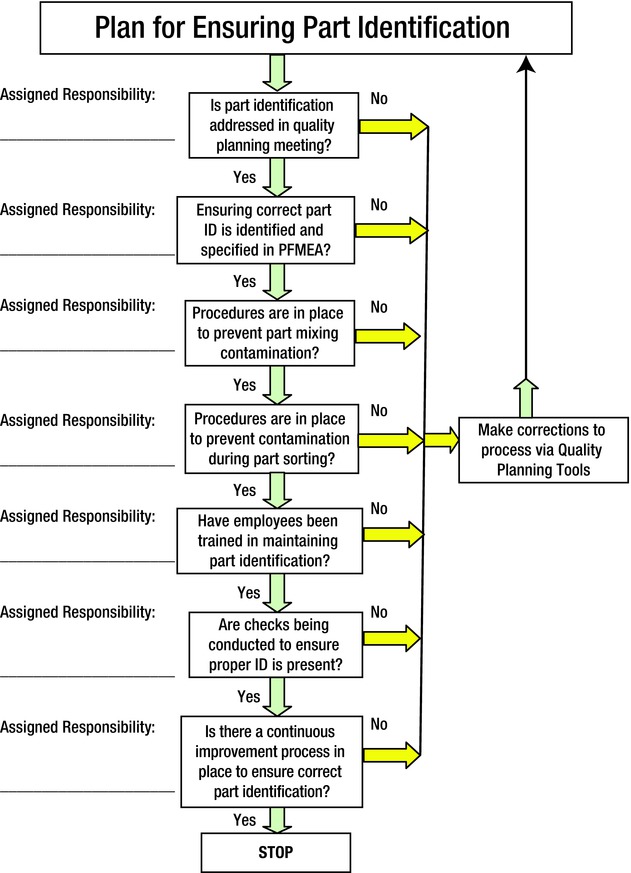
Figure 4-14. Plan for Ensuring Part Identification
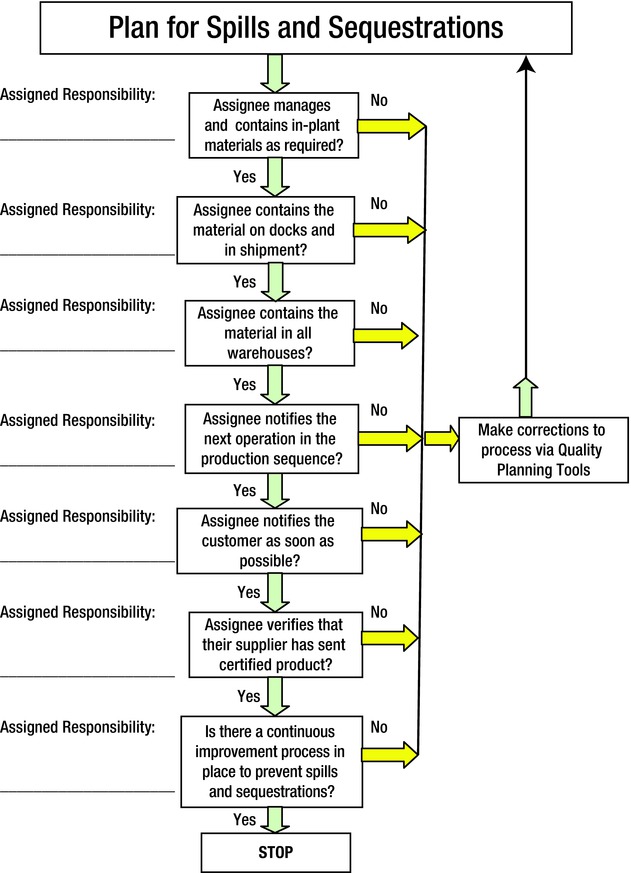
Figure 4-15. Plan for Spills and Sequestrations
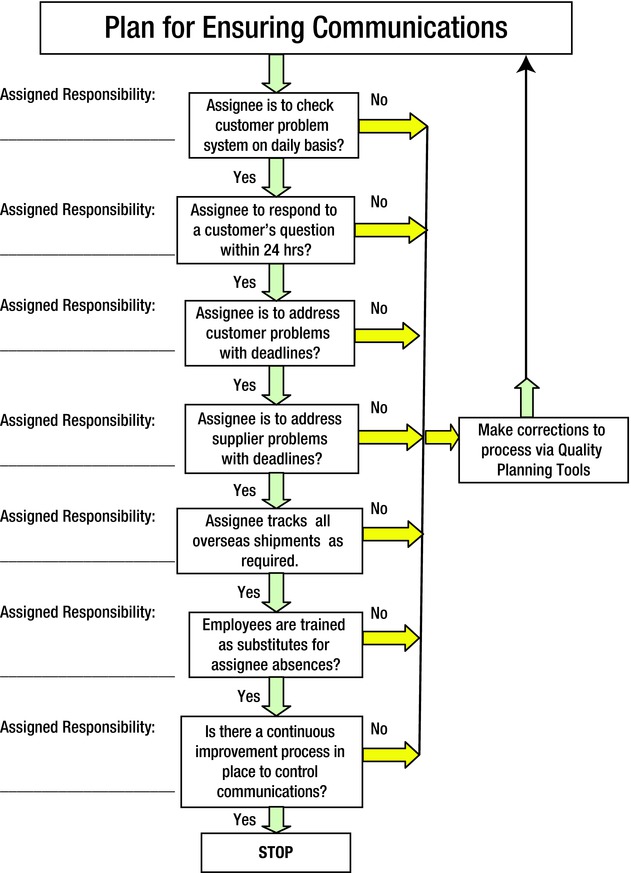
Figure 4-16. Plan for Ensuring Communications
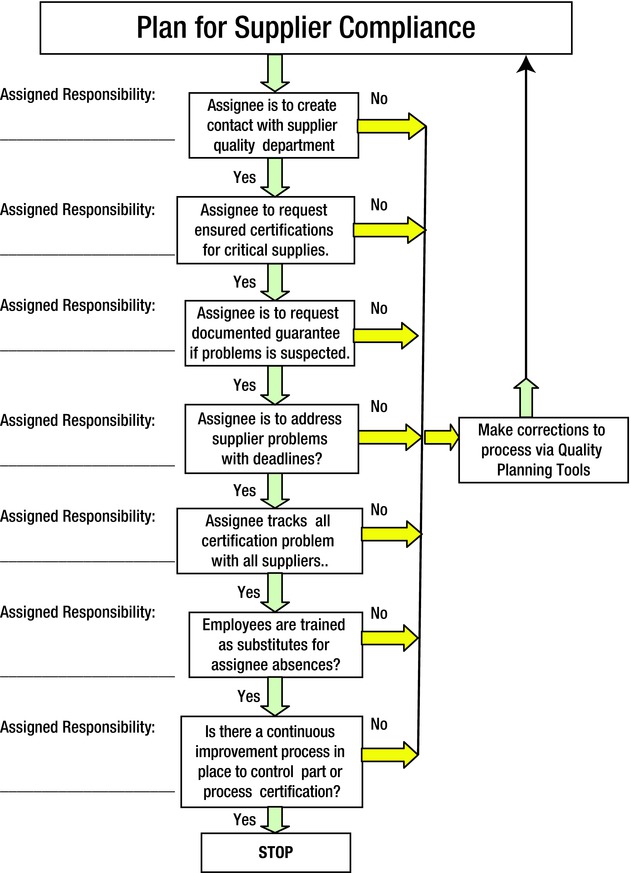
Figure 4-17. Plan for Supplier Compliance
Summary
The individual steps explained thus far can be used as the plan of attack for most problems. In addition, you must take the clues from these methods and determine whether you need to take additional steps in the plan of attack to further analyze the problem conditions. Not to be overlooked is the prevention aspect—this includes assigning responsibility to individuals to ensure responses to detrimental conditions.
The next chapters move to the topic of data collection. You’ll determine the means for identifying and collecting data and deciding whether it is significant. We provide examples for generating visual rating systems when measurements cannot be made. As you’ll see, you can apply these rating systems to most projects to help determine whether there is a real difference between the good and bad parts.
1A pattern serial is one of several identical forms located on a master pattern. A pattern is usually metal and provides a definite form or impression when forced into a retaining medium like moist sand. Some patterns contain six or more serials, which may be identical and are intended to all form identical cavities in the forming medium.
2DFMEA stands for Design Failure Mode and Effects Analysis; PFMEA stands for Process Failure Mode and Effects Analysis. These are meetings attended by the respective department representatives to determine a plan to control the quality aspects of any problems. They differ for design, manufacturing, service, and other individual topics that are relative to the product.
3The control plan explains the specific method to organize and manage a manufacturing or service process. It also establishes checks and balances to ensure that problem conditions will have controls established and in place to prevent their occurrence. Procedures and job instructions establish consistent work practices and are generally written instructions on how to accomplish tasks required to perform the work.