
Define Fault Characteristics
Step Two
The second step in the problem-solving process is defining the fault characteristics. Some call it defect identification. Visual observation may provide clues that can point to conditions related to the problem, and can aid in generating clues. Dents on a bearing, for example, may signify that the forming process is askew.
Say, for example, that you produced a plastic component that is not up to blueprint specifications. You must discover and eliminate the cause of the discrepancy, which you’ll do by generating clues. As you’ll see, you can do this by comparing good and defective parts in order to identify relative characteristics. Characteristics that exist on most of the defective parts but not on the acceptable parts provide insight into the cause of the problem.
Defects: Clues to a Problem’s Cause
This step is often overlooked when a problem develops. That is not unusual, because as you see often in your own life, many people rush to propose a solution without understanding the problem. An undefined problem can often lead to chaos. You could end up spending days discussing a problem only to discover that your investigators or team members have an entirely different interpretation of the problem. That’s why it’s important to agree on a problem’s definition first.
A manager leading an investigation can expedite solutions by focusing the team with a thorough understanding of the flaw,1 the severity of the problem, and the location and the incidence of the fault.
It is necessary to achieve consensus from almost the entire team as to the true identity of a fault before analyzing a problem. This is not dissimilar from the methods used by some surgeons to identify the knee of the patient requiring replacement before starting a knee replacement operation. Some patients are savvy and prevent a mistake by writing “the other knee” on the good knee with a marking pen before their knee replacement operation. (Sad but true.) But the point is that everyone on the surgical team must agree on the knee that needs the operation (and be correct!).
![]() Note Once you agree on the problem definition, you can start your search for clues, and that search starts with methods to reveal defects. You may even acquire enough clues to uncover a problem’s cause.
Note Once you agree on the problem definition, you can start your search for clues, and that search starts with methods to reveal defects. You may even acquire enough clues to uncover a problem’s cause.
How do you arrive at a consensus? To begin with, you and your team can collect conditional and quantifiable data. Conditional data provides an overall macroscopic view of the problem. When you visually compare good and defective samples that have varying rates of gas holes—known as porosity—you’re collecting conditional data. Conditional data can also be the difference in a part path going through the manufacturing process. Quantifiable data, on the other hand, describes the number of defects or measurement values obtained.
Conditional data includes identifiers related to the process, such as manpower, suppliers, materials, methods, environment, and other conditions that may have contributed to the defect. These data spell out the process parameters that should be considered as part of the problem’s cause prior to collecting quantifiable data. Table 2-1 lists important items when assessing conditional data.
Table 2-1. Process Definition Table
Condition |
Response |
|---|---|
Is there only one flow path for the process? |
|
Is this operation done at only one station? |
|
Are multiple flow paths present and identified? |
|
Is the machining done on only one machine? |
|
Is the assembly operation done at only one station? |
|
Are variable gauges used to collect data? |
|
Are all parts tested on one test machine? |
|
Is there more than one serial or die used? |
|
Do all dies or serials have the same problem? |
|
Do other plants have problems with the same parts? |
|
Is the percentage defective generally consistent? |
|
Does the part meet the blueprint specification? |
|
Are the blueprint specifications ambiguous? |
|
Has the raw material been changed in last three months? |
|
Has the process been changed in last three months? |
|
Was there major equipment repair in last three months? |
|
Could this part be an off-line repair? |
|
Was a repaired part returned to the correct operation? |
|
Are reworked parts identified and kept separate? |
|
Can the failure be made on purpose? |
|
Have five good and five bad parts been captured? |
|
Have five good and five bad parts been measured? |
|
Is there clear separation of part differences? |
|
Other: Has the vendor certified his material and process? |
You must verify the information in Table 2-1; it must not be taken for granted. For example, the question, “Has the vendor certified his material and process?” can be revealing. Invariably, at least 50% of strength problems, for example, are due to unauthorized supplier changes to materials, processes, routing, handling, or reworking items without approval. As you’ll read in a later chapter, for example, a supplier attempting to cut costs substituted red iron oxide for black iron oxide without permission—and with disastrous results.
Quantifiable data is more microscopic than conditional data. It provides actual measurements of the defect, the incidence of its presence, or some other means of assessment that allows you to make an evaluative comparison. If you can accurately describe and quantify the condition, you are more likely to understand the circumstances that generated it. And, if you can measure it, you can develop controls to maximize or minimize its presence. For example, a comparison of five good and five defective parts can be used to generate ratings or scores that can be used to determine which of two materials is better or if a process correction is acceptable.
You can use Table 2-2, which shows the “defect scene characteristics” list, to record features or traits that you observe about the defective part or process. Although this list of characteristics is not all-inclusive, it will provide a sound basis to start. Look for these characteristics during all your problem investigations.
Table 2-2. Defect Scene Characteristics: Are Any of These Present on the Parts?
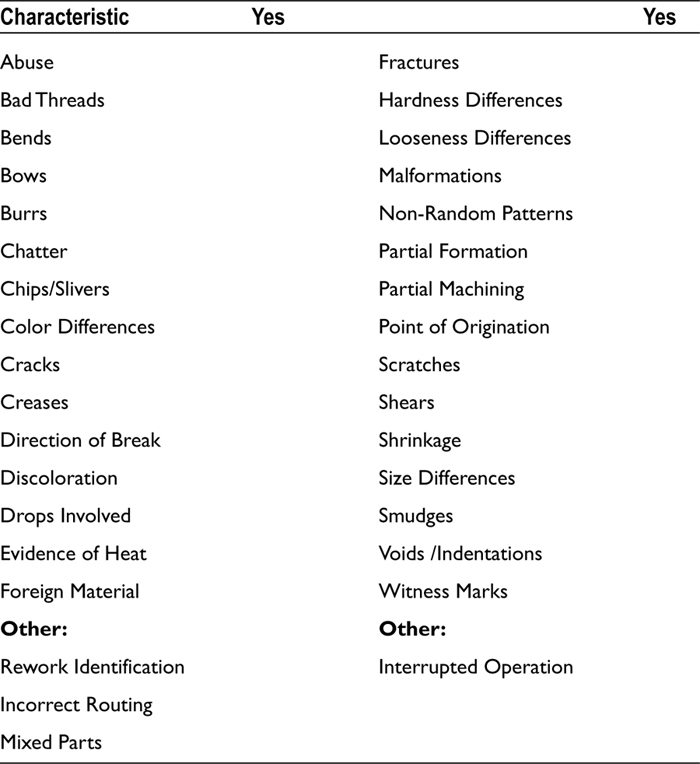
The defect scene characteristics list captures some of the data available from the defect scene. Conditions identified from the defective part or service should be noted for evaluation. Abuse, breaks, scratches, witness or layout marks, discoloration, and other identifiers are contained on the list and provide the basis for asking follow-up questions. For example:
What caused a mark?
Where is the defect located?
Does the defect have the same location on all the parts?
Was it caused by an incident?
Was the mark/damage due to the part shape or use?
Was a steady force involved?
Was an impact involved?
Was a mating part marked or damaged?
From which direction was the force applied?
Was damage due to excessive force or was the part weak?
Do all the defective parts contain the same mark?
Do all defective parts contain identical marks of the same intensity?
Do all defective parts have similar marks in the same relative area?
Do good parts have similar marks as the defective parts?
Where does the break/mark begin?
Do other similar machines create the same mark?
If the operation was interrupted, could the mark be a result?
Could foreign material be included in the process causing the mark?
The defect scene characteristics list has been extremely useful in providing clues during difficult problem analysis. For example, recognizing that foam replicas of crankshafts used in a molding operation were warped led to the information that the supplier had changed the coating drying process without approval. This change caused the crankshafts to warp after the castings were poured.
It’s equally important that you compare the good and defective parts. Record their differences using the “contrasts of two or more” list, as shown in Table 2-3.
Table 2-3. Contrasts of Two or More Table: Where Do You Find Similarities or Differences?
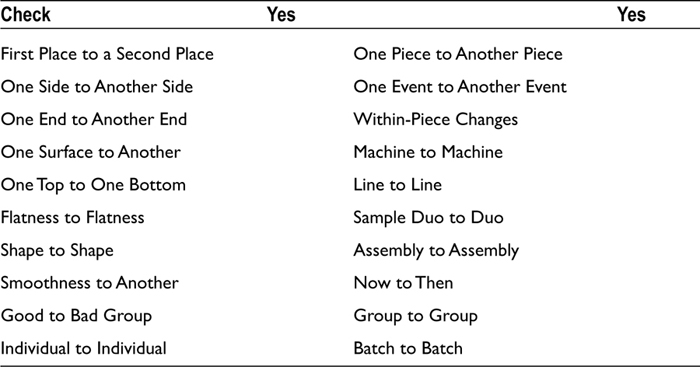
Each clue provides a piece of the puzzle and leads to additional areas of inquiry. Not only do the conditions describe clues or defects, they also can be used to determine what caused the defects in the first place. You can compare individuals, duos,2 characteristics, locations, patterns, statuses, or any other differences, as indicated in the list.
The “contrasts of two” exercise provides a way for you to focus on differences that you might not otherwise discern. If all of the defective parts have a characteristic that all of the good parts lack, you have enhanced the discovery process. For example, does the top half have more damage than the bottom half on each group? Or, if there are six different pattern serials, do they all have the same degree of the flaw in the same area?
Most anything can be compared in a contrast of two comparison. Two different machining flow paths could produce different dimensions, for example, as described in Appendix A. Or you might discover that a plate is warped when you’re conducting a piece-to-piece comparison or a comparison for flatness. In most cases, the investigator will compare one sample to another and observe any differences.
Summary
After reading this chapter, you should understand better how to capture and record relevant clues in the form of defects. It may be necessary to refocus your investigative team on the clues you generate. If it’s not guided, the team will stray in a hunt for the solution.
Hopefully, the information in this chapter has provided you with an understanding of the methods that you can use to identify clues and defects. Defects might be the result of a faulty product or a failing process.
Remember, problem definition merely points to the failure of a component or system to meet requirements. In some cases, it may be an identified defect or characteristic of a component that makes it unacceptable. These defects are often clues to the problem’s cause, which is the underlying condition that allows or creates the adverse or undesirable result.
Characteristics, such as defects, are the traits, qualities, or properties that are observable on a product or subject. You can evaluate them by comparing two or more parts, by looking at the variability generated by process differences, or by observing the defects visually. Scratches, gaps, discoloration, and so on, can be descriptive indicators of causal relationships that affect the problem. Other characteristics may be present but not significant. For example, some scuffing or mars may be an acceptable part of creating certain products.
The next chapter deals with a tool called a concept diagram, which is an important tool for finding and listing additional clues.
1A flaw is a fault having any characteristic that detracts from the intended purpose of a process or service.
2A duo is a matched comparison of two samples.