
Generate Clues
An Interlude
The previous chapters addressed five of the eight steps in the problem-solving process. These and the remaining steps give you a macro view of industrial problem solving.
This chapter further explains those thoughts but addresses the subject in a micro setting. This is necessary, because some problems require more than a simple comparison to solve them. Some problems require an in-depth look. For example, a visual review of a part might not be enough to determine the problem unless you observe it with a magnifying glass or a microscope. This is moving from a macro view to a micro view. In a similar situation, it might be necessary to measure and define specific dimensions or even to use unconventional methods to identify, correct, and prevent manufacturing problems.
Hopefully, the text and examples in this chapter will provide you with insights. Clues, as you will see, can be generated in many different ways. There are many types of charts that you can use to elicit valuable clues, for example. The Pareto chart, the run chart, and the concentration diagram are three common but important tools. These lie outside the scope of this book, however, and you can find them well described elsewhere.
Generating clues for problem-solving success hinges upon the six actions discussed earlier in the book. I have employed these actions over and over again in solving quality problems while working with over 200 suppliers of an automotive engine manufacturer. They provide micro information in the form of text and additional tools. These six action items are:
Define the specific problem and condition (the characteristics or physical appearance of the subject) thoroughly. Evaluate problems by the dollar loss that they generate.
Verify that the process is operating as intended and specified. Conduct a review of the control plan and the operating procedures to ensure that the process is being managed as desired.
Observe the operation for detrimental or ruinous condi-tions. Determine if there is anything specific causing distress in the process.
Develop a check system/assessment plan for recognized manufacturing control items. Decide what is important to control so that the process is acceptable.
Conduct checks with more than one layer of inspection.
React to the conditions that must be corrected or improved. Add corrective actions to the audit list if any item or condition is found that has or will have a negative effect on the process or the product.
Defining the problem is the most critical step, and the methods of discovery are explained in Appendixes A, B, C, D, and E. The initial steps to be followed were presented in the problem corrective action worksheet, shown in Chapter 1 and the problem definition sheet shown in Chapter 2.
Sometimes it is necessary to review and reinforce important concepts, even when they’ve been previously discussed. Let’s make certain that you have a good understanding of the terms “problem definition” and “problem cause” before we move on.
An illustration with examples is probably the best way to overcome any misunderstanding. Three examples come ideally to mind. The three problem definitions are as follows:
The floor after mopping is not clean.
The machined surface is not smooth.
The crankshafts are warped.
Note that each of these indicates an unacceptable condition. The problem definition does not attempt to specify the cause of the problem because the cause is unknown. And it generally cannot be known at this point.
Allow me the liberty of specifying the causes of the three conditions to illustrate the examples and to simplify the definitions. The cause of the first problem may have been the use of an oil-contaminated mop to clean the floor. The cause of the surface not being smooth on the machined part may have been due to incorrect speeds and feeds on the machine. The cause of the warped crankshafts may have been due to an improper foam coating and drying opera-tion that resulted in a warped, lost foam pattern that allowed the iron to take the same warped shape.
Defining the problem is an initial step that should have the most critical recognized adverse effect highlighted. Attempt to make this as micro as possible. The floor was dirty after mopping. Or simply, the floor was still dirty. This focus defines the problem in a micro format.
Charts and data are useful tools in acquiring clues to solutions. Some measurable and observable differences that can yield clues are variations in:
Seal OD (outside diameter) measurement
Fuel pipe air test leak measurements
Tubing circularity measurements
Head exhaust chamber leaks
Machining energy applied
Concentricity of crankshaft main bearings
Part fits/configurations
Part finishes
Other process variables and variations
Porosity or void presence
Crack location and severity
Almost any other characteristic imaginable
![]() Note Charts can consist of simple graphs, sketches, or depictions that describe information available from a visual investigation. For example, a graph that shows two lines of the same product, one of which has twice the number of rejects, is a simple but telling display. A chart can simply be displaying the difference in percentage or frequency of something. Don’t limit yourself, therefore, to preconceptions of what constitutes a “chart.”
Note Charts can consist of simple graphs, sketches, or depictions that describe information available from a visual investigation. For example, a graph that shows two lines of the same product, one of which has twice the number of rejects, is a simple but telling display. A chart can simply be displaying the difference in percentage or frequency of something. Don’t limit yourself, therefore, to preconceptions of what constitutes a “chart.”
Verify the process to ensure that it is operating as intended. Are all of the process specifications in accord? Observe and record—if they’re available and applicable—speeds, feeds, transfers, temperatures, chemistries, heat treat, static controls, internal materials, supplier certified materials, and so on. You must check anything that has been established to initiate and approve the original production run and updated improvements.
Observe the process for detrimental or ruinous conditions. They should not be observable while walking from the start to the end of the process. If they are, you have some clues that will help you solve the problem. Sometimes these conditions are what cause component breakage or damage at transfer or separation points. They can include uneven oven temperatures, open window drafts, roof leaks, jams at transfer points, power interruptions, double machine strikes, and so on.
What does a detrimental condition look like? Say a damper manufacturer provided a product that was displayed under the hood of customized vehicles at car shows. The car owners desired a product with a perfect appearance that did not have blemishes. One day, scuff marks suddenly started appearing on some of the dampers. Observing the assembly line process allowed us to recognize the cause of the detrimental condition—units that remained on the line during lunchtime with the power rollers running were scuffed up.
The power rollers were coated to prevent scuffing but the trapping of the damper at a transfer point directly above the power rollers allowed the scuffing to occur. Again, the problem definition was that the “dampers were marred.” The cause of the problem was that the parts were trapped over the power rollers.
Develop an assessment plan to capture variables that should be controlled in the process. We will discuss check plans1 in later chapters to show how they should be designed and conducted. All important items required to certify the process should be included from the control plan,2 the DFMEA, and the PFMEA. This includes specific tools, methods, paths, operations, procedures, and so on.
An assessment plan should include provisions that protect against allowing detrimental conditions to recur after they are once recognized. In the example of the scuffed dampers, an audit of the production line might include an assessment plan with instructions to shut down the powered rollers at line stops such as breaks and lunch. They might also audit to ensure that there were no trapping areas where the dampers would be contained above a set of moving power rollers. Someone conducting the assessment plan would verify that these system precautions and controls were satisfactory to prevent damper damage.
Conduct Checks
Conduct assessment checks with more than one person responsible for the accuracy. This can include an assembler, quality representative, supervisor, or manager. Review results help you control the established procedures and required steps. Multiple or staged checks—two or more—provide verifiable results that are representative of the conditions. (The rationale for this requirement is explained in a later section.)
The assessment checks survey the operation for situations that allow detrimental conditions to occur. They also verify that the established controls and operating procedures are being practiced. The reason it’s best to have more than one person perform these tests is to avoid tester bias. If one observer has a blind spot to a particular condition, you still have the other tester who will likely recognize the problem, so that it can be addressed and corrected.
React to detrimental conditions as soon as they are identified. Whether it requires revisions in job instructions, tool use, or better inspection processes, it is important that once a problem is identified, a corrective action be developed and enacted for all future audits so that the condition doesn’t recur.
Depending on the type of fault encountered, the methods outlined here, along with these six steps, will help you develop a list of clues to solve most problems. Additional steps are provided in an example, which will help to focus the clues and provide a solution.
Suppose that you are going to manufacture yo-yos, and you want to manufacture a toy that will work for the greatest number of customers who want to perform complex tricks.
You must first consider the functions that you expect the yo-yo to perform. It should be able to perform tricks like “sleeping,” “around the world,” “walk the dog,” and “baby in a cradle.”
The “sleeping” trick happens when the yo-yo’s central shaft, which connects the two halves, spins for more than three seconds on a fully extended string at the floor level. It does not come back to waist level until the hand controlling the yo-yo offers a slight nudge.
“Around the world” requires that the yo-yo enter a sleeping state as well, but it differs in that the yo-yo is not tossed downward to achieve the sleeping state. It is tossed from the waist area to a position above the head so that the momentum of the toss results in the yo-yo traveling a full 360-degree rotation before it is given a nudge to return to the tossing hand (see Figure 6-1).
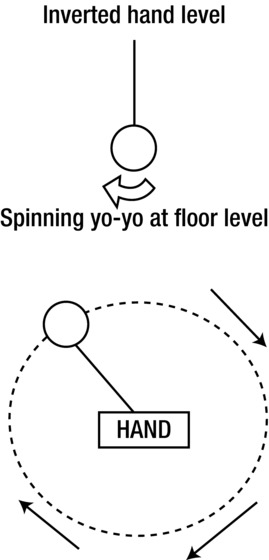
Figure 6-1. Yo-Yo Trajectory for the Around the World Trick
(The other tricks are similar in nature but involve steps that are not critical to its operation.)
You must now consider the requirements necessary to allow these conditions to exist. In order to gain experience in determining characteristics that are important to the manufacture or operation of a device, you’ll now attempt to develop the requirements for a yo-yo. Now is a good time to attempt this. Before going further, list the items and attributes that you consider necessary to allow the yo-yo to operate satisfactorily.
![]() Note This type of training is useful whenever you approach any manufacturing problem in the future. It will sensitize you to some of the important considerations for any problem. The more times that you attempt to list those characteristics that are involved in a problem, the more intuitive your attempts will become. Each experience should provide new considerations that would not be possible if the attempts to make the definitions had not been tried.
Note This type of training is useful whenever you approach any manufacturing problem in the future. It will sensitize you to some of the important considerations for any problem. The more times that you attempt to list those characteristics that are involved in a problem, the more intuitive your attempts will become. Each experience should provide new considerations that would not be possible if the attempts to make the definitions had not been tried.
Here is my list. How does it compare to yours?
The yo-yo must have adequate strength to withstand the toss.
It must have adequate mass (weight) to be tossed.
It should have adequate mass to achieve the angular velocity required to sleep.
The central spool piece must be machined smooth.
The material must be balanced.
Both sides must be chamfered to prevent string wear.
The string must have a low coefficient of friction.
The string must be strong enough to withstand the toss.
The string must have a smooth surface.
The string must not be too short or too long.
The string must not be permanently attached to the shaft.
The shaft (spool piece) must be inserted within the loop of the string to allow rotation when the unit is sleeping.
The operator should be a certain age.
The manufacturer should provide adequate instructions.
The user requires training.
Assembly must not contain sharp edges for safety.
This list is not complete. If you listed five or more considerations, you are on your way to effective problem solving. Regardless of the list you developed, be assured that your experience will increase every time you apply this technique to understanding a problem.
In reality, solving a manufacturing problem requires less analysis than what is shown here. In most cases, it’s easier to determine the cause of a flaw than it is to list all the design requirements. You observed this type of simplified analysis in the poor fusion weld concept sheet example in Chapter 3, as well as other examples on the previous pages.
Once you have identified the conditions that can potentially cause a problem, and connected them to the problem being investigated, it’s easier to recognize the conditions and address them.
Guidelines for Clue Collection
Before you start any hard data collection, you must verify that all existing controls and work procedures are in place and being followed properly. Altered work procedures can result in defects. This important step is often overlooked in the rush to solve problems. The problem definition sheet discussed in Chapter 5 provides you with a quick, cursory check of internal operations. Use it before you look in other areas.
Next, be sure all parties agree on the problem definition. Then, observation can provide clues regarding the direct effects of variables, which is sometimes all you need.
Suppose the customer desires a smooth finish on the machined product that he purchases and is dissatisfied with the current finish. The problem may be stated, “The product is not smooth.”
Unless everyone understands the problem description, you may find that some people want to focus on the fact that the part is discolored or should have a label. In some cases, it’s the lack of knowledge of a product, and in other cases, it’s the lack of knowledge of the customer’s requirements. Regardless, this miscommunication impedes progress.
Defective parts should be inspected vigorously for every clue, and not only for their characteristics and locations. You should record all pertinent identifiers, including serial number, pattern number, date of manufacture, machine path, lot number, surface appearance, finish, and any discoloration.
Once you have taken these steps, you can narrow the investigation’s range. Save only the essential variables listed in Figure 6-2. Cross out the variables that are not applicable and then scrutinize the ones that remain.
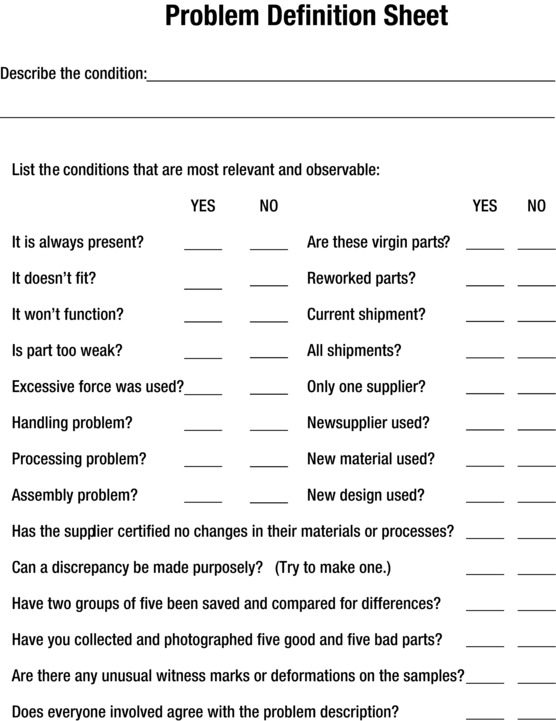
Figure 6-2. Condensed Problem Definition Sheet
The evaluator should ask and answer the following questions:
Is the fault always present at a continual level, or does a condition spike as a periodic happening? Is the flaw related to the part shape (geometry) or was some type of power present (force)? Did something go snap (incident), did it contain a flaw (fault), or is one of its attributes (trait) suspect? Is the part (strength) too weak or was excessive (force) power applied? Was any work applied or was it a static failure? Is the failure more related to machining, assembly, or design? Is the condition a cause of scrap or rework? Is visual breakage present or was it a malfunction? Was the defect the result of handling or processing? Did the assembly or a component fail? Are witness marks present, and where are they located? Does this happen on all shifts and machines the same? Has the supplier swore (certified) that the process or materials have not changed? Has supplier certified that they and their supplier(s) have made no unauthorized changes also?
Each of these considerations is key in pinpointing conditions that result in defects. You can expect your supplier(s) to provide you with pertinent information if you encounter problems that are beyond your observation.
Other things to consider: has the design changed? Is this a mechanical or supply problem? Are these virgin or reworked parts? Each of these divisions provides information and narrows the investigation required. The answer to each comparison focuses attention on a narrower view. Any remaining characteristic could provide insight to the source of the unfavorable condition.
Identify and Sequester Bad Parts
More often than you think, scrap or unacceptable parts are placed off to the side without being properly identified. These parts invariably find themselves back in the processing system and may eventually be delivered to the customer. This occurs because:
The parts were not recognized as being noncompliant.
The parts were placed back into a container while still noncompliant.
Only one of many nonconformances present was corrected.
Proper work instructions were not followed.
Checks were not conducted to ensure procedure compliance.
It is best to immediately tag, paint dot, or damage a nonconforming part in accordance with the work instructions. Hopefully, this will prevent a nonconforming part from getting to the customer. If it does end up back in the processing system, marking it will help to trace and identify it.
Moreover, you should permanently identify reworked parts for future recognition. Be sure to specify when the certified work was done. You must conduct checks to ensure that people comply with established procedures for routine and rework operations. These instructions should include adequate checks to ensure that the intent of the operation is fulfilled and that the results meet the specifications. All parts must be adequately controlled.
Parts that are lying on the floor should be considered nonconforming. They should be sequestered, identified, and sorted. Simple fasteners placed in a wrong container can cause automatic feeder jams and cause downtime at customer locations.
Sometimes, you can apply a small paint dot to a part requiring future identification. Be sure to apply a dot to an area that’s not readily visible to avoid detracting from customer satisfaction. The dot can also be used in problem-solving applications if it contains a fault. Not only can it be used by the supplier to ensure compliance, it can also be used to perform problem analysis. Paint dots can be used to indicate the following:
A rework operation has been completed
A leak check has been performed
A special operation has been performed
A previous operation component is present at the next station
All components are confirmed to be present before final packaging
A specific item is in place and is to size
If possible, the evaluator should collect five best and five worst examples of the problem. A comparison study is described later. (An explanation of the rationale used is in Appendix E.) For now, you can use these 10 samples as a basis for visual comparison. Describe the dissimilarities of the five best and the five worst. Do all the worst ones have a witness mark? Are all the best ones a certain color? Do all parts measure the same? What are the differences?
Differences between the best and the worst may be extremely small. Nevertheless, if all the acceptable parts don’t have marks and all the unacceptable parts do, these marks might be a clue to the problem. Always try to obtain samples from opposite ends of the quality distribution spectrum, as this will make the differences more apparent.
Next, if possible, attempt to replicate the failure. In so doing, you may be able to verify insufficient part strength or the use of excessive force. The technique of identifying the differences between acceptable and nonacceptable parts, processes, or actions further reduce the time you need to provide a solution. In addition, you can use paint dots if there is more than one flow path. The process must be structured so that parts that travel through different processing equipment are identified for later analysis. This is true when the operation is performed at different stations, different machines, on different gauges, or on different lines. The individual flow path or process step identification is a major clue generator.
A defect diagram can be a considerable source of information and may illustrate where a fault is most prevalent. Figure 6-3 was used to evaluate catastrophic crankshaft failures in an auto assembly plant.
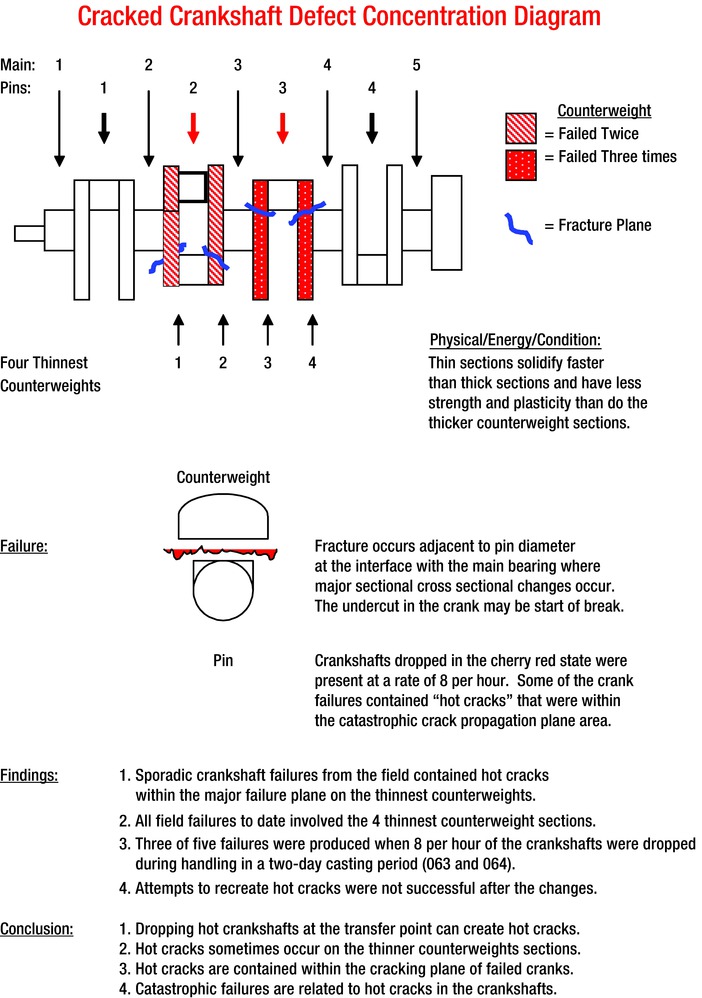
Figure 6-3. Cracked Crankshaft Defect Location
There were only six failures, but each of them was on an inside counterweight that had the thinnest sections. We further identified each failure as possessing a hot crack at the fracture. After a thorough investigation, we determined that the fractures were the result of dropping one crankshaft upon another while they were being transferred while still red hot. The mishandling of the castings allowed some to drop more than the allowed distance from a shaker to a conveyor because there were missing system conveyor baskets. Some were cracked on the ends while others were cracked on the thin-sectioned counterweights, and there was damage only to some that were dropped.
Sometimes it’s not possible to compare real-life good and flawed samples. In these cases, it is necessary to force a comparison sample. We took this approach when comparing leaking rear seals in engines that failed an air test. The relative frequency of a leak was 0.20% of the total production, which made it a difficult problem to solve. Unfortunately, all leaking seals were subject to mutilation when they were removed from the engine at the repair station. We removed samples for study. Since they were damaged upon removal, it was not possible to determine if they met the blueprint specifications after installation. They did meet the specifications before installation. However, when the faulty seals were replaced with new ones, the engines passed the air test.
As a result, we determined that there was a significant difference in the seals or in the installation method. To offset the impediments, we removed a few seals from engines that did not leak after the air test. Then we compared the good and bad seals, which generated two main clues that were instrumental in identifying the cause:
Some seals had excess rubber from the assembly operation. This was considered to be foreign material (FM).
Some seals appeared to lack grease at the seal lip surfaces.
There was clear separation of the visual data. The best seals (ones that didn’t leak) had a better distribution of grease than did the worst seals. A defect diagram is often helpful in analyzing these kinds of problems.
The concept sheet shown in Figure 6-4 illustrates effects when components are removed from the established routing for part processing. In one case, a grinding operation created an oversized pin diameter that was unacceptable. The oversized parts were sequestered and reintroduced into the system at a rough grinding station rather than at the finished grinding station, as specified on the routing. The effect of the change might seem to be inconsequential but the resulting effects were disastrous. Because the grinding wheel moved and sensed the presence of the pin, it moved into the previously machined pins still in the grinding station and caused a taper on the adjacent pin end. Unfortunately, the pin was used in an automotive engine’s piston assembly. Once it was assembled, the vibration during operation resulted in a catastrophic engine failure that stranded the motorists. Had the pin been placed into the finishing grinder, as specified in the routing, the taper would not have been created. Seemingly insignificant routing changes can therefore have a major impact and should not be overlooked.
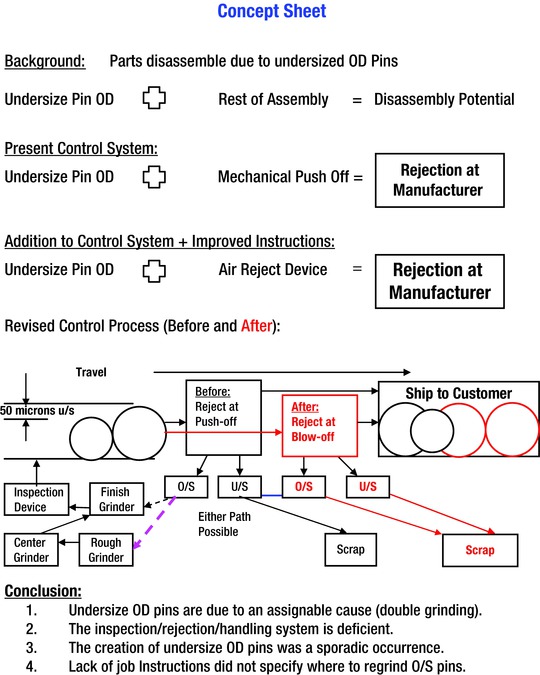
Figure 6-4. Example of Undersize Pin Concept Sheet
The sketch of the process in Figure 6-4 shows that there was an assignable cause to the engine failure problem. The “Before” path of a pin shown in black had undersize (U/S) or oversize (O/S) pins after a grinding operation, depicted on the left side of the sketch. The U/S pins were directed to the scrap bin, whereas the O/S pins were supposed to be placed into the finish grinder. However, the fault was that the oversize pins were placed back into the rough grinder rather than into the finish grinder. This caused the machine sensor to dive to a deeper level, which resulted in the tapering of the ground pin. The lack of posted consistent work instructions contributed to this problem.
The right side of the sketch shows the revised “After” path in bold; the procedures were changed so that all O/S and U/S pins are now directed to the scrap bin. A mechanical sorter was replaced with a more reliable air-actuated device to ensure nonconforming rejections.
Who would have thought that placing a pin in a wrong bin would eventually result in a catastrophic engine failure in a vehicle over 1,000 miles away? Who can estimate the amount of customer dissatisfaction or the lost dollars involved in trying to determine what caused the failure? More importantly, what can be done to prevent this event from happening again? Maintaining process controls should be a major focus, including using many level checks to ensure consistent work, and creating clear and concise job instructions.
After this problem was recognized and resolved, machine operators were trained as to the proper placement of oversize pins. One of the reasons that the problem occurred is because there were no instructions about what to do when machine operators found an oversize pin. We corrected the work instructions and control plan and retrained the operators. In addition, the quality personnel made adjustments in future DFMEA and PFMEA meetings and revised the control plan. Finally, the proper placement of undersize and oversize pins was added to the auditing check list to prevent recurrence.
Summary
This chapter provided a more micro view of the problem of generating clues. It took a deeper view, with examples of conditions that you may encounter. You can use job instructions, assessment plans, checks, audits, control plans, and other observed criteria to generate clues, as well as control an operation’s output and quality. This chapter also delved deeper into the problem description and further differentiated it from the problem’s cause.
The next chapter—Step 6—covers the use of innovative tools that you can use to solve problems.
1A check plan is an inspection of specific process variables to ensure compliance with the methods used to conduct an operation. It can be a simple audit for detrimental conditions, or a visual check to determine if the specified and authorized work is being performed. It is similar to a safety check that verifies that all employees are wearing safety glasses in designated areas. However, a check plan can contain any number of observations to be conducted by the checker.
2Again, a control plan is a set of operating instructions that the manufacturing or service operation must follow. It can specify the materials, methods, checks, inspections, identifications, tools, or environments required to perform the production or the service. Its purpose is to ensure understanding and control of the process under scrutiny.