

Use Innovative Analysis Tools
Step Seven
This chapter deals with the use of visual aids, including flowcharts, lot identification, and the evaluation of sound and broken components. It includes examples of failures and the solutions that were effective in correcting them.
The following tools enable the problem solver to focus on more easily solved problems that might not require in-depth evaluations. The innovative use of analysis tools is the seventh step of problem solving. When nothing else appears to work, these elements can allow your creativity to flourish.
The most important “analysis” tool is simply to insist that everyone involved observe the problematic process or component in question. It is not uncommon for groups to convene in a conference room or office and intensely debate the cause of a problem without having observed the existing conditions. You can’t solve problems effectively while seated in a conference room.
The following two examples lend credence to this point.
I was involved in a situation in which incorrect valve stems (see Figure 8-1) were added to the assembly line because samples were not provided or discussed. We didn’t discover the difference between the two components until well into the manufacturing cycle. This is an example of why you need a visual understanding of each problem. It’s so much easier to understand a verbal description when you’ve actually seen the faulty part or system. At the very least, you should provide samples of the part being discussed for examination. It should be mandatory that evaluative personnel and teams visit the site of the problem to understand the conditions.
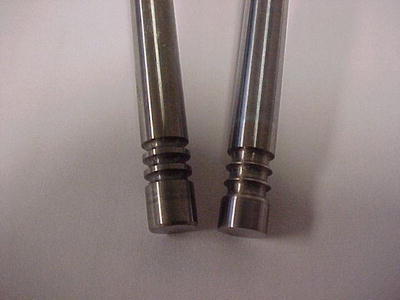
Figure 8-1. Photograph of Valve Stems; Note the Difference Between the Two
This problem with the valve stems was due to poor communications and training; a new untrained employee was helping to service the line. To prevent similar defective assemblies, we provided training and photographs of the components to the line.
Here’s another example: When assembling engines, one must submit them to a torque test after the pistons are inserted to ensure that they conform to the requirements. At some point, there was a dramatic increase in torque failures. The line stopped, because the repair station was overloaded with line rejects. The failure not only created an excess amount of engines that had to be repaired, but it also generated a substantial loss due to the manufacturing facility’s inability to sustain production.
Confusion takes over with any line stoppage. Parts are immediately taken to the metrology lab for measurement and analysis. Sample defective products are disassembled for evaluation. People capture and sequester product that is not to specifications. Attempts are made to restart the line and to capture data as the product is being manufactured. After a day or two, we discovered little slivers of foreign material underneath the assembly conveyor, but the origin of the material could not be determined.
In this case, we gathered those involved for a walk along the assembly line to observe each operation. During that walk-through, someone noticed that a change in piston rod design was allowing a piece of flashing attached to the piston to fall into the engine after the piston was installed. We discovered this clue by observing a significant accumulation of minute sliver-looking components under the piston-setting operation machinery.
Since the small chips and slivers were not present before, we determined that the new piston design or machining operation was contributing to the problem. We found that the slivers should have been addressed at the supplier location and were to be removed before they were shipped. A step in the supplier’s process was not in place when we received the first shipments. This contributed to torque test failures with the new components. The biggest clue was that the slivers were under the assembly machinery, which we noted by visual inspection. The arrows in the photograph show where the chips and slivers originated (see Figure 8-2). The old style (on the left) had square shoulders, whereas the new design (on the right) had sloped shoulders, which is where the slivers originated.
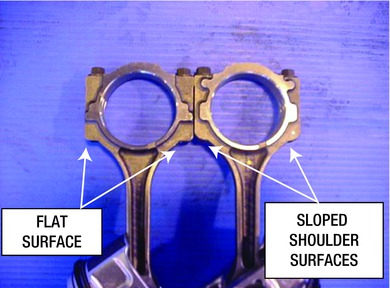
Figure 8-2. Photograph of Piston Shoulder Differences
In summary, a visual observation of the process can be very rewarding. It is a simple tool that is greatly underused by many manufacturers experiencing problems.
![]() Tip When problems arise, someone should always be assigned to view the current process and to capture samples of the items leading to the crisis.
Tip When problems arise, someone should always be assigned to view the current process and to capture samples of the items leading to the crisis.
Unfortunately, walk-throughs are not done in most instances. In my experience, whenever a major problem is found, there’s an immediate call for a meeting. Most people attempt to define the current problem in relation to their last experiences, without observing the present, applicable conditions. Nonetheless, everyone involved must be visually aware of the most recent conditions before adjourning to the conference room for problem-resolution discussions.
Figure 8-3 shows the minuteness of the sliver that was causing the torque failure problem when it was inadvertently deposited into the engine.
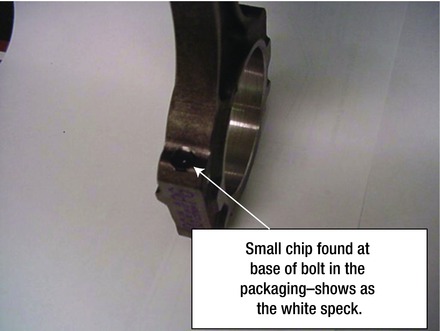
Figure 8-3. Photograph of Foreign Matter Found on the Piston
When necessary, you should plan to call your affected customers immediately to alert them of any difficulty that may affect the operation or use of the product. In this case, an unqualified design change allowed a sliver of machining particle to cling to the new components until the installation operation. At that point, a minor vibration shook them loose.
Flowcharts can be a valuable way to view how specific components are routed. They can be used to verify that the process has been designed correctly to ensure proper component flow.
In addition, they can be used in the event of quality-assurance problems that require production stops or recalls. The example I discuss shows how you can identify a recalled product, while restricting the amount of questionable product that’s currently in stock or in the customers’ possession. Doing this successfully requires planning and identification.
However, before you learn about using flowcharts, it is important to note that flowcharts depend on the correct actions of the personnel involved. Control plans must be established to ensure that quality requirements and certifications continually adhere to and comply with approved process methods. Consistent work must be unfailing or you can expect problems.
It is not uncommon to have components wander from an acceptable flow path or to become mixed with unauthorized components by accident. Consider these scenarios:
A part removed from an assembly line because it requires rework isn’t introduced back into the assembly line at the position where it was removed.
Parts not properly identified to begin with are removed from a process only to be introduced at a later station without the required electronic checks being performed.
Defective or incorrect parts are reintroduced into the system because someone picked them off of the floor.
Parts become mixed because they had not been properly tagged after a first-piece inspection.
It is important to walk the process to ensure that parts are properly handled during every step.
Whenever parts are removed from the specified routing route, they should be marked, tagged, or otherwise identified. This will help prevent them from being improperly introduced somewhere else in the system. Containers, and the parts inside them, should be identified in the same manner. You should ensure that identification is removed from the containers after they are emptied. Scrap items placed into containers should be identified and physically destroyed to prevent reuse in the production process.
Figure 8-4 shows a simplified example of the flowchart that traces the movement of parts through an assembly process. It is not the complete process, but it will give you an understanding of the concept. Design and process failure mode effect analysis, as well as control plans and job instruction preplanning, are all necessary in order to establish the routing and identification processes.
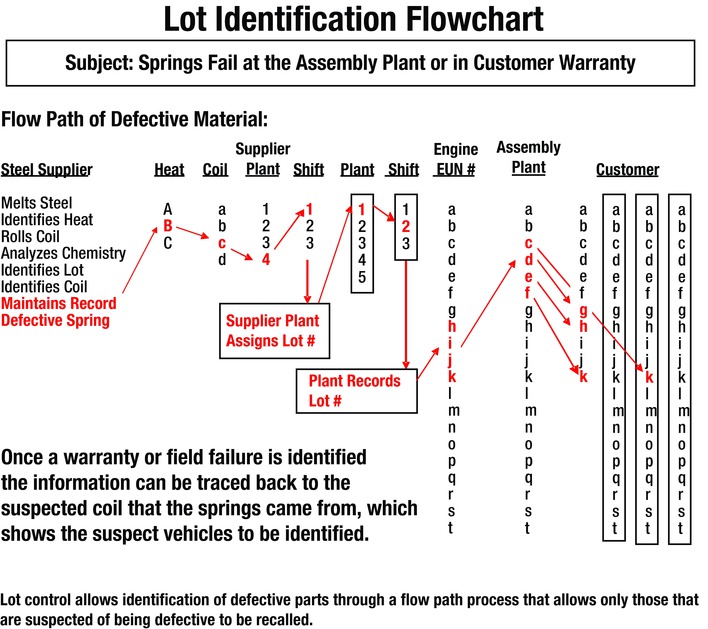
Figure 8-4. Lot Identification Flowchart
The chart shown in Figure 8-4, hypothetical and condensed, attempts to reflect the path of spring coils that will be used at an assembly plant and then be shipped to customers. The steel supplier maintains records of the heat, the metal consistency, the coil (identification of the roll produced), the plant it was produced in, and the shift on which it was produced as a minimum identification system. Then it is shipped to the manufacturing customer, who creates springs out of the rolled coils. This manufacturer also keeps track of product identifiers by recording the plant, shift, relative engine process identifications, and other important criteria that identify the process used at that plant. The engine is sent to one of many assembly plants, where it is installed into a vehicle and sent somewhere via the purchaser network, from which individuals can then purchase the vehicles.
Now suppose that after a length of time the original steel supplier realizes that a mistake had been made in their process, and that a certain batch of coils was defective and could result in a safety hazard. The supplier had the foresight to record the identifiers and the flowchart that it maintained. They identified not only the heat and the coil but also the customer to whom they had shipped the defective coil.
Notifying the engine customer alerted them to the problem, which allowed them to trace the coil through their manufacturing system and to trace it to the assembly plant to which it had been shipped.
The assembly plant, by maintaining its records well, could determine which dealer they shipped the engine to. The assembly plant and dealer would be aware of the customer to whom the vehicle had been sold. This customer would receive a recall notice based on the information captured in a flow plan.
This type of plan is not dissimilar from a flow plan that follows raw material from entry into a manufacturing plant through each operation and inspection. It can be used to ensure that parts removed from the designated flow path be reintroduced into the flow path at acceptable designated stations. The lack of a designated flow path can result in serious process problems of scrap or rework.
Unfortunately, all problems are not identified or sequestered before they affect the customer. The importance of being able to identify and trace a lot or part is extremely important in containing recall costs due to quality spills. Hence, the importance of the flowchart. Since the process flowchart can track the components from the cradle to the grave, the flowchart makes it possible to backtrack from the point of failure to the point of origin. By verifying the identification information on the defective part, recalls can be issued only to affected customers, and not to the greater customer bank.
![]() Tip Since you can use identification numbers with pattern serials, processes, components, vehicles, and customers, they can also be used to evaluate problems. Be sure to use all of the information available when you’re collecting data and to follow the identifiers back to the source of the problem.
Tip Since you can use identification numbers with pattern serials, processes, components, vehicles, and customers, they can also be used to evaluate problems. Be sure to use all of the information available when you’re collecting data and to follow the identifiers back to the source of the problem.
In addition, always attempt to identify components that pass through similar operations on any multipath system. You can do this by applying a different colored paint dot or mark. This will be of enormous value when you analyze future problems. Remember the bent connector problem that was affecting the truck assembly plant discussed in Chapter 3? Only one of the test machines was causing the problem. The plant automatically recorded which engine was being tested on which machine, and that data trail made it much easier to resolve the problem. The flow path in that case involved checking the parts traveling down the assembly line; each operation and deviation from a common path was recorded. The engine identification numbers indicated that all the damaged connectors were from one test stand, so it was clear that we needed to inspect and repair that test stand, which was identified in the flow path.
The value of using visual clues cannot be overstressed. They can provide a quick analysis of the problem at hand. Consider the next three examples; each involved visual clues that led to a quick response to the problem.
The first case involved malformed bearing surfaces. Upon inspection, we observed a crease at the base that wasn’t present on previous production components or samples (see Figure 8-5).
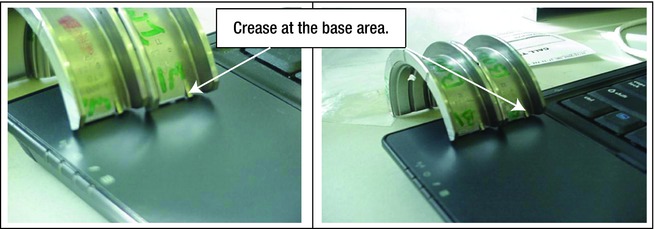
Figure 8-5. Malformed Bearing Surfaces
Also, the formed-tab length was extended on the bad part with the oil groove on the left side than on the good part without the oil groove (see Figure 8-6). The elongated tab, which stuck out too far, caused an interference at its base when it was attached to the mating surface area.
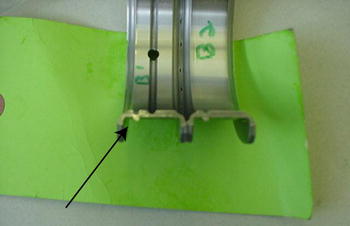
Figure 8-6. An Elongated Tab on the Bearing Surface Interferes with the Part It Mates To
Merely comparing a sample of a current troublesome part and a previously accepted production run component can have beneficial effects if there is a visible difference. With practice, it takes only a few moments to identify any differences.
In this case, the bearing supplier was notified about the discrepancy causing the problem, and they undertook actions to correct their forming process. The most current load of defective bearings could not be repaired and were subsequently scrapped. We requested a new shipment, which contained acceptable bearing lots that were employed in the assemblies. We took no further actions at our facility, but the supplier was instructed to certify all future shipments to ensure that the bearings were acceptable.
The second example involved a rash of complaints that an assembly line was receiving too many subassembly components with a required part missing. The failure to utilize first-time quality parts required us to complete costly rework operations.
Upon investigation, it was found that an O-ring was missing when the parts were received from the supplier. The supplier could not understand the complaint because they said the components went through a 100% inspection before they were packed for shipment.
We conducted a visual review of the subassemblies that had been shipped and received at the assembly facility. In the bottom of the containers, we found O-rings that had broken and become disassembled from the handle of the oil level indicator. It was inconceivable that a rubber O-ring, which resembled a thick rubber band, could disassemble itself or corrode and fail during a shipment to the place of assembly. So what was going on? We needed to investigate further.
Figure 8-7 shows that the O-rings could exceed a 200% elongation test as detailed in the specifications. This indicated that the failure was not due to excessive stretching applied during installation by the assemblers. The O-rings themselves were of sufficient form when observed; the diameters and thicknesses of the failed and assembled components were the same. Some O-rings remained on the oil level indicator handles and functioned as designed. There appeared to be no differences between the failed and assembled O-rings that would indicate that they were defective. Their plasticity, inside diameter, and thickness were to specification.
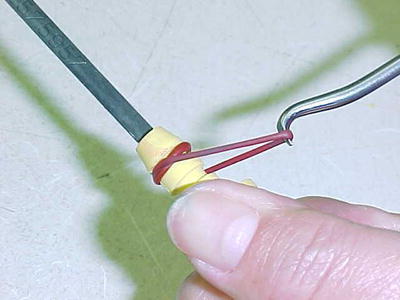
Figure 8-7. Inspection Showed that the O-ring Retained Its Elasticity as Received
The sharp fin on the indicator caused by the mismatch of its two halves was much more significant. The sharp edge (fin) actually caused the O-ring to slice apart. So the O-ring contribution to the failures was eliminated.
What we found, through observation, was a difference in the matching of the plastic oil level indicator handles on which the O-rings were installed. Figure 8-8 shows the desired and defective conditions where the two handle parts meet for matching during the plastic molding operation. This defective condition is generally caused by missing or severely worn guide pins and bushings on the pattern equipment. Since the patterns did not match as they should, shifting of one half of the mold caused the mold mismatch. This mismatch created a sharp corner on the handle, which formed a stress point for the O-ring. That stress point caused the separation.
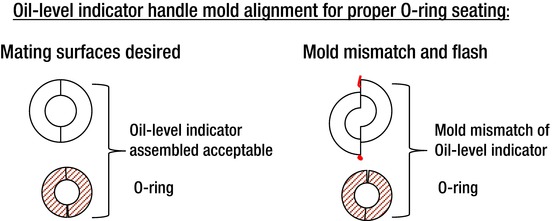
Figure 8-8. Oil-Level Indicator Handle Mold Alignment for Proper O-ring Seating
Looking at the components helped us quickly resolve the difficulty. We sequestered and inspected all of the oil level indicators at the supplier, those in shipment, and those at the customer, which prevented the use of any more unacceptable parts. The supplier immediately inspected their process bushings and pins and replaced the questionable items. They also initiated process checks, which had not previously been conducted, to prevent the condition from recurring.
Case 3: Putting Excess Iron to Good Use
This third example is a visual one made with the mind’s eye. Let me explain.
One metal casting plant is capable of pouring four different types of iron. It pours piston iron, cylinder iron, high-carbon-equivalent iron, and nodular iron. Piston and cylinder iron generally differ only in the silicon content. High-carbon-equivalent iron has a higher carbon content than the piston and cylinder iron. The nodular iron has carbon contained in small nodules as compared to flakes, which are present in the other three types of iron. These different iron types are all necessary because different parts require the different properties of the iron being used.
All of these mixes are produced in batches on the same production line and are all mixed in the same furnace that pours the iron into the different molds. When one part is finished, the excess iron is poured into pig boxes in the basement, where it is allowed to solidify to be melted again on another day. Some of the pigs formed unusual shapes when they overflowed their boxes and were allowed to solidify on the basement floor. There were tons and tons of iron being melted, solidified, and re-melted each week. The cost of these reprocessing changes exceeded $50,000 per year.
One day, while observing the operation, a young engineer saw what he believed to be a barbell forming in the overflowed iron in the basement. He had an idea and enlisted the aid of senior managers to investigate the use and sale of the recycled iron to eliminate melting costs and rehandling operations.
His efforts paid off: A manufacturer of weights and other gym equipment bought the excess iron in the form of barbell weights at a significantly reduced price than what they had been paying at another foundry. After all, a weight lifter doesn’t care about the type of iron that they are lifting, they are concerned only with the adequate weight and repetition of their exercise.
Had no one looked at the operation and seen the possibility, the waste would probably continue to this day. With that in mind, you can move to the next section, which deals with lot identification.
Sound problems are present in all types of applications. They can be present in manufacturing operations during the machining, assembly, installation, and shipment of products. Customers may complain about strange noises that accompany poorly functioning parts. In general, they do not lend themselves to easy solutions. Noise exhibits itself in the form of chatters, grinding, snaps, rattles, chirps, gurgle, squeaks, squeals, hisses, screeches, whines, and whistling patterns, to name a few. Noise reverberates, which makes it difficult to determine where it’s really coming from. It can bounce off of reflecting surfaces or obstructions or be diminished by absorbent materials.
This section attempts to help you develop sensitivity to noise and sounds that accompany industrial problems.
You must evaluate and define noise problems specifically to facilitate elimination. Figure 8-9 shows some relationships between the sounds experienced and the suspected causes.
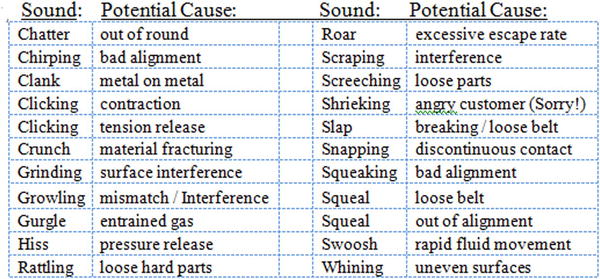
Figure 8-9. Assembly Noise Study Table Chart
Telltale sounds can help identify the cause of a problem. If the sound reverberates in an enclosed area from a direction that could not possibly generate it, look in a direction exactly opposite from the perceived direction. It might be that the sound is reflecting off of a sympathetic surface.
You also want to observe any vibrations or fluttering associated with the noise. Identifying any contributing causes allows you to eliminate unrelated variables, which in turn helps you focus in on the source.
Sometimes you’ll need to disassemble and reassemble units and test for differences in sound under different conditions with different components. Figure 8-10 shows one method for comparison. You measure the noise differences when different components are combined, such as switching noisy engine block balancer components with quiet and acceptable block components. This type of matrix can provide useful information in noise problem studies.
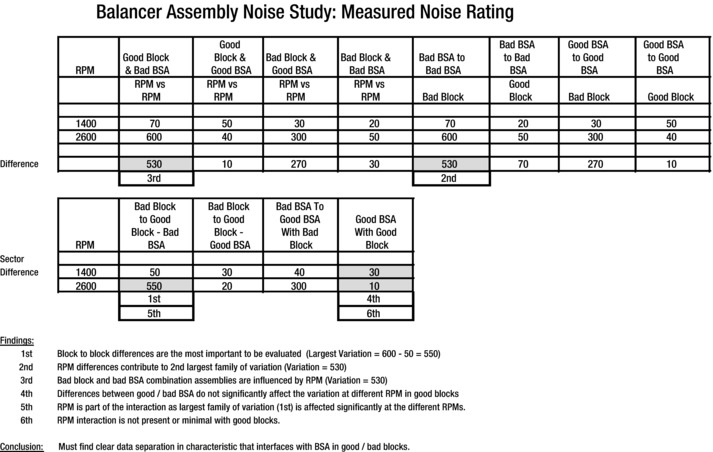
Figure 8-10. Balancer Assembly Noise Study Matrix
This type of action is necessary when detrimental noise problems are present. In this case, we needed to study vehicle engines and their assembly components because it appeared that the combination of components used for assembly affected the amount of noise generated.
We conducted the study in order to determine which conditions eliminated the noise. The components we used for the analysis were two blocks that differed in the amount of noise that was produced at each of two RPM levels. The assemblies that were less noisy were considered to contain less noisy balancers and less noisy blocks. The engine assembly components that were noisier were specified as being bad balancers and bad blocks. (The difference in blocks was due to the machining, whereas the difference in balancers was due to their construction. I will not define these conditions and characteristics here.) The test was conducted at two different levels—1,400 and 2,600 RPM.
As Figure 8-10 shows, we conducted each of the following tests for the different component assemblies:
Good blocks with bad balancers (BSAs)
Good blocks with good balancers
Bad blocks with good balancers
Bad blocks with bad balancers
In addition, we compared each of the bad balancers to the other bad balancers, first on a bad block and then on good block. Similarly, we compared each good balancer to the other good balancer, first on the bad block and then on a good block. We took readings with a calibrated and available instrument and recorded the data into the table.
The lower-left part of the table shows the relevant data we calculated from the readings listed in the upper half of the table. It shows that what was deemed to be a bad balancer had a significant effect on the noise and was the greatest contributor at 2600 RPM (value 550). A balancer deemed good when assembled did not cause excessive noise, regardless of whether it was assembled to what was determined to be a good block or a bad block at 2600 RPM (value 10). The noise at the elevated 2,600 RPM greatly exceeded the noise at the lower 1400 RPM level (value 50) with the bad balancer.
In this case, we needed to control the balancer quality to meet or exceed the standard that was used in the testing that determined acceptable balancers.
In short, switching good and bad components or sections and measuring the noise output revealed the characteristic(s) in the good and bad blocks that turned out to be the most significant cause of the noise problem.
Cracked or Broken Problem Sheet
The sheet in Figure 8-11 can be used as a qualifier for studies involving cracked or broken items. It was developed over time after studying the conditions that led to numerous broken objects. The premise of the questions is to determine whether excessive energy was applied to an acceptable part or whether the strength of the part was insufficient to withstand normal forces. (You will find examples in Appendix D.)
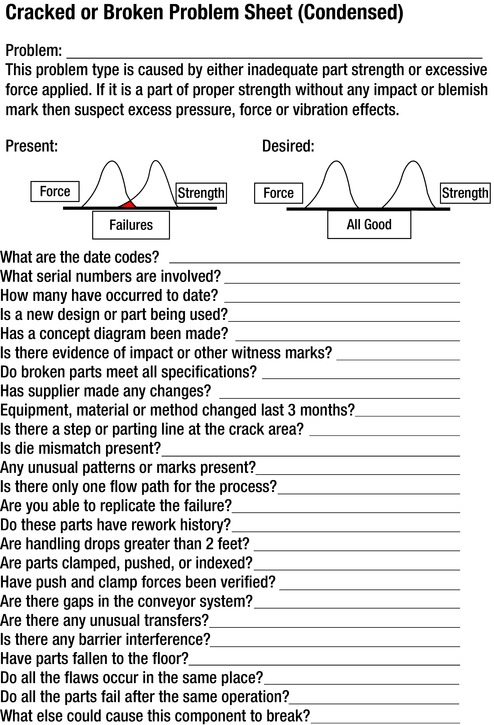
Figure 8-11. Cracked or Broken Problem Worksheet
Not only is it necessary to elucidate the force-and-strength relationship, it is necessary to identify the individuality, severity, location, time, and relative frequency of occurrence. Figure 8-11 indicates some causes; add other items as you experience them.
When working these problems, while you’re gathering individual identification factors, evaluate the energy-and-strength relationship. The top-left side shows that the part strength and the energy applied overlap in the area shown in gray. This indicates that there is the potential to have the components with the lowest strength overpowered by some of the highest forces applied. This may result in damaged or broken parts. We can surmise that if the energy sometimes exceeds the part strength, there will be damage some of the time. The diagram on the right in Figure 8-11 shows that if the minimum strength of the component is never exceeded by the maximum force applied, there will never be damage due to excessive force.
Sometimes the component’s weakness is so obvious that you don’t need to conduct a complete analysis. Consider the following example, which involves a manufacturing problem caused by improper component strength. This condition occurred on a newly installed engine line during a pilot run when the components, methods, assemblies, functions, and final test were being certified to the final manufacturing assembly requirements.
While inspecting the first six engines that progressed down the assembly line, the operator was to check for obvious defects, such as oil leaks, poor connections, missing components, visible damage, and other detrimental conditions. He noted that when he removed the oil dipstick from the newly assembled engine, the dipstick was broken.
As part of its manufacture, the dipstick had holes punched into the end to indicate oil level. The crack always appeared at the center of the fourth hole from the end (see Figure 8-12). Because the breakage was noticeable after merely inserting and withdrawing the dipstick from the engine, it appeared that the problem was related to the dipstick strength and not to the forces that were applied to it. This was a valuable clue, because it is important to ascertain whether the part is weak or if excessive force has been applied.
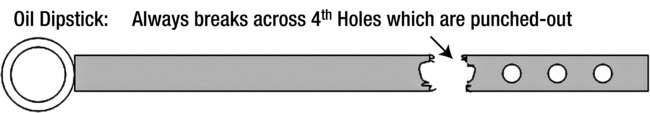
Figure 8-12. Broken Dipstick
The engine was not scrapped, but it did have to be reworked to remove the broken piece, which caused contamination and a throughput problem due to required rework. The recovered pieces from the crank case were pristine in that there were no metal slivers or abnormalities that could cause additional damage once the piece was removed. The engine was cleaned and reassembled.
There were no unauthorized witness marks on any of the broken or unbroken parts. None of the parts contained a die or serial number to differentiate handling or processing. All of the parts were broken in the center of the fourth hole from the end of the dipstick, which showed that there were differences between the bottom hole and the top hole, one end of the part to the other, and they were all breaking in one region in a recognizable pattern.
New parts were subjected to a bending test, and we found that the end opposite the indication holes could be bent 90 degrees more than 25 times without breaking, whereas the end with the holes cracked upon the first 90-degree bend. Comparing the end strength thus revealed that only the end with the punched holes cracked after bending.
We then compared the new dipstick to the older model, which had always been acceptable. The old dipstick had indicator dimples, not holes, to show the fluid level; it also was not crosshatched on both sides (see Figure 8-13). Obviously, the older design was significantly stronger than the new one. Therefore, the new design immediately became suspect.
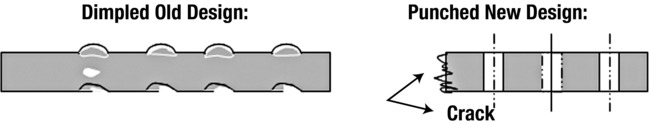
Figure 8-13. Dipstick Dimple versus Punch Design
Considering all the clues generated in this simple analysis allowed us to compile a summary of the significant findings. We found that the newly designed dipstick was deficient. The old design was dimpled and not punched. In addition, the crosshatching that was present on the new design appeared to be too deep and was believed to be a major contributor, if not the main reason, for the failure.
![]() Tip Replicate the defect whenever possible; it will usually provide valuable clues.
Tip Replicate the defect whenever possible; it will usually provide valuable clues.
We had to stop the line and change the dipstick back to the dimpled design without the crosshatch. This resolved the immediate problem. However, that was not the end of the correction process. We revised the design (the DFMEA) to incorporate these findings so as to prevent a similar problem whenever another dipstick or similar indicating device is being designed. It also appeared obvious that the new design was not test-validated. We therefore also changed the PFMEA and control plan to ensure that this type of change would be subject to testing and validation next time around.
We changed the process (the PFMEA) to recognize knurling that had to be controlled on any future application. We also changed the control plan to validate any design change before acceptance and to test replacement components before use. The control plan also recognized and specified the favorable dipstick method and the need for visual characteristic requirements. Then we sent photographs to all concerned and captured the information for the reference file. This included the supplier who designed and furnished the component.
Summary
This chapter has shown you how visual inspections are not only helpful but almost mandatory when you’re analyzing problems. Visual indicators—whether observing parts or the process, viewing the identification markings as shown by flowcharts and lot identification, or inspecting broken components for telltale markings or differences—can be useful in eliminating problems. Sound and noise studies can also aid your detective work. With these tools now in your tool packet, you’ll learn about how to establish consistent work patterns and use many-level reviews.