
Collect Relevant Data
Step Five
The fifth step is to collect accurate data that is relevant to the problem you are trying to solve. Data collection is the means of capturing available characteristics for easier analysis. A visual evaluation, which is described in later pages, can also be used to assign values.
The previous chapter discussed the steps for applying a plan of attack and how to determine if additional steps were required to analyze the problem. We looked at the use of simple tools that could generate data from direct measurements or from a visual rating system. We also discussed the importance of assigning responsibility to prevent problems for occurring and providing solutions so that they would not recur. In this chapter, you will further investigate the collection of data and will read about the differences among variable, attribute, and conditional data. You’ll also learn how to use a visual rating system.
Past and current data may be required and necessary to solve a manufacturing problem. Such data may help you identify clues that lead to a solution of a problem. It will also aid in identifying which, if any, products should be contained and controlled. All questionable products should be sequestered and certified for compliance. Suspect products should never be passed along to the customers.
Use the Problem Sheet to Gather Data
You can use the problem sheet, shown in Figure 5-1, to collect conditional data when a problem first arises. It requires you to consider the conditions that could be involved in causing the problem. Ideally, you can describe a malfunction as a forming, assembly, or transportation problem, and document whether the part was acted upon with a constant or impact force. That helps to determine whether the part had improper energy applied or if the part was faulty.
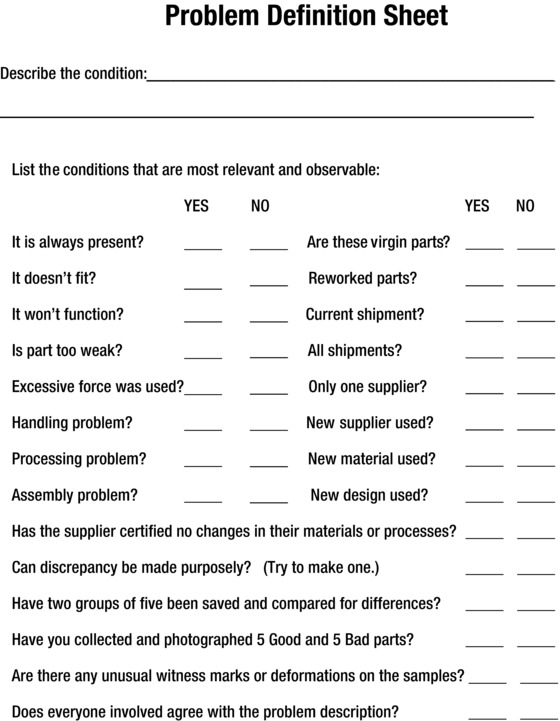
Figure 5-1. Problem Definition Sheet
If an operation failure occurred, I recommend that you replicate the failure on purpose if possible. Ask yourself these questions:
Was there a kinetic or potential force applied?
Was the problem caused because the force was too great or because the part was too weak?
Is the failure repeatable?
Is the point of origination clear?
Was a comparison made of good and bad parts?
Very important clues are provided if you can describe the failure; it leads to understanding the failure mode.
The questions in Figure 5-1 require simple answers that will help you capture, control, and identify the important data related to the suspect parts. The conditional differences may lead to your identifying that the assignable causes lie not only with the failed part, but also with the materials, machines, tests, methods, procedures, or environment.
Collecting these types of clues provides viable data that will expedite a solution.
After you achieve consensus on the fault being studied and identify the peripheral information, you need to evaluate the defect. Enumeration using acquired variable (number) data is more precise than comparing collected attribute (description) data, because the information is more defined and provides greater measurement certainty. For example, an inch, a gram, a mile, and a hectare can be duplicated around the world with a verbal description because they can all be related to a universal standard of measurement as determined by the U. S. Bureau of Standards. Each of these is variable (numeric) data that requires specific properties. On the other hand, if a customer calls India, China, Mexico, or someone in the U.S. and asks for a deeper red than the sample they received for approval, there will be a different red provided from each location. This is because the attribute data is determined by the visual interpretation of the perceiver and is not specifically defined.
If the assembly calls for a flush mating surface to within 0.001 inch, you know that gauge measurements that exceed 0.001 inches are not acceptable. In this case, the gauge might be a micrometer that was used for the measurement. This is variable or number data. On the other hand, if the assembly requires that the object be painted a robin egg blue at final assembly, you must compare it to and match a previously accepted standardized visual sample of plastic or paint chip to be acceptable. This is attribute or descriptive data.
Once you’ve defined the defect, you need to determine the meaningful measurements that are related to the problem. Since accurate measuring systems are a prerequisite for data collection, you must carefully choose the measuring system that’s the most applicable. Both variable and attribute systems can generate usable data, but only the variable data can be used for statistical calculations. The attribute data only describes the fault’s features.
Collect Variable Data
Variable data collection devices should be subject to gauge reliability and repeatability studies before use. A gauge that exceeds 30% gauge error as determined by industry-accepted methods is unsatisfactory. Therefore, the measuring instrument must be calibrated to make the measurements over the measuring scale required, without biasing results.
Sensitive measuring instruments can be damaged by sudden impact or even temperature differentials. A micrometer that is dropped to the floor may be severely damaged and cause inaccurate readings if not properly recalibrated with an established standard before reuse. Calibration at timely intervals is a precautionary measure to help ensure that measuring instruments and gauges are up to standard and acceptable for use. It should be noted that there are other conditions that can affect the accuracy of measurements, including vibrations, direct sunlight, drafts, contamination, and other environmental conditions. However, anyone making measurements should regularly calibrate to ensure gauge accuracy.
The direct effects of the variables are sometimes easily determined by observation. You should inspect any defective parts vigorously for every clue. Not only should the part be inspected for discrepancy characteristics and location, you need to capture, record and compare any pertinent information. This might include, among other identifiers, the following:
Serial number
Pattern number
Date of manufacture
Lot number
Surface appearance
Finish
Discoloration1
In addition, be cautious. Repeat measurements might not be the same due to fatigue in a prior test. For example, an air-filled bladder may measure as larger or longer than it does when it’s deflated. To eliminate any potential causes, you must first compare the acceptable and unacceptable conditions for observable differences.
Attribute data is used to describe characteristics that cannot be collected from variable measurement devices. These characteristics include color, taste, brightness, discoloration, rust, and so on. Attribute data is generally collected to evaluate a condition that doesn’t lend itself to variable instrument measurement. Attribute data involves estimation and involves visual, auditory, or other sensory perceptions.
You can make your attribute data more useful by creating an evaluation system for comparisons. This might be in the form of assigning a designated comparison value and rating system.
![]() Note Attribute data does not provide as accurate a description as measured data, but it is helpful in measuring comparisons that cannot be adequately measured with a measurement gauge or device. The amount of applied grease, the proliferation of holes or porosity in metal castings or glass, the gradients of color—these are all examples of important attribute data.
Note Attribute data does not provide as accurate a description as measured data, but it is helpful in measuring comparisons that cannot be adequately measured with a measurement gauge or device. The amount of applied grease, the proliferation of holes or porosity in metal castings or glass, the gradients of color—these are all examples of important attribute data.
Figures 5-2 through 5-4 are examples of visual evaluation systems. They have been used to contrast the amount of scoring on gear teeth, determine the initiation of gear tooth pitting, record leakage rates, compare amounts of grease present, match differences in defect bleeding, rate presence of voids, compare ignition discoloration, establish porosity levels in castings, and so forth. You can create one, on an as-needed basis, for any class of problem you might have. Such systems allow you to generate clues when numeric measuring systems are not available or tenable.
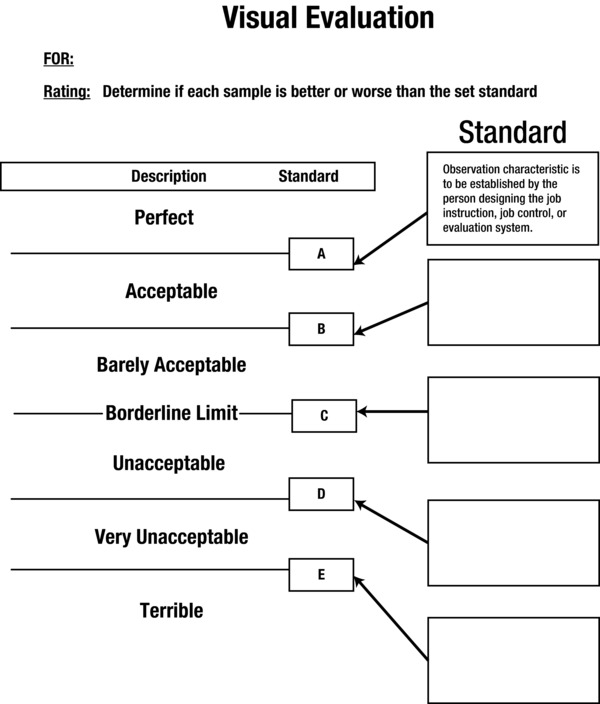
Figure 5-2. Visual Evaluation Form
Visual evaluation systems are easily constructed. You can describe the entire range of a characteristic using six classifications. Each of the classifications has a specific acceptance rating, ranging from perfect to horrendous. In addition, there are five standard ratings—A thru E—that are determined by the person designing the system. They indicate the conditions that may be present. Standard A depicts an almost perfect part, whereas standard E may represent the most unacceptable condition found. The rating of C should always be the breakpoint between what is acceptable and what is not.
You can also use a visual rating sheet to enhance operator instructions, whereby the actions of the employee are guided by a visual rating sheet posting. This is shown later in the chapter as a means to control grease application. By observing the posting, the employee knows whether to continue the operation, adjust the system, or notify a supervisor who has the authority to react to the system.
It doesn’t require undue expertise to develop these standards. You simply collect a number of the parts over time related to the characteristic under study and attempt to capture examples of the best and worst conditions. Choose the sample that is barely acceptable, and call it Standard C. It differentiates between good and bad parts. Then choose two samples on either side of Standard C; they differentiate between a perfect sample and the worst sample. Arrange these four samples in order of severity and rank them as A, B, C, D, or E, according to your rating system.
Once you construct the system, collect current samples and rate them with a team or individually. If they are less acceptable than the standard B but more acceptable than the Standard C, you could rank them as C+, which would be an acceptable part. If they are more acceptable than Standard D but less acceptable than Standard C, you could rank them a C–, which is an unacceptable part. This artificial comparison system will allow you to make decisions that will aid in the problem solution.
The next pages show a visual evaluation system that is used to evaluate porosity in an engine front cover (see Figure 5-3) and one that defines the rating system for acceptable grease coverage on incoming seals (see Figure 5-4), which affects engine leaks.
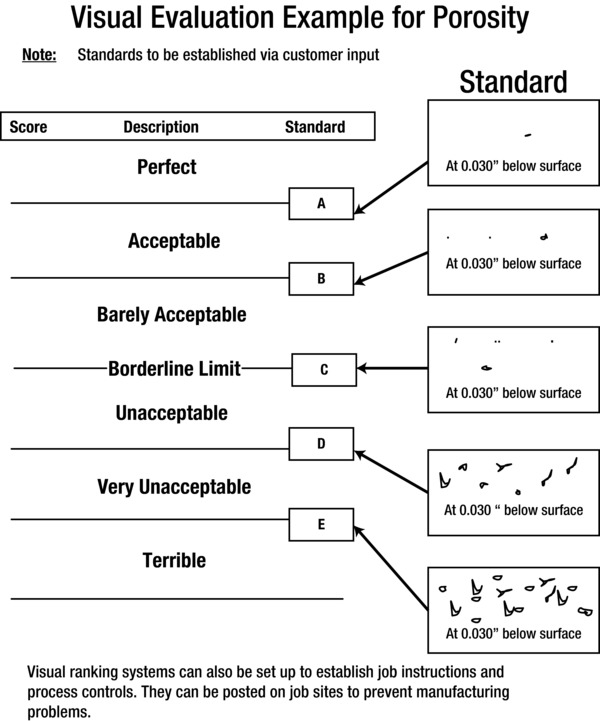
Figure 5-3. Example of Visual Rating for Porosity
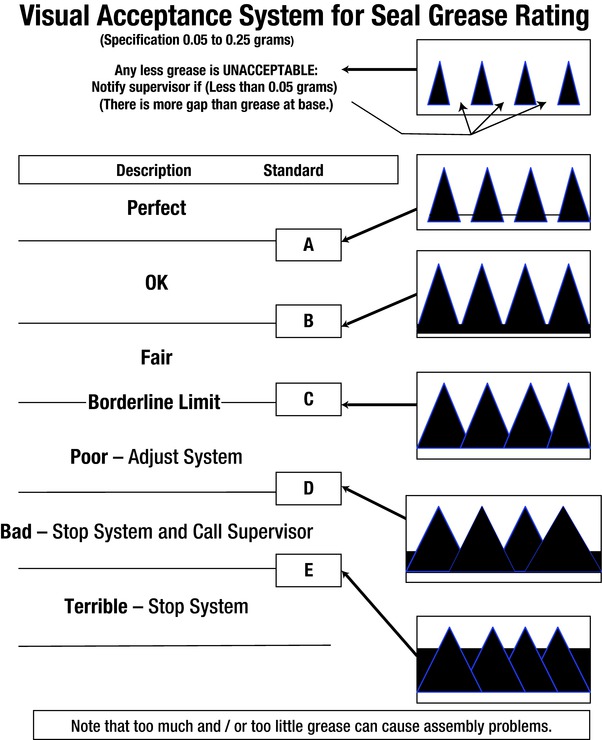
Figure 5-4. Example of Visual Acceptance System for Grease
Under ordinary circumstances, a component may not be inspected for porosity. The amount of porosity shown in these standards exceeds the allowable amount in engine assembly components, but would be appropriate for plastic horseshoes used in a children’s game set. It depends upon the circumstance and product use. In the case of the horseshoes, excess porosity resulted in a broken horseshoe when it was tossed to a retaining stake. The porosity, which is basically the presence of voids in a product, can induce leaks, failure planes, or structural weaknesses.
Figure 5-4 shows the sample that was referenced earlier. It provides a visual instruction to the system operator about the appropriate level of grease. The operator can continue operating the system, adjust it, or call the supervisor to terminate it. In this case, the supervisor’s actions are not explained; she might have installed some additional action on the line after adjusting the system, created a rework station to salvage the non-conforming product, or terminated the system. The initial instruction, though, was to help the operator make informed decisions.
Summary
In this chapter, we further investigated the collection of data and described the difference between variable, attribute, and conditional data. Variable data is obtained by direct measurement of a component’s characteristic, feature, or dimension. Attribute date is generated through the measurement system using visual ratings, and conditional data depends upon the conditions encountered. The visual rating system can be used to generate data or as a means of controlling the quality of the product or process; the data it can generate depends upon the evaluator’s aims and perspective.
In the next chapter, we will cover the six main actions necessary for success. We’ve identified these six actions during our work in mentoring 200 suppliers to identify, correct, and prevent manufacturing problems.
1Note that a variable is something that is apt to change. Pattern serials, dates, surface finish, and lot numbers, for example, vary—as do the other characteristics mentioned. Surface appearance and discoloration are attributes, but they are also variables that cannot be quantified easily with variable measuring instruments.