
Fractional Explained
You can use fractional analysis (a partial factorial) to determine which variables are important. Fractional analysis can designate variables to be used in designed experiments. It can also be used to generate clues when other methods have not worked.
This appendix explains fractional use in more detail than Chapter 7. It explains and describes the required calculations. These calculations are not difficult, and any investigator will become proficient after creating one or two fractional.
If you don’t recall the problem presented in Chapter 7, review the piston-stuffing data sheet and the resulting piston-stuffing interaction table, shown in Figures 7-19 and 7-20. These illustrations show how we accumulated the data. As you’ll see, I highlighted the calculations that focus attention on the parameters being calculated.
Figure A-1 illustrates the calculation of the effect of two variables on a piston-stuffing operation, as described in the main text. The operation consists of two stuffing machines, which insert two pistons each into a machined engine block.
The table is a fractional in a 2X2 layout. It was designed from the data collected when the machines were jamming. We identified at least three main variables from the data. These included the two stuffing machines, the quality of the pistons, and the two different machining lines for the casting blocks.
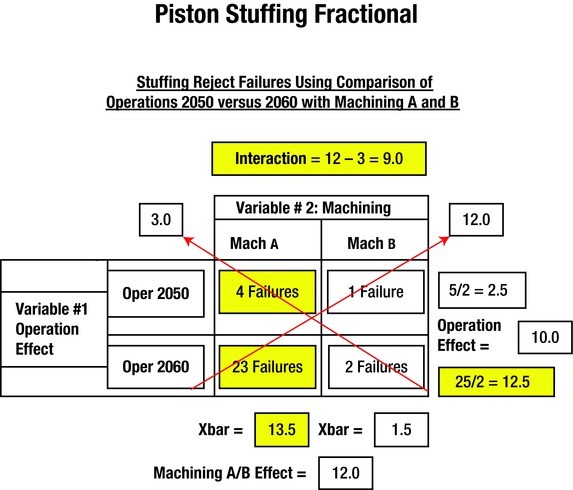
The first display is shown in Figure A-1. Variable 1 compares a stuffing operation done in Operations (Op) 2050 and 2060. Variable 2 is the machining experienced when processed through Stream A or Stream B. The dependent variable represents the total number of engine blocks that resulted in stuffing failures. These failures were recorded for each of the four classification combinations during the data-collection period. Calculations are as follows.
For the operation effect: The sum of failures for Op 2050 for the A and B machining operations was 4 + 1 = 5. We divided this number by 2 and inserted it in the Xbar (average) block to the upper right of the matrix. This indicates that the average effect of Op 2050, when stuffing A and B machined blocks, was 2.5. The effect of Op 2060 was determined by adding the failures: 23 + 2 = 25. We divided 25 by 2 and inserted the result—12.5—in the highlighted lower-right Xbar block. It shows the effect of Op 2060 when it’s running A or B machined blocks. The difference between these two averages is the operation effect of the difference of the two stuffing operations: 12.5 – 2.5 = 10. This is the farthest right value shown in the figure.
Conclusions Based on Current Sample:
Machining A caused the most failures with an effect of 13.5.
Op 2060 caused the second-highest variation with an effect of 12.5.
Machining A and Op 2060 have an interaction with an effect of 9.0.
The direct, indirect, and interactions are strong with Op 2060.
Something is wrong at the Op 2060 stuffing station.
Machining effects are larger than operation-stuffing effects.
Machining A must be refurbished and retargeted to nominal dimensions.
Stuffer at Op 2060 must be checked for compliance.
Figure A-1. Fractional of Operations and Machining with Conclusions and Recommendations
For the machining (A or B) effect: The sum of failures for blocks machined by A for the Operations 2050 and 2060 was 4 + 23 = 27. We divided this number by 2 and the result—13.5—and was inserted and highlighted in the Xbar block in the bottom left of the matrix. This indicates that the average effect of machined A blocks stuffed by Op 2050 and 2060 was 13.5. The effect of machining B was found by adding the failures (1 + 2 = 3). We divided this number by two and the result (1.5) was inserted in the lower-right Xbar box to indicate the average machining B effect. The difference between the two Xbar effects was 13.5 – 1.5 = 12.0 for the total A versus B machined effect on the system. This value is shown as the lowest boxed value in the figure as the machining A /B effect. This is the largest total effect and is therefore the most important difference to be studied for correction.
We made similar calculations for the diagonals to determine the interaction effects of the variables, described in a following paragraph.
The interaction effect was 9.0, which was smaller than either of the direct effects of machining A or stuffer 2060, but almost as detrimental. This value is highlighted at the very top of the figure. It represents a comparison of the two diagonal value sums, shown as arrows. The diagonals were calculated as follows: Op 2050 had four failures with machining A and Op 2060 had two failures with machining B. Therefore, (4 + 2 ) / 2 equals 3.0 for the diagonal box to the top left. Similarly, Op 2050 had one failure for machining B and Op 2060 had 23 failures for machining A. This resulted in a diagonal score for the upper right of (23 + 1) / 2 = 12.0. The interaction was then the difference, calculated as 12.0 – 3.0 = 9.0.
From this, we can see that the largest matrix effect was due to the difference between machining A and machining B (the machining A/B effect, 12.0). The second largest matrix effect, the difference in the operation effect between Op 2050 and Op 2060, was 10.0. The third largest matrix effect was due to the interaction between the operations and the machining differences, and it was 9.0. However, machining A had the largest variable effect with a 13.5 rating, which indicated that it was the most important variable and was the candidate for being the main cause of the problem.
These results indicate that there are at least two and possibly three conditions that require correction. Actually, looking at the 2 X 2 matrix, you might suspect that there are obvious clues. So what does the data tell us when we combine and analyze all of the paired combinations and classifications in Figure A-1? The following facts become obvious:
Most of the defects in both operations are from machining A. Machining A had 27 total jams, versus three for machining B.
Machining B blocks run through both operations with a minimum of jams. Machining B had only three jams of the 30 total.
There is a difference in the stuffer operation or setup because machining A blocks do not run through Op 2050 and Op 2060 with the same problem frequency. Op 2050 had four jams versus 23 jams in Op 2060.
Again, as a reminder, I encountered this problem on an assembly line when the process deteriorated and started jamming, which caused downtime and lost production. We used a data sheet to collect data, as described in the main text, and we came to the conclusions based on the data, which pointed to the three variables used in the calculations.
We identified actions, indicated on the display sheets, that led to correcting the problem causes:
Machining A must be refurbished and retargeted to nominal dimensions.
Stuffer at Op 2060 must be checked for compliance.
Piston quality is not suspect for the current jams.
Retarget machining A for bore 2 to nominal dimensions.
Retarget machining A for bore 4 to nominal dimensions.
Similar calculations are provided in Figures A-2 and A-3 for all the other variable combinations. They show the direct and interaction effects of the bores and pistons included in the system. These three variables had the most significant effect on the equipment jamming on the assembly line. The original suspect, defective pistons, is the cause of least concern.
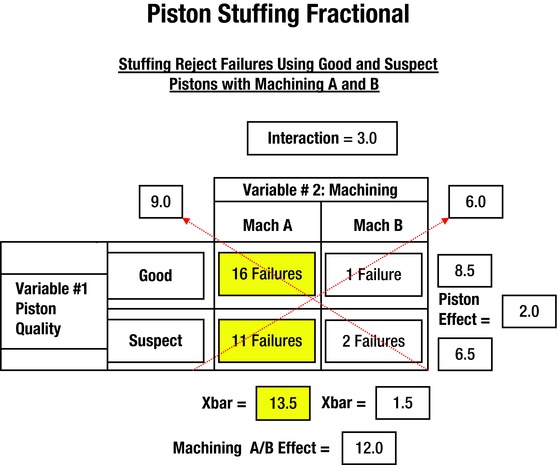
Conclusions Basedon Current Sample:
Machining A caused the most failures with an effect of 13.5. (Repeat).
Good pistons had more rejects than suspect pistons at an effect of 2.0.
There is interaction between machining A and pistons at an effect of 3.0.
Interaction has greater effect than direct effect of pistons alone (3–2=1).
Machining A causes the most defects overall.
Recommendations:
Machining A must be refurbished and retargeted to nominal.
Piston quality is not suspect for the current problem jam-ups.
Figure A-2. Fractional of Pistons and Machining, with Conclusions and Recommendations
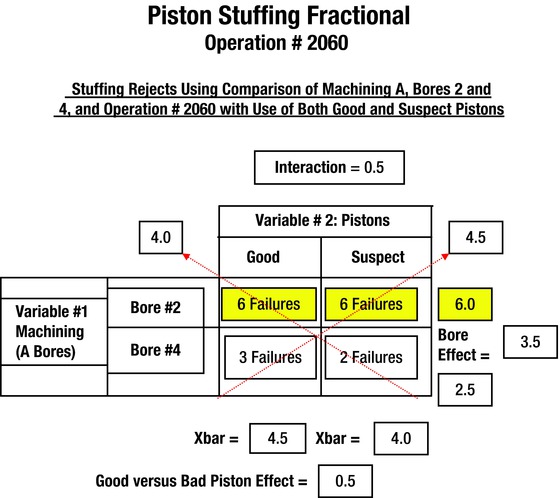
Conclusions Based on Current Sample:
Bore 2 is responsible for most reject variation with effect of 6.0.
Bore effect had 7 times more variation than pistons which had effect of 0.5.
Bore effect had 7 times more variation than part interaction effect of 0.5.
There appears to be no difference in piston characteristics for this problem.
Recommendations:
Retarget machining A for Bore 2 to nominal dimensions.
Retarget machining A for Bore 4 to nominal dimensions.
Figure A-3. Fractional of Pistons and Block Bores with Conclusions and Recommendations
As a review, the three figures required the following actions:
Machining A must be corrected to the target dimensions (see Figure A-1).
Op 2060 stuffer must be checked for target dimension (see Figure A-1).
Pistons are not significant in causing jams (see Figure A-2).
Machining A must be retargeted for bores 2 and 4 (see Figure A-3).
We solved the problem by performing these tasks. The purpose of this example is to show you why fractionals are important and easy to use.