
Chapter 21
Storing, Managing, and Analyzing Big Satellite Data
Experiences and Lessons Learned from a Real-World Application
Ziliang Zong
21.1 Introduction
Big Data has shown great capability in yielding extremely useful information and extraordinary potential in revolutionizing scientific discoveries and traditional commercial models. Numerous corporations have started to utilize Big Data to understand their customers’ behavior at a fine-grained level, rethink their business process work flow, and increase their productivity and competitiveness. Scientists are using Big Data to make new discoveries that were not possible before. As the volume, velocity, variety, and veracity of Big Data keep increasing, we are facing significant challenges with respect to innovative Big Data management, efficient Big Data analytics, and low-cost Big Data storage solutions.
In this chapter, we will (1) provide a case study on how the big satellite data (at the petabyte level) of the world’s largest satellite imagery distribution system is captured, stored, and managed by the National Aeronautics and Space Administration (NASA) and the US Geological Survey (USGS); (2) provide a unique example of how a changed policy could significantly affect the traditional ways of storing, managing, and distributing Big Data, which will be quite different from typical commercial cases driven by sales; (3) discuss how does the USGS Earth Resources Observation and Science (EROS) center swiftly overcome the challenges from serving few government laboratories to hundreds of thousands of global users; (4) discuss how are data visualization and data mining techniques used to analyze the characteristics of millions of requests and how can they be used to improve the performance, cost, and energy efficiency of the EROS system; and (5) summarize the experiences and lessons that we learned from conducting this Big Data project in the past 4 years.
The Big Data project we discuss in this chapter has several unique features compared to other typical Big Data projects:
- It is not driven by sales or other commercial benefits. Instead, it is driven by the promise of high-quality service to global researchers and users.
- The Big Data already existed in the previous system, which did not pose any challenges before. However, a simple policy change brought numerous new challenges to the existing system, which is unusual in most Big Data projects.
- The characteristics of users and their behaviors changed dramatically after the new policy was announced, which is not common in real-world Big Data projects.
- Although the previous system has been designed to store a massive volume of data, the new system designs still involve almost every aspect of the challenges faced by any Big Data project (e.g., system architecture, data storage, work flow design, data mining, data visualization, etc.).
- We share not only our experiences but also several lessons that we learned from this Big Data project, which probably are more valuable to readers.
The case study we conduct in this chapter will provide new perspectives for readers to think wider and deeper about the challenges we are facing in today’s Big Data projects as well as possible solutions that can help us transit smoothly toward the exciting Big Data era.
The remainder of the chapter is organized as follows. Section 21.2 provides a brief background about the NASA/USGS Landsat program. Section 21.3 will discuss how did a new policy change almost everything (work flow, system architecture, system hardware and software, users, and user behaviors) of the conventional system and how does USGS EROS swiftly overcome the new challenges with great agility. In Section 21.4, we will present our previous research efforts on how to utilize data visualization and data mining techniques to improve the performance and reduce the operation cost of the newly designed satellite imagery distribution system. Section 21.5 concludes our study by summarizing our successful experiences and hard-learned lessons.
21.2 The Landsat Program
The Landsat program [1,2] is the longest continuous human effort in recording the Earth’s surface. Since the early 1970s, a number of Landsat satellites have continuously and consistently captured and archived petabytes of visually stunning and scientifically valuable images of our planet. The Landsat program is jointly managed by NASA and USGS. In this joint mission, NASA is responsible for the development and launch of satellites as well as the development of the ground system, while USGS is responsible for storing, managing, and distributing the captured massive satellite data. Figure 21.1a demonstrates a Landsat satellite orbiting the Earth taking images, and Figure 21.1b shows the huge antenna in front of the USGS EROS center, which is used to periodically receive the captured raw satellite images from a satellite on service. Inside the EROS building, there is a large-scale data center that stores, processes, and distributes the big satellite data (more details will be discussed in Section 21.3).
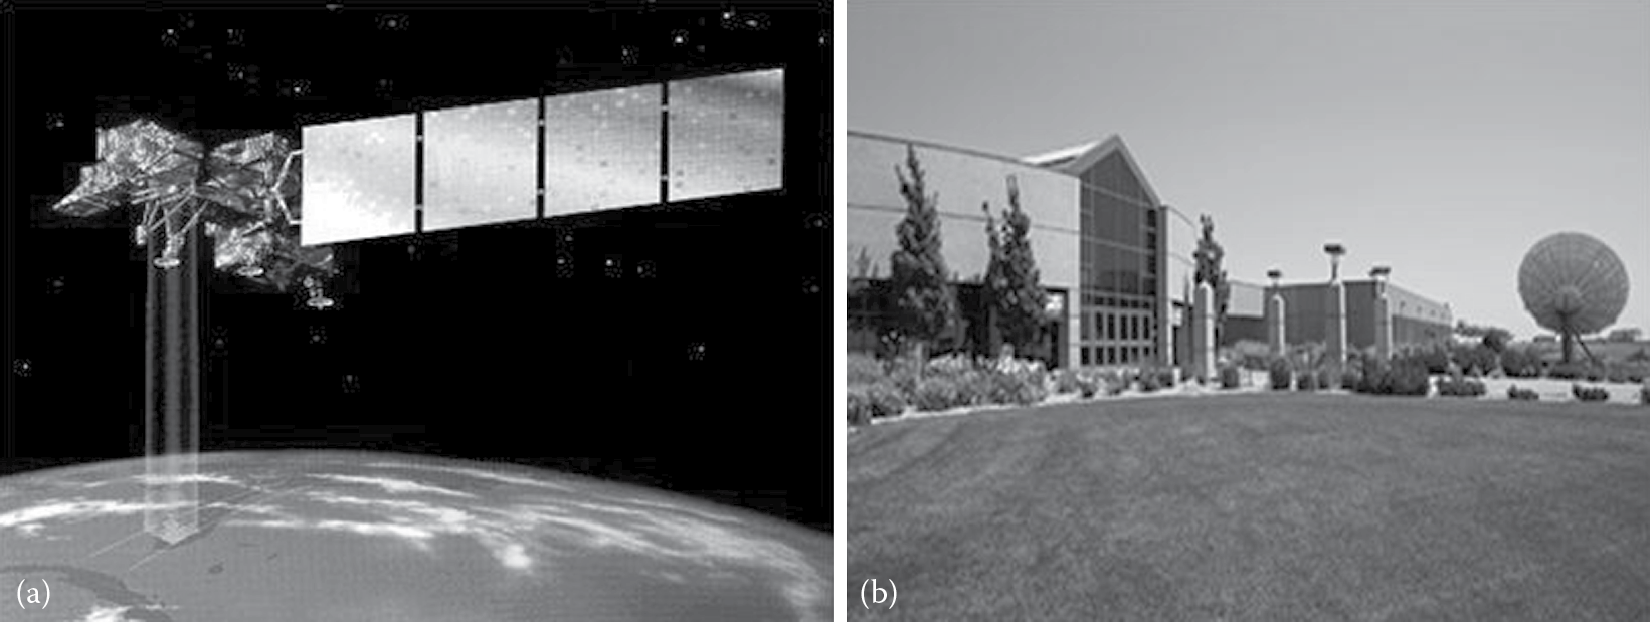
(a) A Landsat satellite capturing images. (b) USGS Earth Resources Observation and Science (EROS) Center, Sioux Falls, South Dakota.
For over 40 years, the Landsat program has created a historical archive that no other system can match in terms of quality, detail, coverage, and length. This unparalleled satellite data archive has provided scientists the ability to assess changes in the Earth’s landscape in a wide variety of research domains (e.g., hydrology, agriculture, atmospheric science, natural hazards, and global climate change). It is worth noting that the Landsat sensors only have a moderate spatial resolution. You cannot see individual houses on a Landsat image (like you can see from Google Satellite Images), but you can see large geographical items such as lakes or rivers and man-made objects such as highways and cities. This is an important spatial resolution decision because it is coarse enough for allowing global coverage with manageable data volume. At the same time, it is detailed enough to identify landscape changes and characterize human-scale processes such as urban growth. Figure 21.2a shows an example of using Landsat satellite images to study the ice melting speed of Antarctica, and Figure 21.2b shows an example of using Landsat satellite images to study the urban growth of Las Vegas. All images shown in Figure 21.1 and Figure 21.2 are provided by the USGS and NASA.
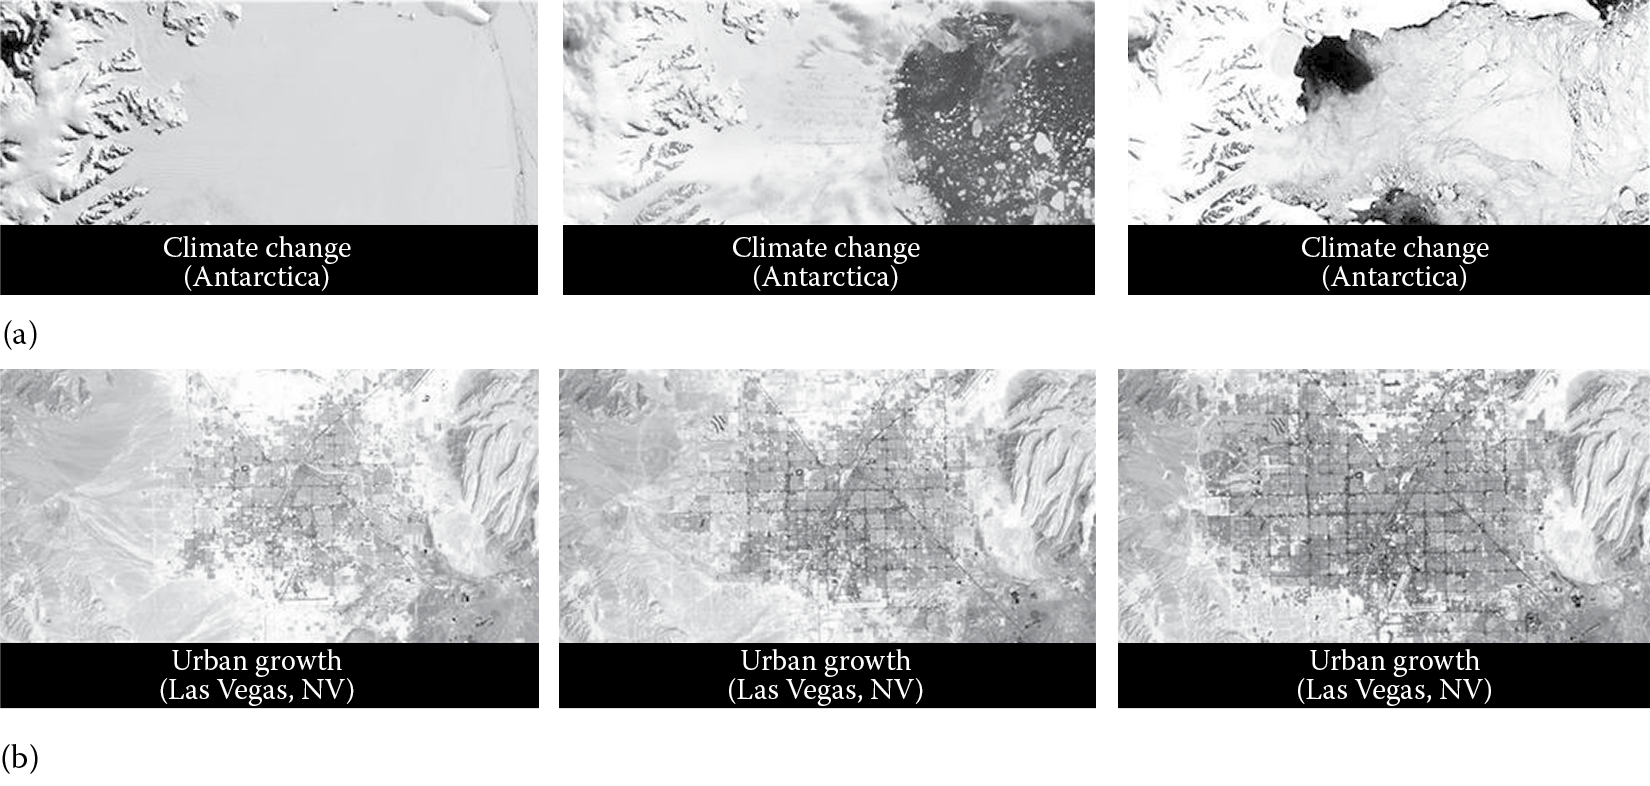
(a) An example of using Landsat satellite images to study global climate change. (b) An example of using Landsat satellite images to study the urban growth of Las Vegas, NV.
21.3 New Challenges and Solutions
21.3.1 The Conventional Satellite Imagery Distribution System
Before 2008, EROS has offered the satellite distribution service for many years using the conventional distribution system. Generally, users send specific requests to the USGS EROS, which includes the row (latitude), path (longitude), and time (when the images are captured and by which satellite) information of the satellite imagery. Once the payment is received, the USGS EROS will process the requests, burn the produced satellite images to CDs or DVDs, and send them to users through snail mails. Although the USGS EROS has successfully managed their workload and distributed a large amount of valuable satellite data using this traditional way for decades, only a few research groups could afford to access these expensive satellite images. Therefore, the majority of raw satellite data were stored on tape systems to reduce cost, and a moderate size of storage system was sufficient for processing the limited number of user requests.
21.3.2 The New Satellite Data Distribution Policy
On April 21, 2008, the USGS made an important “Imagery for Everyone” announcement that the entire USGS Landsat archive would be released to public at no charge by February 2009 [3]. This announcement also provided a detailed timeline for the availability of different satellite data. Based on the announced timeline, the full archive of historical Enhanced Thematic Mapper Plus (ETM+) data acquired by the Landsat 7 satellite, which was launched in 1999, would become available for free downloading by the end of September 2008. At that time, all Landsat 7 data purchasing options from the USGS, wherein users paid for on-demand processing to various parameters, would be discontinued. This new policy generated a significant impact on almost every component of the conventional EROS satellite imagery distribution system.
21.3.3 Impact on the Data Process Work Flow
The conventional work flow is simple and straightforward. Users contact EROS directly about their requests. Once the payment is confirmed, EROS will process the requested satellite images, which typically include the following steps: (1) the raw data is located from the tape system; (2) the raw data is loaded to a server for image optimization; (3) the optimized satellite images are burned to CDs or DVDs; and (4) the CDs and DVDs are delivered to users via snail mail. A large portion of the conventional data process work flow was handled manually, and the end users only expected their requests to be processed in weeks or even months. The major challenge of the new policy is that the satellite imagery distribution service must be available 24/7 and that users will expect their requests to be processed almost immediately (in seconds or minutes). Therefore, the new data process work flow must be completely automatic. Manual intervention should only be allowed in rare circumstances (e.g., when a user requests an extremely large number of satellite images).
21.3.4 Impact on the System Architecture, Hardware, and Software
In order to automate the entire data process work flow and ensure the quality of the satellite imagery distribution service, EROS has no other choice but to rethink and redesign the whole system. From the system architecture perspective, the new architecture must be highly reliable and provide clear interfaces between users, storage subsystems, and processing subsystems. In addition, the new architecture has to be flexible and scalable enough to accommodate possible future hardware/software changes and significant growth of global users. From the hardware perspective, the trade-offs between hardware performance, power consumption, reliability, and cost need to be considered altogether. In addition, the new hardware system should be able to reuse hardware components of the previous system whenever it is possible to reduce cost. From the software perspective, the primary challenge is to integrate the existing software components (e.g., satellite image processing) as well as newly developed software components (e.g., download web portal, database searching, request scheduling, prefetching) into the redesigned software stack of the new architecture. In addition, some of the previous software needs to be modified to fully take advantage of the advanced hardware. For example, the satellite image processing software needs to be parallelized to better utilize multicore CPUs.
21.3.5 Impact on the Characteristics of Users and Their Behaviors
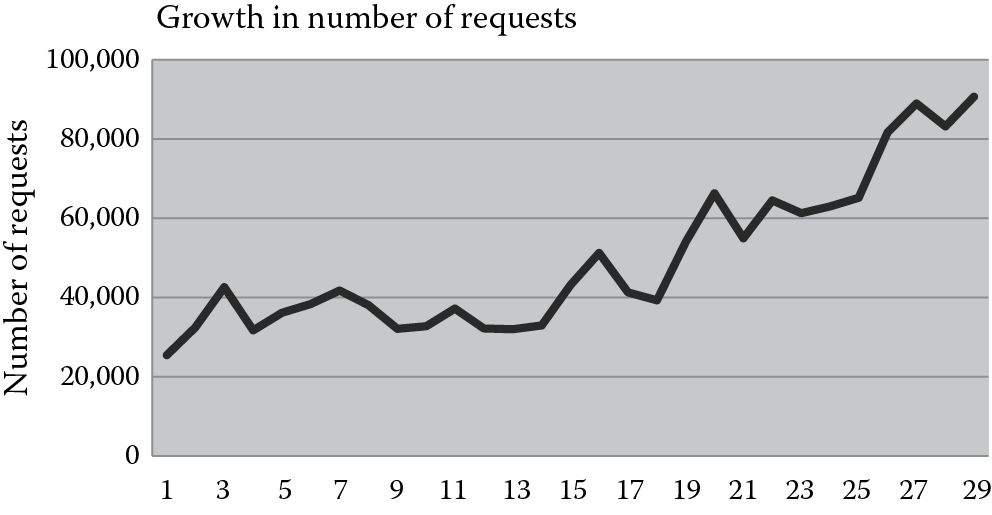
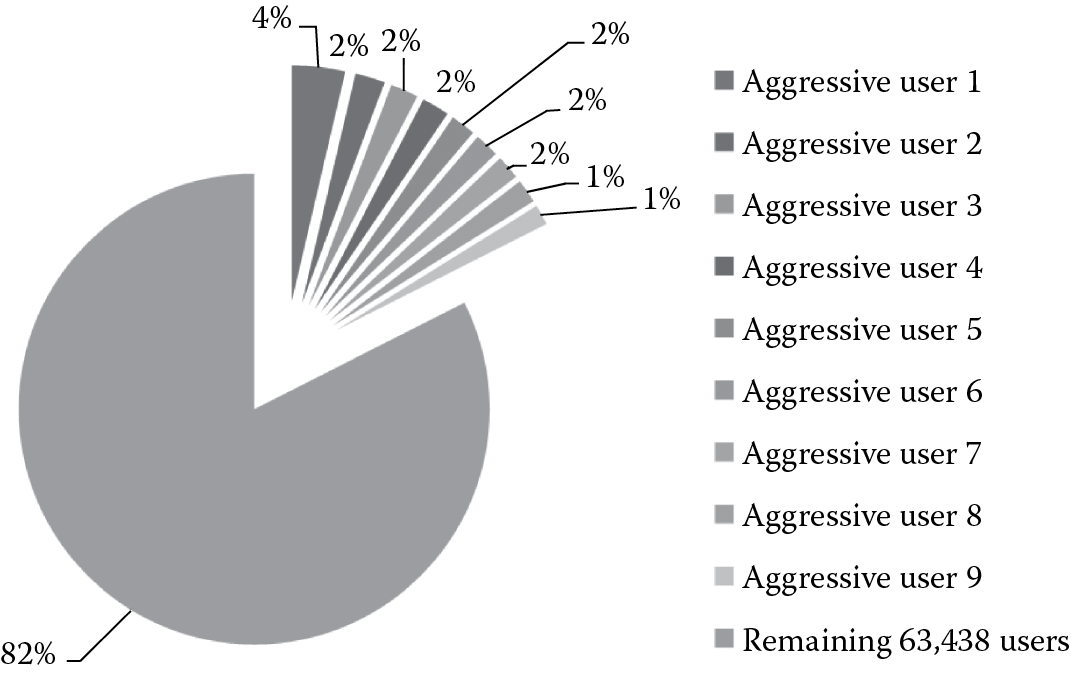
In the conventional system, user behavior was more conservative and cautious because of the high cost of requesting satellite images. For example, all users tried to avoid redundant requests because they did not want to pay for the same satellite images more than once. Therefore, users carefully tracked what satellite images they have requested. Meanwhile, users would not request satellite images without a specific research purpose, because the requested images were usually paid out of a research grant and the payment needed to be approved by a project manager. Additionally, users were unlikely to request a substantially large number of satellite images due to the budget limitation. However, in the new system, with the “Imagery for Everyone” policy, there is no cost for users requesting satellite images. This greatly influences the characteristics of users and their behaviors. First, the number of users grows significantly. Before the new policy was announced, there were only hundreds of users, and most of them were from the United States. The new EROS system serves hundreds of thousands of global users now. Figure 21.3 shows the rapid growth of monthly download requests since September 2008. It can be observed that the workload of the EROS system (in terms of the number of requests) has been quadrupled in the first 29 months after applying the free download policy, and this growth is expected to be continuous in the future. Second, users behave rather aggressively and randomly in the new system. Figure 21.4 shows the analysis results of more than 60,000 users. We find that the number of requests sent by the top nine users account for 17.5% of the total number of requests. These users can be classified as aggressive users. On the other hand, the majority of users only request one or two satellite images, and they rarely come back to request again. These users can be classified as random users. In addition, we observe that among the 2,875,548 total requests, 27.7% of them are duplicated requests. Users send redundant requests because there is no cost on their side and they do not need to track what satellite images have been requested and what have not.
21.3.6 The New System Architecture
In order to provide a high-quality and no-cost satellite imagery distribution service to global users, EROS designed the following new system architecture (as shown in Figure 21.5), which addresses most of the aforementioned challenges. This new architecture contains four major modules: the User Request Handler; the Work Order Handler; the Hybrid Storage Subsystem (including the FTP server, the Storage Area Network or SAN for short, and tapes); and the Satellite Image Processing Subsystem.
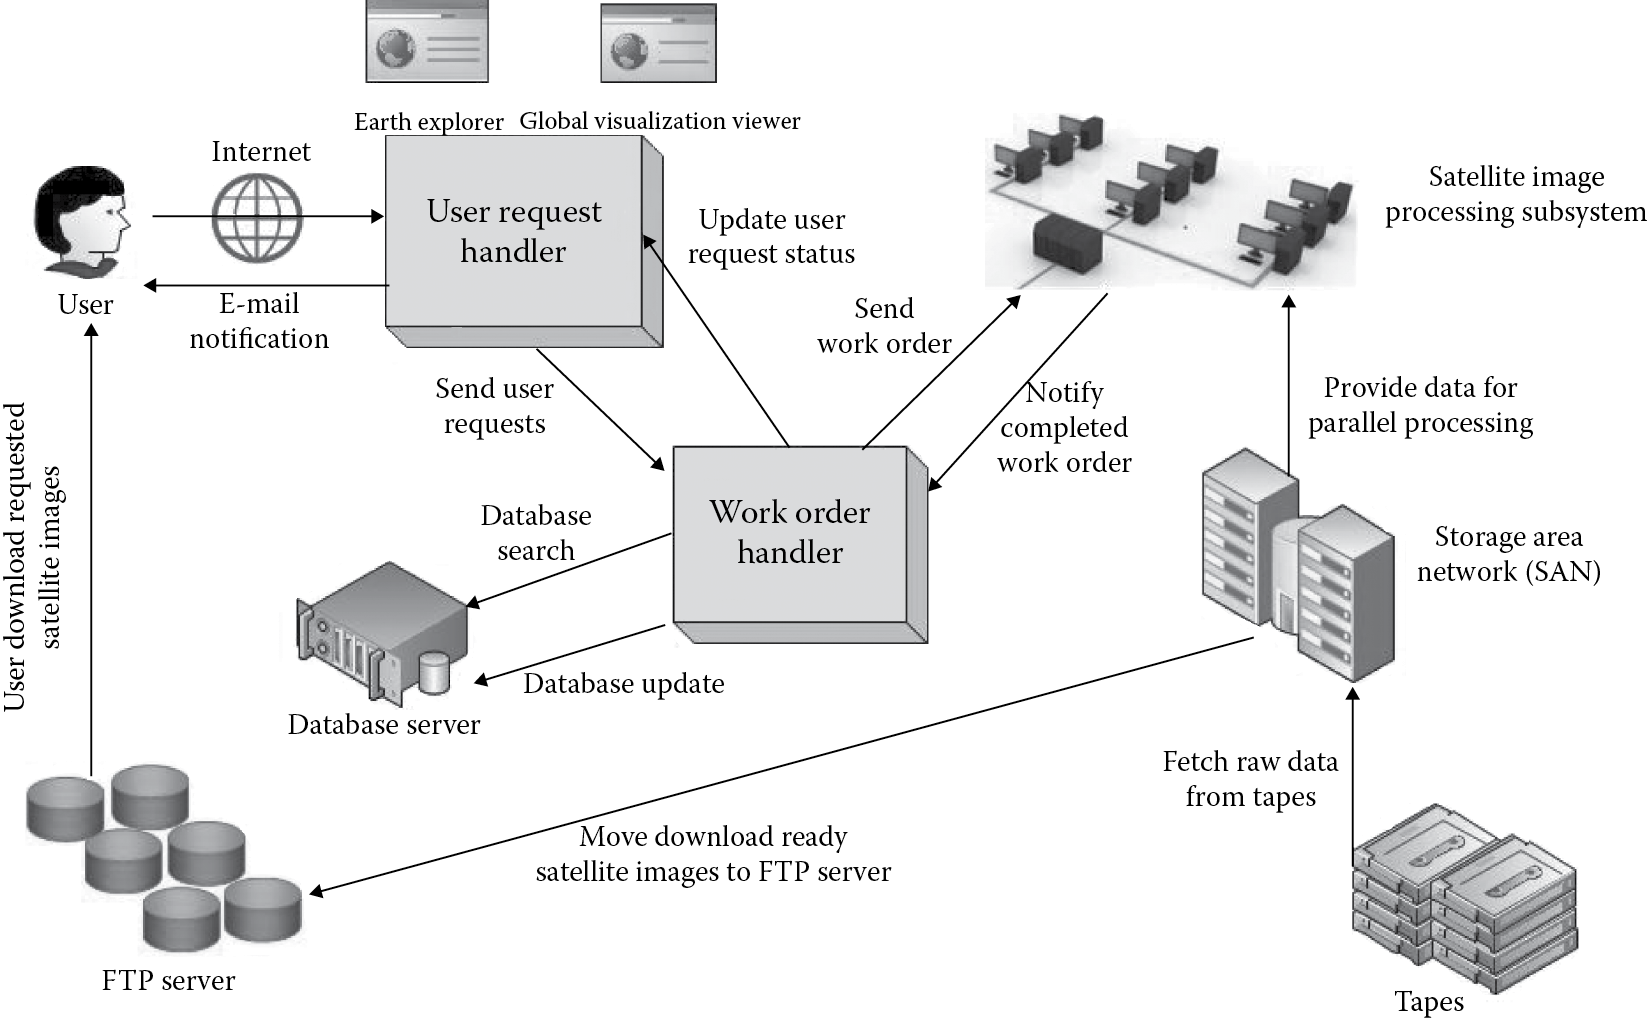
User Request Handler and Workorder Handler: Global users are able to send their satellite image requests via the EarthExplorer [4] or the Global Visualization Viewer [5] web portal. The user requests will be forwarded to the Workorder Handler. The Workorder Handler will determine where are the requested satellite images. If the requested satellite images are present in the FTP server, the User Request Handler will send an e-mail to users with the download links to the requested satellite images. If, however, a satellite image cannot be found in the FTP server, a “work order” is generated and sent to the Satellite Image Processing Subsystem, which must fetch the corresponding raw data from the magnetic tapes to the SAN and apply appropriate filtering and processing algorithms to create the download-ready satellite images. Once a work order is completed, the download-ready satellite images will be moved to the FTP server, and a notification e-mail (with download links) will be sent to the user. After receiving the e-mail, users will be given at least 7 days to download their requested images. In other words, the system will not delete a satellite image that is not older than 7 days even when the FTP server is full. Since the size of each requested satellite image is generally greater than 200 MB, this asynchronous e-mail notification mechanism successfully improved the usability of the EROS system because users do not have to worry about not being able to download the requested satellite images immediately.
Hybrid Storage Subsystem: In the new architecture, the USGS EROS stores its massive satellite images in long-term archived (LTA) format using a tiered storage subsystem. Table 21.1 outlines the tiered storage components in the USGS EROS satellite imagery distribution system. The raw data of all satellite images are first stored in the tape system. Once a satellite image is requested, its raw data will be found in the tape system and then loaded to the SAN system composed of hard drive disks (HDDs) for image processing and optimization. The processed images will then be fetched to the FTP server for downloading.
Hybrid Storage Subsystem Architecture
|
Tier |
Model |
Hardware |
Capacity |
Bus Interface |
|
1 |
Sun/Oracle F5100 |
SSD |
100 TB |
SAS/FC |
|
2 |
IBM DS3400 |
HDD |
1 PB |
SATA |
|
3 |
Sun/Oracle T10K |
Tape |
10 PB |
Infiniband |
Since the EROS system is highly data intensive and the majority of requests will be “read” operations, the use of solid state disks (SSDs) in the FTP server layer can significantly reduce the data transfer time once the satellite images are ready. However, the high cost of SSDs also sets the capacity limitation of FTP servers. Currently, the total amount of satellite data of EROS is at the petabyte level, while the current storage capacity of the FTP server is designed at the terabyte level. Therefore, only a small portion of satellite data can reside in the FTP server, and the large chunk of data have to be stored in the low-cost tape system. If the requested satellite images reside on the FTP server, users can download them almost immediately. However, users may need to wait for 20–30 minutes if the requested images are missing on the FTP server (i.e., they are stored on tapes in the form of raw data). To improve the quality of the satellite data distribution service, EROS has to make every effort to identify and keep the most popular satellite images on the FTP server. Most importantly, this process needs to be automatic and highly efficient. Manual data selection is impossible for petabytes of data. Meanwhile, the slow response time of the tape system may become the system bottleneck. Therefore, data mining–based prefetching, which will be discussed in Section 21.4.2, appears to be an appropriate technique for further improving the performance of EROS’s new system.
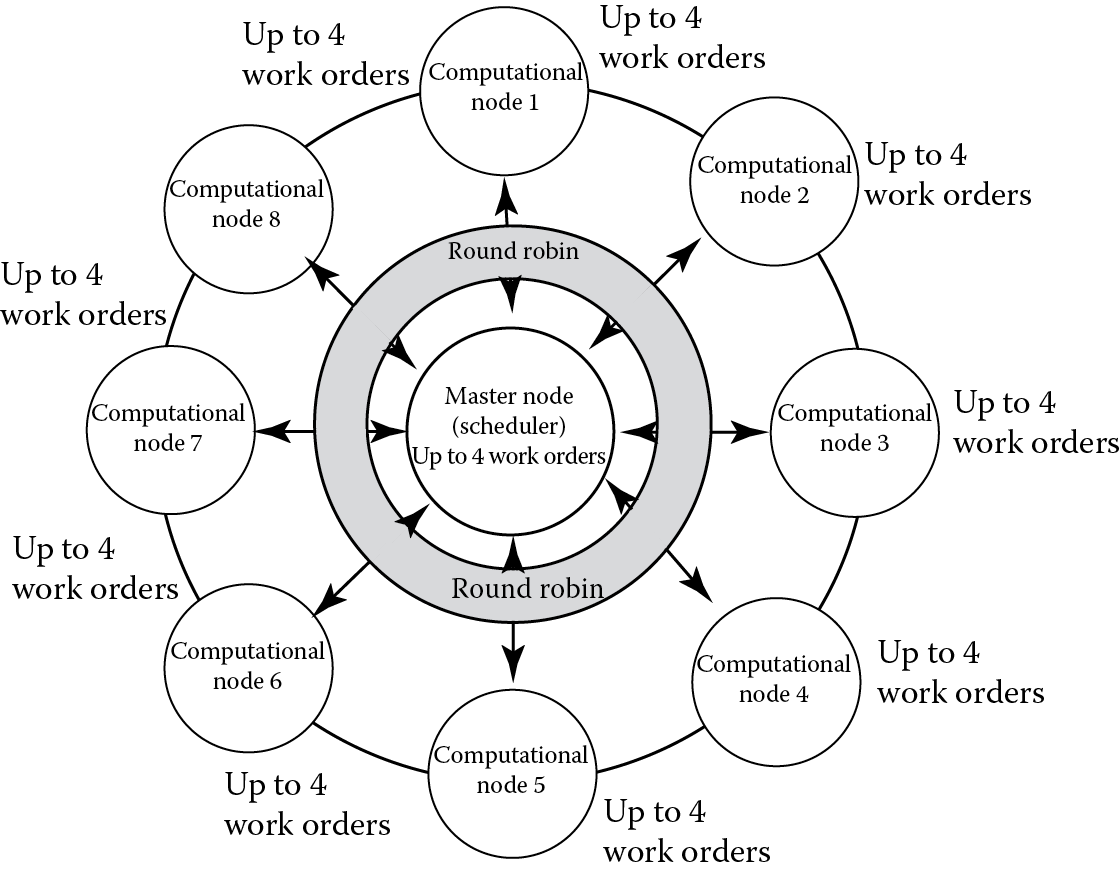
Satellite Image Processing Subsystem: The satellite image processing subsystem consists of nine computational nodes, and each node contains eight cores. One of the computational nodes serves as the master node, and the other eight computational nodes are slave nodes. When the requested satellite images cannot be found at the FTP server, one or more work orders will be issued by the master node. Here, a work order is a basic job executed by a core, which contains 15 different algorithms for raw satellite data preprocessing and image optimization. The master node decides how to schedule work orders to slave nodes based on the round-robin scheduling algorithm, which is shown in Figure 21.6. Specifically, the scheduler will calculate the number of work orders being executed on each slave node in a round-robin way. The next work order will be allocated to the first identified slave node that runs less than four work orders. If all slave nodes are busy (four work orders are running simultaneously in each slave node), the work order will be allocated to the master node if it runs less than four work orders. Otherwise, the work orders will be put in the waiting queue. Did you notice in Figure 21.6 that only half of the available cores are utilized and wonder why not utilize all the eight cores of each node? This question will be answered in Section 21.5 as one of the lessons we learned. It is also worth noting that the work orders running on different cores have no knowledge about other corunning work orders, even for those work orders scheduled on the same node. In other words, the execution flow and data flow of different work orders are completely isolated and work in an arbitrary way, which may cause potential cache and memory contention problems as discussed in Section 21.5.
21.4 Using Big Data Analytics to Improve Performance and Reduce Operation Cost
Although the new architecture successfully automates the satellite data processing work flow and handles significantly increased workload, EROS still needs to continuously identify system bottlenecks and improve the efficiency of its system because the user space as well as the data volume keep growing. The good news is that EROS has collected millions of download requests from its global users after the new policy was applied in September 2008. These data have great potential (if analyzed correctly) to help EROS better understand user behaviors and download patterns, which in turn can facilitate EROS to further improve system performance and reduce operation cost.
In this section, we provide details on how to find the user download patterns by analyzing historical requests and how can these patterns help improve the quality of the EROS satellite imagery distribution service.
21.4.1 Vis-EROS: Big Data Visualization
Before we discuss the motivation of the Vis-EROS project, it is worth restating several facts that we have discussed in Section 21.3. First, the size of the FTP server (100 TB) is merely 1% of the size of the tape system (10 PB), which means that only a small portion of the satellite images can reside at the FTP server. Second, the penalty of missing a satellite image in the FTP server is very high (approximately 20–30 minutes) because finding and processing a satellite image from its raw format to a download-ready format is very time consuming. Therefore, effectively caching and prefetching popular satellite images on the FTP server will be paramount in further improving the performance of the EROS system. However, there are several questions that need to be answered before designing any caching or prefetching algorithms: (1) Do popular images really exist? (2) How long will they stay popular? (3) How can we find them easily? The primary goal of the Vis-EROS project [6] is to find out answers to these questions.
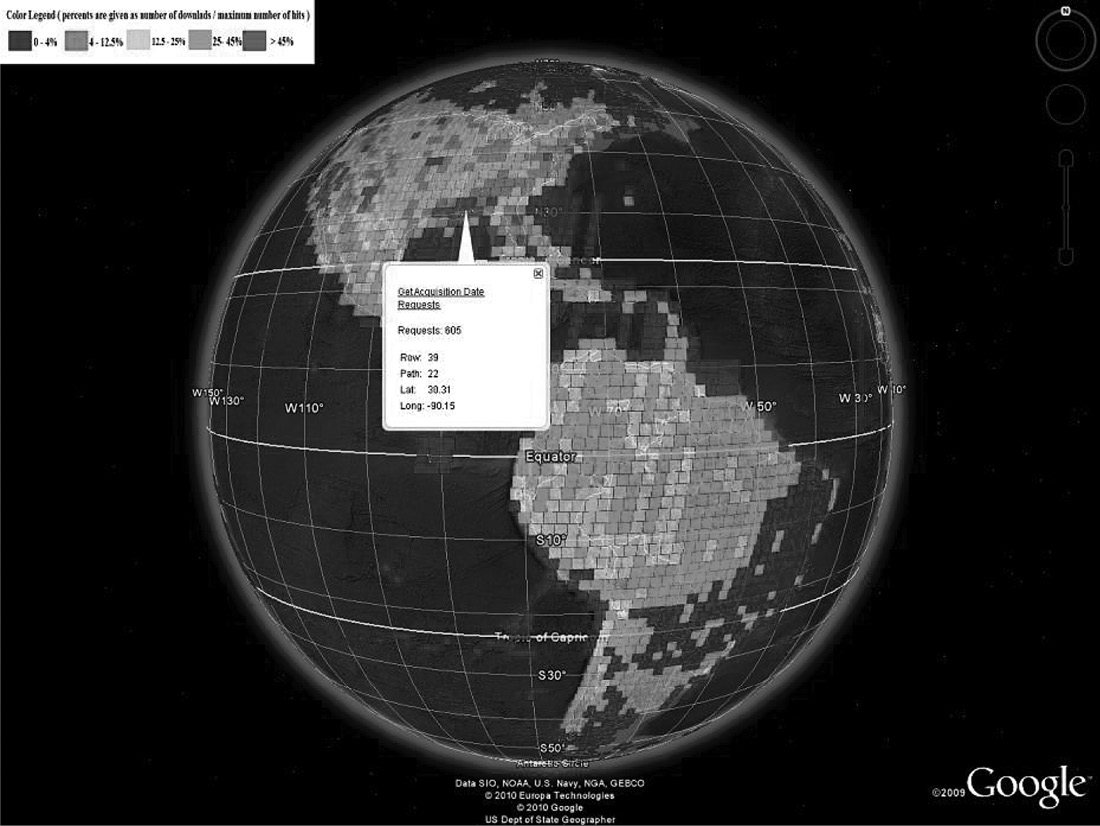
Since each satellite image has a unique geographical ID (i.e., the combination of row and path), we realized that existing data visualization techniques can be leveraged to visually represent and identify the “hot spots” (i.e., popular satellite images) on Earth. Compared to plain text data, visualized data communicates information much more clearly and effectively. There are two free tool kits that we can choose to visualize the EROS download patterns. The first one is Google Earth [7], which is a widely used visualization tool kit that provides an exploratory interface to a rich series of spatial data sets. Google Earth displays information specified by the Keyhole Markup Language (KML) [8], which is an extensible markup language (XML) grammar and file format for modeling and storing geographic features such as points, lines, images, and polygons. The second choice is NASA World Wind [9], which was developed by NASA using the Java software development kit (SDK). It uses Java OpenGL (JOGL) [10] to render the globe and display visualization results.
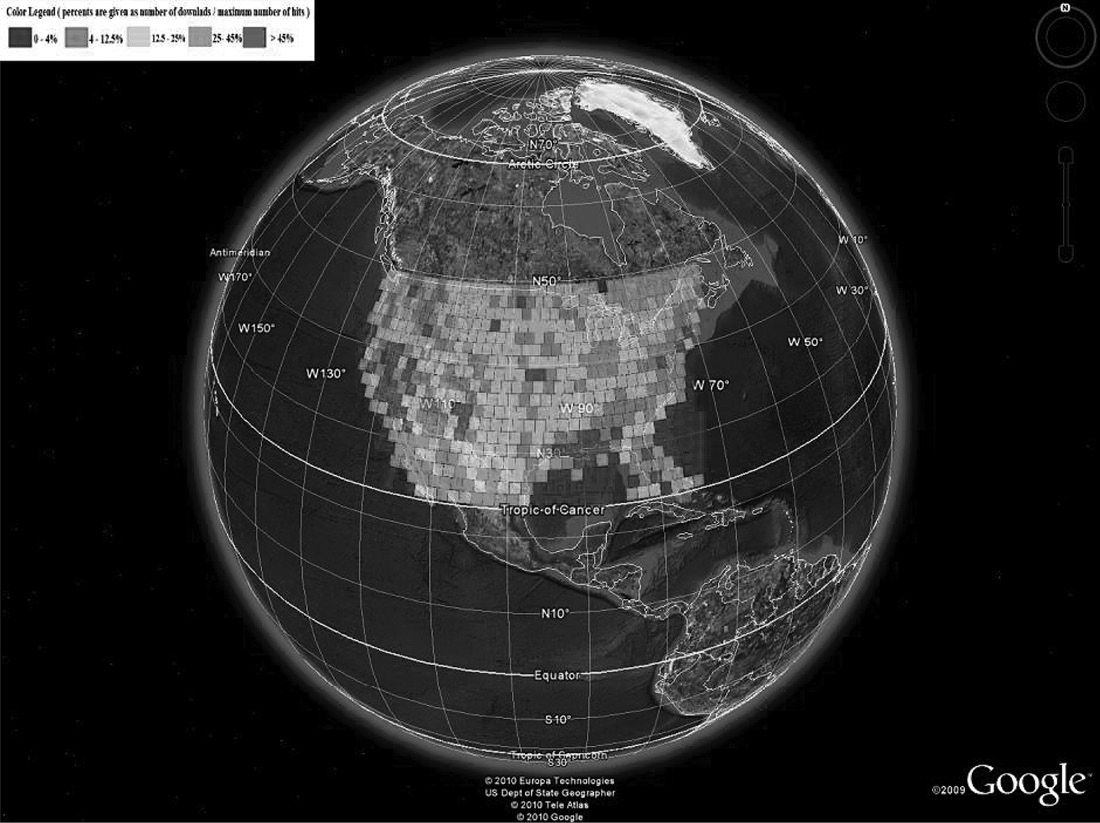
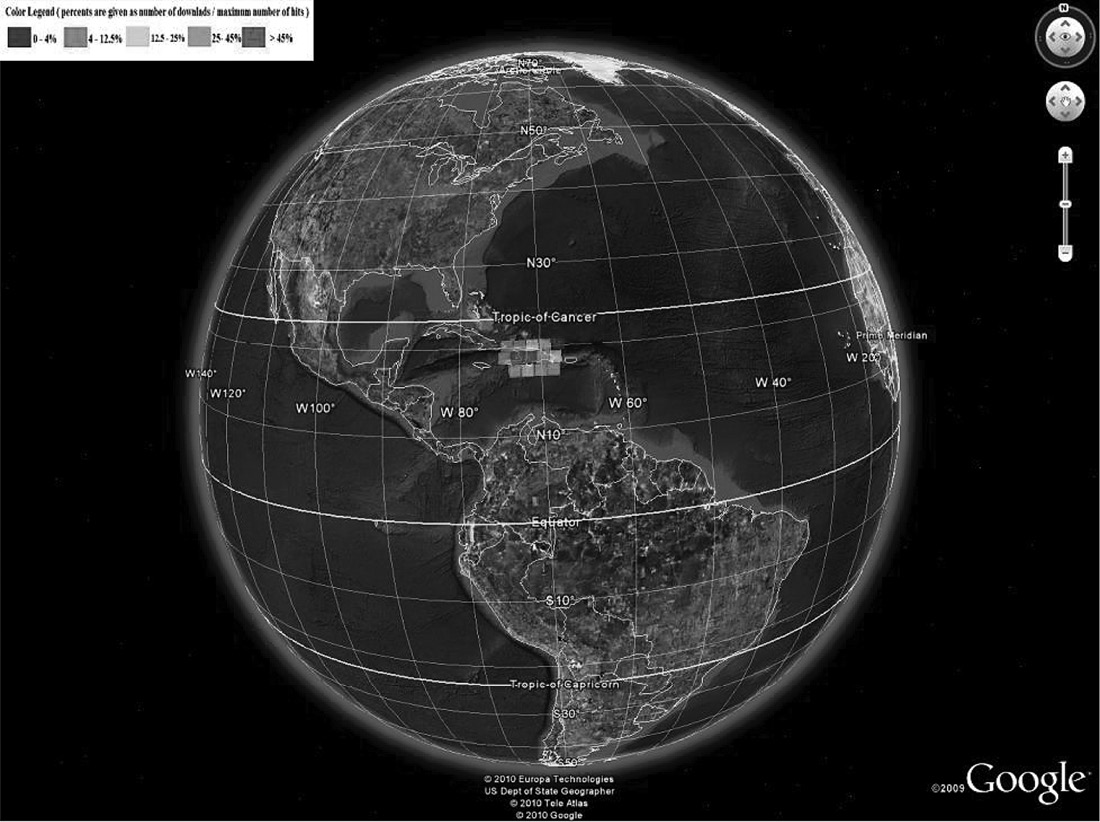
At the beginning, we were not sure which visualization tool kit would be more appropriate for our needs. Therefore, we started two separate projects focusing on each of them. Figure 21.7 illustrates the first generation of visualization results of EROS data using Google Earth (right) and NASA World Wind (left). Although NASA World Wind has its advantages (e.g., fine-grained control when rendering the globe), it turns out that Google Earth is easier to use and program. Therefore, in the second generation, we only optimized the Google Earth version, which includes a better color rendering algorithm and the capability of displaying visualization results of a smaller region. Note that the satellite images marked in brighter color indicate that they are more popular. Figure 21.8 shows the visualization results of North America and South America, and Figure 21.9 shows the visualization results of the United States. Figure 21.10 demonstrates the hot spots of Haiti after the 2010 earthquake. Here, we do not include detailed information about how we visualized the EROS data using Google Earth and NASA World Wind, simply because visualization techniques are not the focus of our discussion here. Readers can visit the Vis-EROS website [6] and refer to our papers [11,12] for implementation details. Our focus in this chapter is to discuss how visualization can help with Big Data analytics.
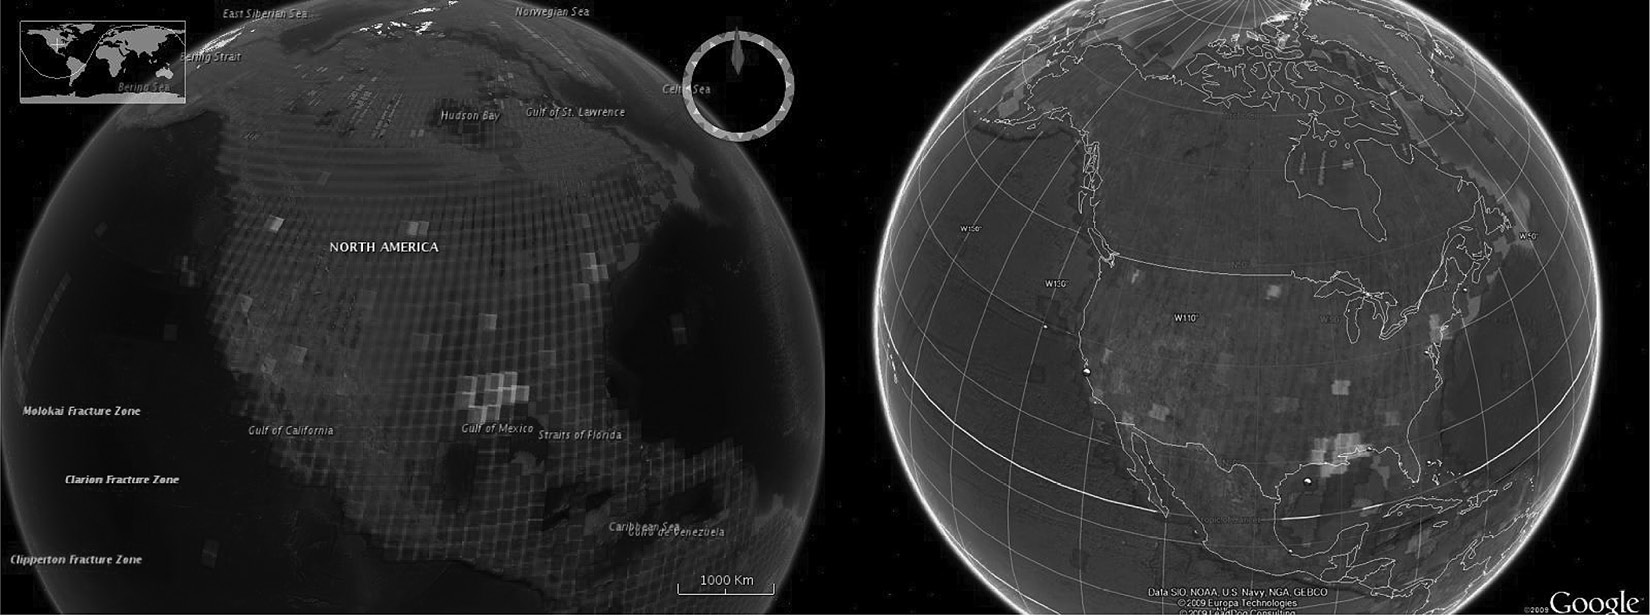
Visualization of EROS global download requests in NASA World Wind (left) and Google Earth (right). The bright color indicates a large number of requests for this area.
The Vis-EROS project clearly answered the aforementioned questions. Popular images do exist, and they can be identified without sophisticated algorithms. The popularity of images evolves over time. For example, before the Haiti earthquake happened, no satellite images of Haiti were considered popular. However, the location of the earthquake did become popular after the event. The Vis-EROS project provides strong evidence that caching and prefetching techniques can improve the performance of the EROS system by preprocessing, loading, and keeping popular images in the FTP servers.
21.4.2 FastStor: Data Mining-Based Multilayer Prefetching
The FastStor project is conducted after the Vis-EROS project is completed. The primary goal of the FastStor project is to develop effective caching and prefetching algorithms that can preload the popular satellite images before the arrival of user requests and keep the popular satellite images in the cache (i.e., the FTP server) as long as possible. This relies heavily on accurate analysis and prediction of user download behaviors. The Vis-EROS project laid a good foundation for that purpose, and it provided a list of valuable observations:
- Few users request many images, while many users only request a few.
- Very few images are very popular, while most of them are unpopular.
- The popularity of images evolves over time. Newly captured images tend to be more popular than old images in general.
- Some image requests are triggered right after important global events (e.g., earthquake, tsunami, and forest fire).
- Images of extreme historical events stay popular (e.g., UFO crashing and Chernobyl nuclear power plant explosion) for many years.
More details about our analysis report can be found in Reference 13. With these observations in mind, we started searching for techniques that can achieve high performance of the EROS system. During this process, we encountered a series of challenges and pertinent problems, several of which are listed as follows.
- Will cache optimization techniques that are typically applied to very small caches still remain effective when the cache is orders of magnitude larger?
- New satellite data are added to the EROS system every week, and user download patterns evolve over time. What techniques can effectively catch newly emerged patterns with a continually increasing set of information?
- EROS currently has a large number of global users. Some users show aggressive behavior by requesting a large number of images frequently, while others only download very few images and never come back. Will it be possible to identify patterns of each user, and can user-specific algorithms improve system performance?
We decided to address these problems one by one. First, we narrowed down our focus to the caching algorithms. We studied the impact of three widely used cache replacement algorithms, namely, First In First Out (FIFO), Least Recently Used (LRU), and Least Frequently Used (LFU), on system performance using historical user download requests. These algorithms determine which images will be evicted from the FTP servers when the maximum capacity is reached. Specifically, FIFO evicts the earliest entry in cache when cache replacement happens. No action is taken on cache hits (i.e., if an entry in a cache gets requested again, its position does not change). The LRU algorithm removes the least recently used entry in a cache when it is full. LFU exploits the overall popularity of entries rather than their recency. LFU sorts entries by popularity. The least popular item is always chosen for eviction.
After observing and analyzing the results generated from the real-world data provided by EROS [14], we concluded that traditional approaches to caching can be used to successfully improve performance in environments with large-scale data storage systems. Throughout the course of evaluation, the FIFO cache replacement algorithm frequently resulted in a much lower cache hit rate than either LRU or LFU. The LFU and LRU algorithms result in similar cache hit rates, but the LFU algorithm is more difficult to implement. Overall, we found LRU to be the best caching algorithm with the consideration of both performance and ease of implementation.
Prefetching is another technology that has the potential to significantly increase cache performance. Prefetching offsets high-latency input/output (I/O) accesses by predicting user access patterns and preloading data that will be requested before the actual request arrives. In fact, previous studies have shown that an effective prefetching algorithm can improve cache hit ratio by as much as 50% [15].
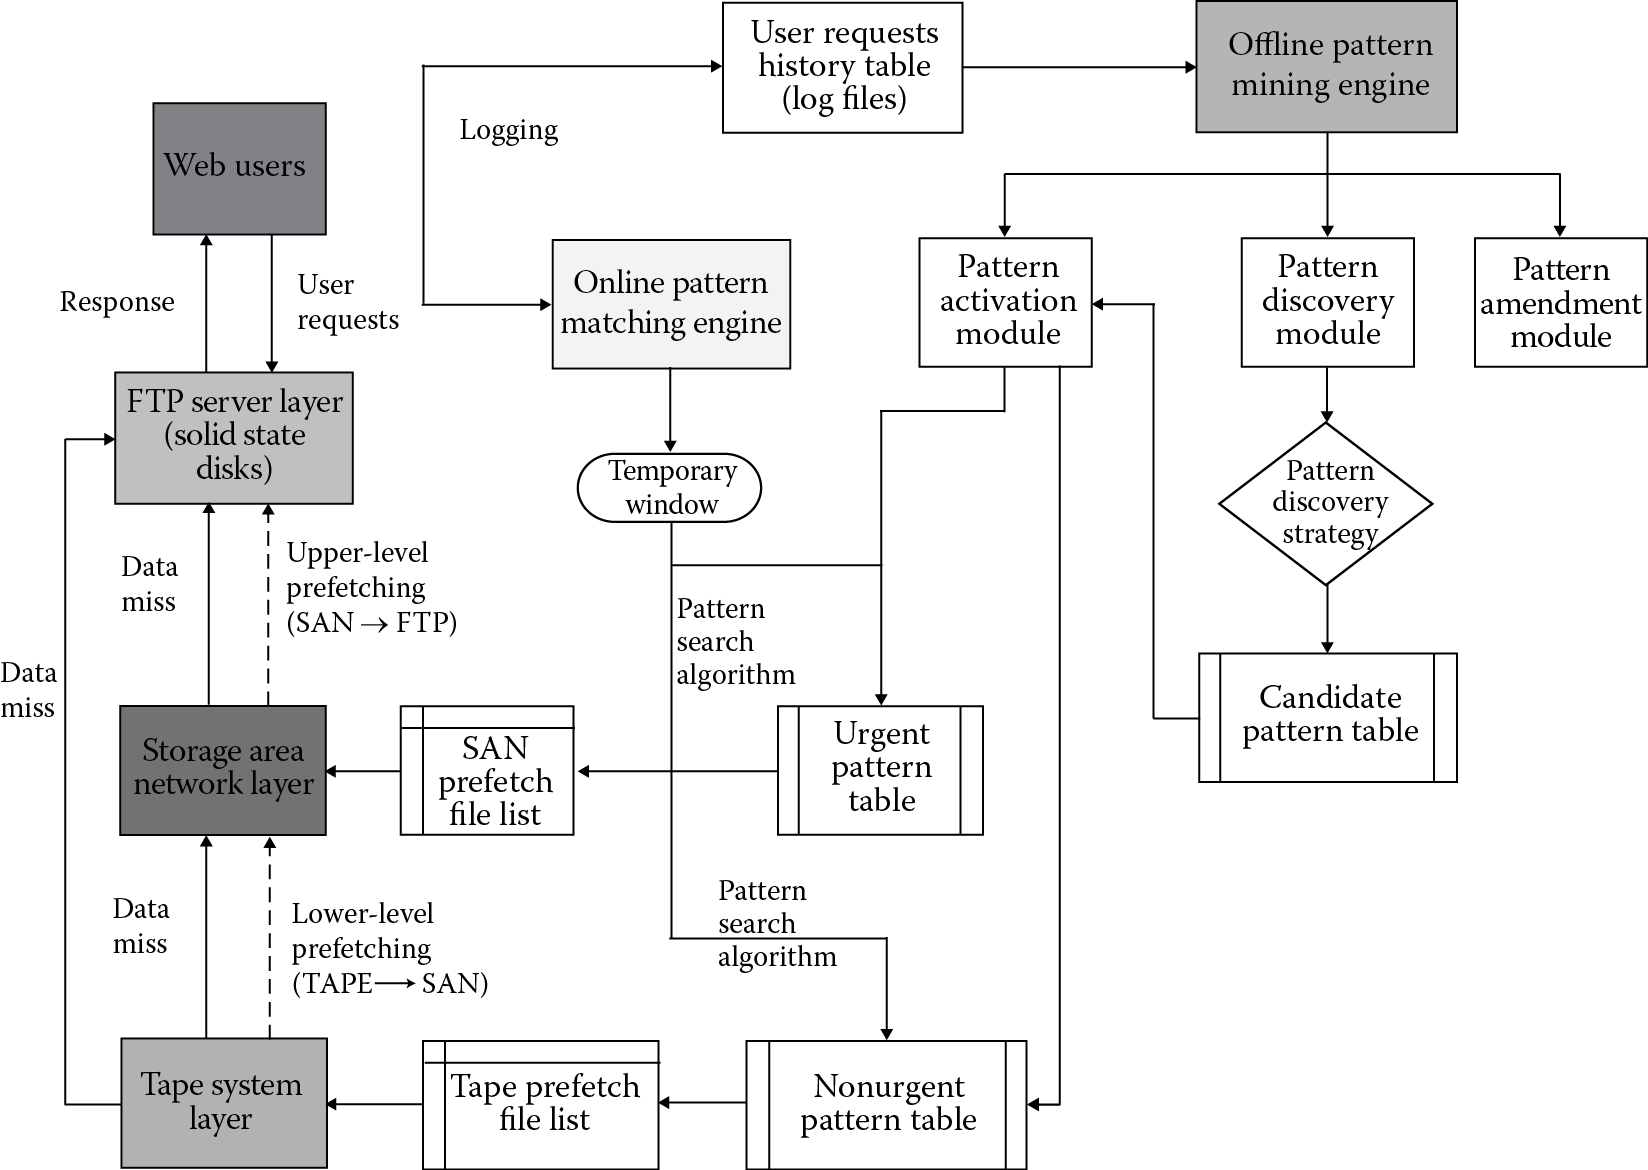
Initially, we proposed a data mining–based multilayer prefetching framework (as shown in Figure 21.11), which contains two engines, the offline pattern mining engine and the online pattern matching engine. More specifically, the offline pattern mining engine contains three modules: the pattern discovery module, the pattern activation module, and the pattern amendment module. The pattern discovery module takes the user request history table, applies pattern discovery strategy, and generates the candidate pattern table. The candidate patterns will not take effect until the pattern activation module activates them. Based on the priority or urgency of requested files, the candidate patterns will be categorized into urgent patterns and nonurgent patterns. The activated urgent patterns and nonurgent patterns will be sent to the Urgent Pattern Table and Nonurgent Pattern Table, respectively. The upper-level prefetching will prefetch the satellite images generated by the pattern search algorithm based on the Urgent Pattern Table, and the lower-level prefetching file list should be generated from the Nonurgent Pattern Table. This framework appeared to be overly complicated when we tried to implement it. More importantly, it missed some critical factors (e.g., evolvement of popularity and consideration of aggressive users) that need to be considered. In the real implementation, we did not differentiate patterns based on urgency, because it is very hard to determine which pattern is urgent and which is not. Also, we dropped the online pattern matching engine because it usually does not have a sufficient number of requests to analyze within the given window and it is fairly expensive to keep it running all the time.
Meanwhile, we implemented two specific prefetching algorithms in our emulator, which are called Popularity-Based Prefetching and User-Based Prefetching. In the Popularity-Based Prefetching algorithm, we distinguished archived popular images from current popular images. An archival popular image usually owes its popularity to historically significant events that occurred in the past. For example, the satellite image of Chernobyl falls into this category. A current popular image is popular because users are interested in the newly captured scene. For example, research monitoring the effects of global warming may request the newest images of Greenland as soon as they become available. In this case, it would be beneficial to prefetch new satellite images of Greenland once they are available.
The User-Based Prefetching algorithm is designed based on the important observation that EROS users behave significantly differently. Some users downloaded thousands of satellite images while others only sent requests once and never came back again. Therefore, prefetching rules generated based on one user’s pattern may not be suitable for another user at all. With this in mind, we designed the User-Based Prefetching algorithm that generates prefetching rules based solely on that user’s historical request pattern. Although this will result in more accurate prefetching results, generating separate rules for each user is a very ambitious goal because of the nature of EROS data. There are six attributes in each request that together uniquely identify a satellite image. These attributes are, in order, satellite number, satellite sensor, row, path, acquisition year, and acquisition day of year. Users can switch their download pattern in any of these dimensions between two requests, which makes it really hard to establish the pattern library for each user. Additionally, this process must be completed in O(n) time, considering the size of the EROS user space.
Our solution is to represent each important attribute of a request as an integer. Then, we concatenate all six attribute integers to create a single long integer that represents a unique satellite image. Having a long integer representation of an image where each set of digits corresponds to a different attribute allows for a simple subtraction of two images that captures the movement in the multidimensional space. Then, we can treat these movements as prefetching rules. For example, if a user requests two images 7-1-100-100-2000-100 (an image in row 100 and path 100, captured on the 100th day of year 2000 by the first sensor of Landsat 7) and 7-1-101-099-2000-100, we subtract the second image from the first one and get the following movement: 711010992000100 − 711001002000100 = 9990000000. The difference, 9990000000, uniquely represents the movement of +1 path and −1 row because every other attribute stays the same. This simple digitalization solution reduces the time complexity of the prefetching algorithms to O(n), which allows us to effectively evaluate the impact of our proposed prefetching algorithms on performance. To further reduce the overhead caused by prefetching, we set three thresholds to limit the number of the prefetched images. The user popularity (UP) threshold filters out users that only request very few satellite images. In other words, prefetching should apply to users who have sent a sufficient number of requests. The window size (WS) threshold sets the number of recent requests considered for rule generation. WS also ensures that prefetching rules are generated from recent patterns only. The rule confidence (RC) threshold is set to filter out infrequent rules in the window. Our experimental results presented in Reference 16 (and shown in Table 21.2) demonstrate that the EROS system can maintain the same level of performance with 31.78% power savings and $8 million reduction in capital cost (for purchasing another 100 TB of SSDs) by using our proposed popularity-based and user-specific prefetching algorithms, compared to doubling the size of the FTP server farm.
Summary of Average Monthly Performance, Power Consumption, and Electricity Cost
|
Cache Configuration |
Avg. Monthly Hit Rate |
Avg. Monthly Power (watts) |
Avg. Monthly Cost ($) |
|
100 TB LRU, no prefetching (current) |
65.86% |
13,908,620 |
1127 |
|
100 TB LRU with prefetching |
70.26% |
13,748,657 |
1114 |
|
200 TB LRU, no prefetching |
69.58% |
20,152,915 |
1632 |
|
200 TB LRU with prefetching |
71.83% |
17,052,688 |
1381 |
21.5 Conclusions: Experiences and Lessons Learned
The forthcoming era of Big Data will bring significant challenges to conventional ways of capturing, storing, analyzing, and managing information. In this chapter, we conducted an in-depth case study on how USGS EROS handles its big satellite data for the world’s largest satellite imagery distribution system. We also provided a unique example of how could a changed policy significantly affect the traditional ways of Big Data storage and distribution and discussed how the USGS EROS swiftly overcame the new challenges. More importantly, we revealed in detail how can data visualization and data mining techniques be used to analyze the characteristics of millions of requests and improve the performance, cost, and energy efficiency of the EROS system.
During the course of conducting this Big Data project, we have obtained numerous valuable experiences, which are listed as follows:
- Experience #1: Big Data is not scary. Even for a large-scale system like EROS, it can adapt to the new challenges rather quickly via careful planning and well-thought designing.
- Experience #2: Big Data analytics is worth exploring because it has great potential to improve the quality of service and reduce cost.
- Experience #3: Data visualization techniques sometimes can be very helpful in finding hidden patterns, and many freely available visualization tool kits are available.
- Experience #4: Big Data analytics is complicated. It will take substantial efforts to Figure out a working solution. Do not be overly aggressive at the beginning. Take one step at a time. For example, in our case, the Vis-EROS project served as a pilot project that provided support for further efforts and created excitement.
- Experience #5: Having a comprehensive understanding of user behavior or system workload will help greatly in proposing suitable algorithms for a large-scale system like EROS. Our proposed Popularity-Based Prefetching and User-Based Prefetching algorithms are both inspired by our user behavior analysis and workload characterization results.
- Experience #6: If there does not exist a solution that can significantly improve system performance, combining different methods that individually have small improvements on the system can add up to make a noticeable overall increase in system performance. For example, we achieved about 70% hit rate on the FTP server with LRU alone. By applying the current Popularity-Based Prefetching algorithm, we were able to achieve an extra 2% improvement. Finally, we improved the FTP server hit rate to more than 76% by combining the LRU, Popularity-Based Prefetching, and User-Based Prefetching algorithms altogether.
- Experience #7: The proposed algorithms for large-scale systems must be highly efficient. An algorithm with a time complexity larger than O(n2) will not be feasible to implement. Fast but simple solutions are always preferred (e.g., representing a user request using a long integer significantly reduced the time needed to complete User-Based Prefetching).
Meanwhile, we also learned several lessons from our study, listed as follows:
- Lesson #1: Think twice before physically expanding the existing system. The cost of maintaining a Big Data system is fairly expensive. Do not scale the system up when the number of users grows rapidly, although it is the easiest solution. It is wise to span the entire hardware and software stack to see if performance can be improved before investing on new hardware. For example, the EROS user space grew nearly 400% in the first 3 years. To guarantee performance, the managers can choose to double the size of the FTP servers. However, our experiments showed that the EROS system could maintain the same performance with over 30% energy savings as well as $8 million direct cost reduction (for purchasing an additional 100 TB of SSDs) by utilizing our proposed prefetching algorithms, compared to the alternative solution of doubling the size of the current FTP server farm.
- Lesson #2: Understanding the workload will help in reducing hardware cost and improve hardware utilization. Recall that in Section 21.3, we mentioned that only four cores of the eight-core node can be used simultaneously; this is because the typical data file required by each work order is several hundred megabytes. Cores within the same socket could race for cache resources. Additionally, cores within the same node may also fight for memory resources if too many work orders are assigned to the node. Even worse, cache contention could further cause a thread thrashing problem, which may lead to unpredicted server downtime. The current solution is to limit the number of work orders simultaneously running on each computational node to four, which will degrade the potential peak performance by almost 50%. EROS would be able to purchase more nodes with fewer cores if this problem was identified earlier. These problems will still exist or even get worse when the application is ported to many-core systems with Intel Many Integrated Core (MIC) coprocessors or NVIDIA GPU accelerators. Fortunately, EROS did not invest on the coprocessors/accelerators.
- Lesson #3: The volume and variety of Big Data prefers the simplicity of any implemented framework or algorithms. A complicated framework (e.g., the original data mining–based prefetching framework presented in Figure 21.11) probably needs to be simplified before it can be deployed at Big Data systems.
- Lesson #4: It is possible that no existing solutions can be applied directly to solve your specific problem. Before we started developing our own prefetching algorithms, we spent substantial amount of time on evaluating several well-known data mining and machine learning algorithms, which include market basket analysis (MBA) [17], C4.5 [18], KNN [19], naive Bayes [20], Bayes networks [21], and support vector machines [22]. However, no performance improvement is achieved when using all possible combinations of input features. These widely used techniques failed because of the unique characteristics of EROS data and user behaviors.
We hope that readers can benefit from our previous experiences and lessons and have a successful Big Data practice in their own organizations.
Acknowledgments
The work reported in this chapter is supported by the US National Science Foundation under grant nos. CNS-1212535 and CNS-0915762. We also gratefully acknowledge the support from the US Geological Survey (USGS) Earth Resources Observation and Science (EROS) Center, who provided us the global user download requests. We also thank the reviewers for their helpful comments. Any opinions, findings, and conclusions or recommendations expressed in this study are those of the author and do not necessarily reflect the views of NSF or USGS.
References
1. National Aeronautics and Space Administration (NASA) Landsat Program Introduction. Available at http://landsat.gsfc.nasa.gov/.
2. U.S. Geological Survey (USGS) Landsat Program Introduction. Available at http://landsathandbook.gsfc.nasa.gov/handbook/handbook_htmls/chapter1/chapter1.html.
3. Available at http://landsat.usgs.gov/documents/USGS_Landsat_Imagery_Release.pdf.
4. USGS Global Visualization Viewer. Available at http://glovis.usgs.gov/.
5. Earth Explorer. Available at http://earthexplorer.usgs.gov/.
6. Vis-EROS. Available at http://cs.txstate.edu/~zz11/viseros/.
7. Google Earth. Available at http://www.google.com/earth/.
8. KML. Available at https://developers.google.com/kml/.
9. NASA World Wind. Available at http://worldwind.arc.nasa.gov/java/.
10. Java OpenGL. Available at http://en.wikipedia.org/wiki/Java_OpenGL.
11. Z. L. Zong, J. Job, X. S. Zhang, M. Nijim, and X. Qin, “Case Study of Visualizing Global User Download Patterns Using Google Earth and NASA World Wind,” Journal of Applied Remote Sensing, vol. 6, no. 1, p. 061703, 2012. doi: 10.1117/1.JRS.6.061703.
12. G. D. Standart, K. R. Stulken, X. S. Zhang, and Z. L. Zong, “Vis-EROS: Geospatial Visualization of Global Satellite Images Download Requests in Google Earth,” Journal of Environmental Modelling and Software (ENVSOFT), vol. 26, no. 7, pp. 980–982, 2011.
13. B. Romoser, R. Fares, P. Janovics, X. J. Ruan, X. Qin, and Z. L. Zong, “Global Workload Characterization of A Large Scale Satellite Image Distribution System,” In Proceedings of the 2012 IEEE International Performance Computing and Communications Conference (IPCCC12), Austin, TX, December 2012.
14. R. Fares, B. Romoser, Z. L. Zong, M. Nijim, and X. Qin, “Performance Evaluation of Traditional Caching Policies on A Large System with Petabytes of Data,” In Proceedings of the 7th IEEE International Conference on Networking, Architecture, and Storage (NAS 2012), Xiamen, China, June 2012.
15. A. Nanopoulos, D. Katsaros, and Y. Manolopoulos, “A Data Mining Algorithm for Generalized Web Prefetching,” IEEE Transactions on Knowledge and Data Engineering, vol. 15, no. 5, pp. 1155–1169, 2003.
16. B. Romoser, Z. L. Zong, R. Fares, J. Wood, and R. Ge, “Using Intelligent Prefetching to Reduce the Energy Consumption of A Large-Scale Storage System,” In Proceedings of the IEEE International Performance Computing and Communications Conference (IPCCC 2013), San Diego, CA, December 2013.
17. Available at http://en.wikipedia.org/wiki/Market_basket_analysis.
18. Available at http://en.wikipedia.org/wiki/C4.5_algorithm.
19. Available at http://en.wikipedia.org/wiki/K-nearest_neighbor_algorithm.
20. Available at http://en.wikipedia.org/wiki/Naive_Bayes_classifier.
21. Available at http://en.wikipedia.org/wiki/Bayesian_network.
22. Available at http://en.wikipedia.org/wiki/Support_vector_machine.