
Because you can find a lot of documentation on the Internet about JMeter, the load generator, I have tried to limit this chapter to include either features with little documentation available, or features that newcomers rarely seem to pick up, even if they are well documented.
The objectives for this chapter are:
- Get comfortable using JMeter by creating small test scripts in a tiny sandbox environment using just your desktop.
- Understand that learning a few particular JMeter features can quickly advance you from a beginner to an intermediate/advanced user.
- Understand that once JMeter is installed, extra plugins from jmeter-plugins.org and other places are required to make it really useful.
I see a lot of people start to use JMeter and not get very far with it, and that is frustrating for me because I have seen what a capable load generator it is. To address this, the guided tours in this chapter will propel beginning JMeter users into the realm of intermediate and advanced users.
But wait, there is more.
“Hello World!” programming experiments are great for getting started learning a technology, and JMeter has exactly this kind of sandbox that you can use to try out its features. If you know about this sandbox (most don’t), it takes just 20 seconds (I’m not exaggerating here) to create a little test in the sandbox and learn (and even perfect) your approach to answering these and many other JMeter questions:
- How do you increase load?
- How do you graph throughput?
- How do you conditionally execute something based on a value in a script variable?
- How do you read data (like SUT user names/passwords) from a .csv text file into JMeter script variables?
So keep an eye out for the sandbox later in the chapter.
This is a JMeter-only chapter, so if you are already sold on your own load generator, then by all means, proceed to the next chapter. But before you leave, please read my “love letter to JMeter” and see if your load generator has all of these features, ones that I rely on for tackling difficult performance problems. It is tough for me to imagine how other load generators (and other software developers) make do without this fantastically broad set of features, all open source. I sure hope the commercial (and other) load generator competition takes note of this high bar. For reference, here are some other popular load generators; the last three are commercial ones.
Faban
The Grinder
Gatling
Tsung
jmh
HP Performance Center (aka ‘Load Runner’)
Load UI
Silk Performer
Since a single chapter does not a training plan make, I recommend using this chapter to supplement other JMeter training you might find at jmeter.apache.org or in JMeter books (Performance Testing with JMeter, by Bayo Erinle (Packt Books, 2015; ISBN-13 = 978-1787285774) or JMeter Cookbook, by Bayo Erinle (Packt Books, 2014; ISBN-13 = 978-1783988280). The good citizens of the Internet, God bless them, also have their own compendium of training material, which is an irrefutable sign that JMeter is a vital organ in the body of the performance discipline at large:
- “Load Testing with JMeter: Part 1 - Getting Started,” ( https://lincolnloop.com/blog/load-testing-jmeter-part-1-getting-started/ )
- “Learn JMETER from Scratch -(Performance + Load) Testing” ( https://www.udemy.com/learn-jmeter-from-scratch-performance-load-testing-tool/ )
- “Introduction to JMeter” ( https://www.guru99.com/introduction-to-jmeter.html )
- “JMeter - Quick Guide” ( http://www.tutorialspoint.com/jmeter/jmeter_quick_guide.htm )
- “JMeter getting started” ( https://www.youtube.com/watch?v=KI6u5pclYIw )
- “Getting Started WIth JMeter” ( https://www.youtube.com/watch?v=dJw8sBk_wSo )
- “How To Use Apache JMeter To Perform Load Testing on a Web Server” ( https://www.digitalocean.com/community/tutorials/how-to-use-apache-jmeter-to-perform-load-testing-on-a-web-server )
- “A quick howto to setup JMeter” ( http://zacster.blogspot.com/2008/03/quick-howto-to-setup-jmeter.html )
Love Letter to JMeter
Your load generator
might have one or two of the following features, but JMeter is the only one that has them all, touting a feature set robust enough to be shared by QA and developers. It would take many volumes to show you all of this material, so this chapter will showcase just a few of the more important ones in this list.
- Right alongside standard load gen metrics (response time, throughput, and so on), JMeter can graph all kinds of other metrics:
- JMX metrics from your SUT ( https://jmeter-plugins.org/wiki/JMXMon/ ). For example, this will show you whether you are maxed on out your web container threads, as detailed in Chapter 4 on load anti-patterns.
- CPU, RAM, network, disk metrics from all popular OSes (using PerfMon ( https://jmeter-plugins.org/wiki/PerfMon/ ) and SIGAR).
- SIGAR also enables you to graph CPU consumption per PID (operating system process ID). If you have more than one Java process on a machine, this will show which one is eating all the CPU.
- Load-test anything you want: simple Java programs, HTTP/S applications, JMS apps, a ton of SQL statements, TCP Socket servers, and many others ( http://jmeter.apache.org/usermanual/component_reference.html ). The JMeter term for the JMeter Test Element that knows how to test to each of these is a Sampler.
- WS-Security. If your client has to encrypt your WS-Security message, then your load generator must also ( https://github.com/tilln/jmeter-wssecurity )
- Advanced Graphing :
- Put any two (or more) metrics together on a single graph ( https://jmeter-plugins.org/wiki/CompositeGraph/ ). Three metrics with three different units of measure with auto-scaling? No problem. This helps identify how one metric impacts another. You can even take metrics from two different tests and put them onto the same graph ( https://jmeter-plugins.org/wiki/MergeResults/ ) for compelling before-after visualizations. For example if your throughput maxes out because you are out of CPU, you can get a single graph that contains the ugly throughput cap at the exact time the CPU hits 100%. That is a very compelling graph!
- Do you distrust averages? You should. You can use Frequency distributions ( https://jmeter-plugins.org/wiki/RespTimesDistribution/ ) and percentile graphs ( https://jmeter-plugins.org/wiki/RespTimePercentiles/)to show response time metrics without “average lies.”
- On the Settings panel ( https://jmeter-plugins.org/wiki/SettingsPanel/ ), you can tweak graph granularity, axis scale, colors, and more.
- Generate load from any OS with a JVM.
- Record JMeter test results locally to a text file or to a centralized database ( http://jmeter.apache.org/usermanual/realtime-results.html ).
- The following automated performance test platforms have JMeter integration and reporting:
- A variety of ways to deploy load generators :
- From a single machine:
- Quick and easy, default approach: Create a load script with Java UI and then generate load and view graphs.
- Generate load ( http://jmeter.apache.org/usermanual/get-started.html#non_gui ) on a headless machine, using a premade test plan. Transfer the raw results back to your desktop for analysis, or just generate the .png images of the graphs headlessly for later analysis.
- Distributed Testing ( http://jmeter.apache.org/usermanual/jmeter_distributed_testing_step_by_step.pdf ). From multiple machines, with a central JMeter controller. Load over a few thousand TPS might be too much for a single generator.
Using jmeter-plugins.org Is a Must
To be frank
about it, I would have ditched JMeter long ago without Andrey Pohilko’s 1 incredible jmeter-plugins.org, which is a set of additional tools and graphs and things that plug right into JMeter. I suppose I’m a little biased; I contributed a few hundred lines of code, myself.
The project started way back in 2009, so it’s pretty stable. Chapter 6, on the Scalability Yardstick, relied heavily on JMeter Plugins. The CPU consumption was from JMeter Plugins
, as well as the thread groups that draw the nice stair-steps for an incremental load plan. Remember when I mentioned the two approaches to installing this? I talked about installation using the Plugin Manager or by unzipping jar files for a single plugin into JMETER_HOME/lib/ext.
Here are two other installation approaches that I think are just as important as the first two:
- Use the “old style” releases. First surf to https://jmeter-plugins.org/downloads/old/ . Then download both JMeterPlugins-Standard-N.N.N.zip and JMeterPlugins-Extras-N.N.N.zip and unzip them into JMETER_HOME. The jar files in the zip must end up in the same folders (/lib or /lib/ext) as specified in the .zip files.
- Use Maven. Not only does this approach install jmeter-plugins, it does a full JMeter install too! Look in the littleMock repository for pom-load.xml. Instead of launching JMeter with JMETER_HOME/bin/jmeter.bat, you use my trivial little loadGui.cmd / .sh (also in the littleMock repo). I borrowed most of pom-load.xml from some kind soul on the Internet. The maven plugin used is very well named: jmeter-maven-plugin. Thank you, Internet. You’ll find pom-load.xml in the root folder of https://github.com/eostermueller/littleMock .
Please use the first technique (“old style”) to install JMeterPlugins on your own workstation to view the .jmx scripts for this chapter. Those .jmx files are in the sampleJMeterScripts/ folder of this repo:
I refer to this as the jpt repo.
Consider this everyday problem: Let’s say you create a JMeter load script (a .jmx file) that uses a few jmeter-plugins. When your cube neighbor who does not have JMeter-Plugins installed tries to run your .jmx file, they will get cryptic errors that do very little to highlight the missing dependency.
The two install approaches above help with this. Maven is not always easy to use, but the above pom-load.xml is wonderful—it will download, on the fly, any dependent JMeter-Plugins specified as a <dependency> in the pom-load.xml file.
The moral of this story is that sharing your .jmx file, alone, is prone to cryptic dependency issues. Sharing both your .jmx file and your customized pom-load.xml file fixes all of that. But another way to discover JMeter is to use the JMeter Plugins Plugin Manager, one of the install techniques mentioned in Chapter 6. Here is the URL for quick reference:
If you have the PluginsManager installed (see above), it will prompt you with “Your test plan requires the following plugins” when it discovers a .jmx file that references a JMeter Plugin you don’t have installed. Then, it will give you the option to actually install in or abort.
The load-pom.xml mentioned above does a full JMeter install and also let’s you specify the dependent Plugins in use. Alternatively, you can also use this script to install all plugins in a specific plan file:
PluginsManagerCMD install-for-jmx/home/username/jmx/testPlan.jmx
This is really helpful for automated, lights-out perf testing, but keep in mind that even the PluginsManagerCMD has its own install process here:
https://jmeter-plugins.org/wiki/PluginsManagerAutomated/
In Chapter 2, I showed you how to graph the CPU consumption of individual PIDs. To do that, download and install this plugin—this part enables just the graphs, not the collecting of CPU data:
Then use the ServerAgent to collect data that will display on the graphs: Download ServerAgent-N.N.N.zip from
Unzip it onto any machine (any platform) from which you want to collect metrics. When you start the startAgent.sh (or startAgent.bat), it listens for a connection on port 4444 from the JMeter GUI (or headless) process on your desktop. It is extremely well behaved, cross platform and easy to use.
The StartAgent captures RAM
, network and other metrics—not just CPU. There are a number of other JMeterPlugins, detailed next.
PerfMon
In Chapter 3 I talked about how metrics answer three basic questions for us:
- 1.How utilized are our hardware resources?
- 2.Which component is to blame for a particular performance problem?
- 3.Does the end user benefit? Which code change performs better?
Load generators
were specifically designed to answer the third question about meeting performance requirements. The jmeter-plugins.org PerfMon component also provides high-level answers to the first question. When I say high-level, I mean CPU, RAM, and network consumption and a little more than that (
https://jmeter-plugins.org/wiki/PerfMonMetrics/
). Here is how it works.
For starters, no administrative or root permissions are required to run startAgent.bat (Listing 7-1). This process consumes very few resources, so it is safe to launch this process and forget about it for days or months.
# ./startAgent.sh
INFO 2016-02-21 14:03:05.061 [kg.apc.p] (): Binding UDP to 4444
INFO 2016-02-21 14:03:06.064 [kg.apc.p] (): Binding TCP to 4444
INFO 2016-02-21 14:03:06.069 [kg.apc.p] (): JP@GC Agent v2.2.0 started
Listing 7-1.
Startup banner for serverAgent, which provides hardware utilization data for JMeter
Figure 7-1 shows how to add a JMeter graph that connects to the serverAgent and display a CPU graph.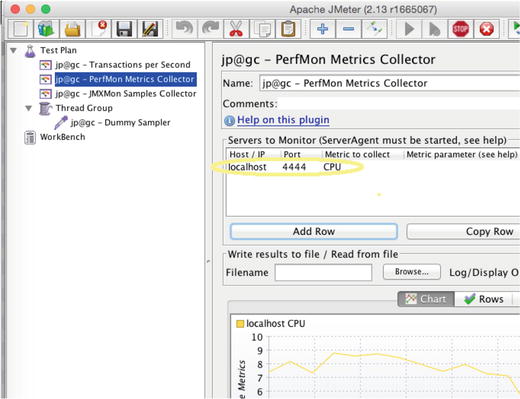
Figure 7-1.
To capture great CPU, RAM, and other hardware metrics, just point PerfMon to the host and port (default port is 4444) where you have unzipped and started the serverAgent
So, JMeter helps answer two
out of three of the metric questions. You can even make a case that it answers the remaining question, about which component is to blame for a particular performance problem. How? Check out these other metrics available that you can graph in JMeter.
The JMXMon plugin graphs JMX metrics in JMeter:
It is an unfortunate coincidence that the file extension for the JMeter load plan (.jmx) is the same three letters as the abbreviation for Java Management Extensions (JMX)
, a monitoring API. JMX the monitoring API isn’t very popular right now, but Spring Boot’s Actuator is. It delivers great JVM health metrics in json-over-http messages. The following page shows how you can enable Actuator in Spring Boot by adding a simple dependency to your Maven pom.xml Spring Boot file:
Then, you can use the following JMeterPlugin to graph Actuator data in JMeter:
JMX and Actuator data can point to a number of problems inside your JVM, thus helping answer the “which component is to blame” question. So JMeter and JMeterPlugins
help provide all three kinds of metrics. Impressive.
JMeter user.properties Is Your Friend
From time to time
, I discover JMeter properties that tweak JMeter’s default configuration in some particular way. So that these property tweaks don’t get lost in the 45KB (as of JMeter version 2.13) of other properties in JMETER_HOME/bin/jmeter.properties, I segregate them into JMETER_HOME/bin/user.properties, where they override those in jmeter.properties.
Having them separate allows me to easily copy my user.properties file to new JMeter installations, giving me a more consistent installation.
Listing 7-2 shows my personal user.properties file with my favorite set of JMeter customizations that I recommend for all.
#Add this to avoid truncated HTTP & other responses in View Results Tree
view.results.tree.max_size=0
#Add this so the Active Threads over Time Listener will
#render from your .jtl file
jmeter.save.saveservice.thread_counts=true
#Add this to use the csv format (instead of XML) for jtl output files.
#This lowers jtl size, lowers JMeter CPU consumption during test
jmeter.save.saveservice.output_format=csv
#These csv field names make it much easier to read/understand .jtl files.
jmeter.save.saveservice.print_field_names=true
Listing 7-2.
A few of my favorite JMeter properties in a user.properties file that overrides jmeter.properties; both files reside in JMETER_HOME/bin
When you share your .jmx files with your friends, you also might want to share properties like the ones above. But you might instead want to use the pom-load.xml file, above, to specify any properties you want your friends to use. Check out the above pom-load.xml file for the syntax in Listing 7-3, which does the same thing as setting summariser.interval=5 in JMeter’s user.properties file
.
<propertiesJMeter>
<summariser.interval>5</summariser.interval>
</propertiesJMeter>
Listing 7-3.
A JMeter property that is specified in the jmeter-maven-plugin
You can use the technique in Listing 7-3 to specify any JMeter property. Here is a reference to all of JMeter’s properties:
JMeter Introduction
When I was starting out with JMeter, I wish I’d had a screenshot like Figure 7-2. An upscale framed copy on your wall is a bit overkill, but how about a photocopy taped to the bottom edge of one of your massive 42 inch monitors? The text I added to the screenshots shows basic load generation functionality, and the arrows point to the JMeter Test Element you will need to implement it. The first screenshot in Figure 7-2 is the blank slate you get when you start JMeter. To set up JMeter as you see in the second screenshot, you right-click on Test Plan and start adding things.
Figure 7-2.
How to get things done with JMeter Test Plan Tree. The First screenshot is a blank slate. Second screenshot is after right-clicking, adding many Test Plan Elements.
I must concede that the JMeter load plan tree, that tree-like structure on the left side of the main window, is a tough usability hurdle for new users. Users generally know the end result they’re after. For example, “apply 5 threads of load to two different SOA services over HTTP for 5 minutes, need response time and throughput times series graphs.” But to accomplish this seemingly straightforward goal, JMeter forces the uninitiated into an ugly little trial-and-error game that I call “Right-Clicking Education.” Intermediate users navigate this easily, but not beginners. In that left pane of the UI, you assemble a tree structure with funny named building blocks called Test Elements. (Thread Group, Dummy Sampler, View Results Tree, and so on). Each Test Element in the tree has a type, and it has to be precisely positioned according to a set of rules that a beginner knows nothing about. The Test Elements and the types (I work mostly with these types: Thread Group, Sampler, Listener, Assertion) and all of the individual Test Elements are documented here:
There is some nice high level documentation here:
http://jmeter.apache.org/usermanual/test_plan.html
Table 7-1.
Frequently Used Components
in a JMeter Load Plan
Name | Description | Example |
|---|---|---|
Listener | Graphs and other ways to display results | |
Thread Group | Configure how many threads of load are applied. Configure test duration. | |
Sampler | The doer. Do an HTTP request. Do a JMS request. Execute java code. | |
Controller | Controls the flow of your samplers, including “If” logic and looping logic | |
Assertion | Allows you to configure how JMeter
decides whether one run of a Sampler succeeded or failed. |
If you right-click on a particular Test Element, you’ll see what kind of child Test Elements you can legally add from that spot. So if your right-clicker has enough gusto on that day, you can right-click every node on the tree (sometimes
there are dozens or hundreds of blocks) and deduce and commit to memory the whole set of rules—which Test Element types can/should be the parents/children of other Test Element types. That’s a lot of right-clicking fun. Or not.
My point here is not to dish out a black eye to “the one I love.” Instead, it is to encourage you to avoid the pain of the Right-clicking Education. At first, start by relying on the help of others to structure your load plan tree. Specifically, you can use the screenshot in Figure 7-2 as a guide, or perhaps use the relatively new JMeter Template feature to start with a ready-made load plan tree, or just have a friend share their load plan (a .jmx2 file of a proprietary .xml grammar). To use the Template feature, start JMeter with an empty load plan tree, and then choose File ➤ Templates. Even with a lot of experience, I still rely on the Record template to record a new HTTP load script, because the tree structure is a little unique. You will soon become comfortable with which Test Elements go where, and you can then branch out (ha) and get more creative with your load plan tree structure
.
UI Features for Working Quickly
The quiverful of big red arrows
in Figure 7-2 all point to individual items, the Test Elements. Navigating, nay surfing, around all of those Test Elements is a breeze by simply using the arrow keys on your keyboard. Each Test Element has a particular Test Element type. All graphs, for example, are of the Test Element type Listener. Test Elements for submitting HTTP requests are called Samplers
. To make them easy to find, I stick all my graphs at the highest level (as children of Test Plan, the root). But let’s say I have inadvertently placed some graphs further down into the tree. There are a number of features you could use to quickly relocate them, and do other things as well:
- Drag and drop. The drag and drop implementation is surprisingly easy to use. Try it out for yourself, dragging a test element to either change the order of siblings or to change parentage altogether.
- Cut/Copy/Paste. Bill Gates’ familiar keyboard shortcuts (Ctrl+X, Ctrl+C, Ctrl+V) work very well. All three of these operate on both the selected node and on all its children.
- Multi-select. Shift+click (selecting adjacent Test Elements) and Ctrl+click (selecting non-adjacent Test Elements) work as you would expect.
- Duplicate the current Test Element. Need another test element just like the selected one? Ctrl+Shift+C adds a copy just below the current. This even works if you copy a parent test element that has many children.
- You can also quickly disable a single Test Element and all its children with the Enable/Disable/Toggle functionality, Ctrl+T.
- If you launch two completely different instances of the JMeter UI, you can effortlessly cut/copy/paste between the two trees.
All of this cut/copy/paste functionality is great for:
- Combining two load scripts. Start two instances of the JMeter GUI at the same time. Copy all the HTTP Request samplers from one instance to the other. I can’t overestimate how important this technique is. Here are three examples:
- The Load Generation overview in Chapter 4 showed a First Priority and Second Priority scripts. You can record First and Second Priority stuff in separate scripts, and then use this technique to append the HTTP Samplers (and other stuff) in the Second Priority to the script for the First.
- Every developer records their own business process, and this technique is later used to combine them all into a single script.
- When make code changes to a web page (like adding new required data entry), that often makes the .jmx file out of date. To update the script, record the new version of the web page in a separate, stand-alone .jmx file. Then carefully delete the outdated portion of the old script, and use this technique to copy/paste the new script into the old script.
- Rearranging components in the Test Plan. So that they are easy to see/find, I like to put all my graphs at the highest level (as children of Test Plan). If graphs get scattered around, I can easily use the arrow keys to surf around the load test plan, Ctrl+Click to multi-select the ones I want to move, then Ctrl+V them to the new location.
- Easily duplicate the currently selected node. Let’s say you have configured one Java Sampler and you want to create five others right long side it, as siblings. Just select your Java sampler, and hit Ctrl+Shift+C five times. Voila.
- I use the Toggle/Ctrl+T feature heavily. Let’s say I want to compare the performance of the code at two different URLs. I will create an HTTP Request sampler for each, and then run them one at a time, using Ctrl+T to switch the one that is enabled. If you avoid clearing out the results between runs, you’ll have a nice graph like this: (TODO: Need graph of two different samplers, run one at a time w/o clearing out results between runs).
Functional Validation During Load Test Using JMeter Assertions
The .jmx script
for this example is in the jpt github.com repo in this location:
sampleJMeterScripts/jpt_ch07_functionalValidation.jmx
In Chapter 5, I mentioned a half dozen situations where you should bite the bullet and discard the results of a test and rerun the entire thing. One of those potential reasons was lots of SUT errors. You’ll have to decide for yourself exactly what percentage
of errors triggers a redo.
But if your SUT fails silently or important client data is quietly omitted from an SUT web page, you might end up basing all kinds of decisions on really faulty data. To avoid that situation, please take the time to tell JMeter what constitutes a successful HTML response by adding JMeter Assertions to check the HTML responses for key pieces of text, like the title of a web page, or perhaps HTML text labels for a few key fields. Figure 7-3 shows how to add an Assertion.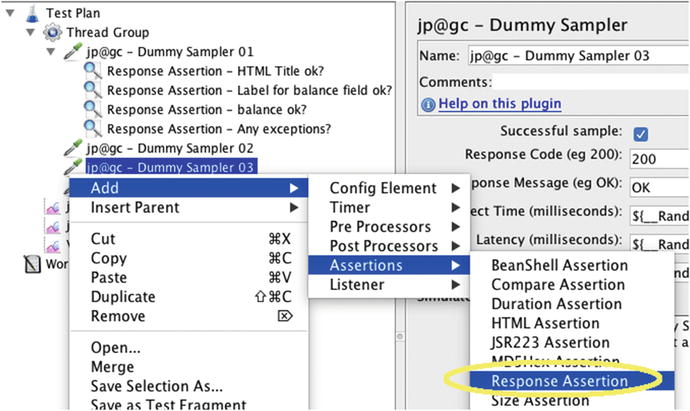
Figure 7-3.
Adding an Assertion. If the text in this Assertion is not found in the parent Sampler’s response, then JMeter will tally an error in the “Summary Report” and/or “Synthesis Report”.
Figure 7-4 shows how to enter the text to be verified. Before entering the text, you’ll need to first click the ‘Add’ button—bottom, center. If JMeter finds that the text you enter is missing from the corresponding HTTP response, it will tally an error. If your entire business process culminates in an “Order Submitted” message, this is your chance to validate that the system coughs up this all-important message. Don’t miss this chance.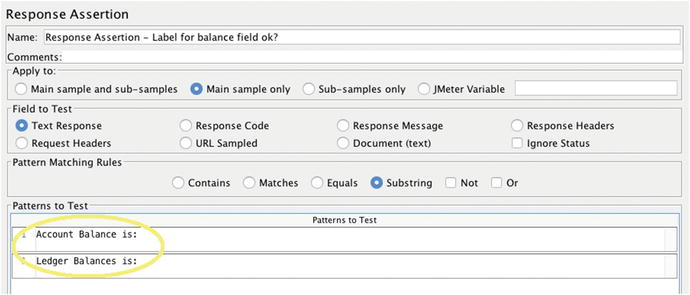
Figure 7-4.
A JMeter ‘Response’ Assertion. If you click ‘Add’ multiple times and add text on each line, JMeter will flag this sampler as having errored out if any of the lines of text are missing from the parent Sampler’s response.
It would be bittersweet, to say the least, if your application displayed “Order Submitted” immediately followed by “Fatal Exception / Your code failed.” You can add a second Assertion as shown in Figure 7-5 that flips the logic. Just mark the ‘Not’ flag and JMeter will tally an error if the given text, like ‘Fatal Exception’ is present.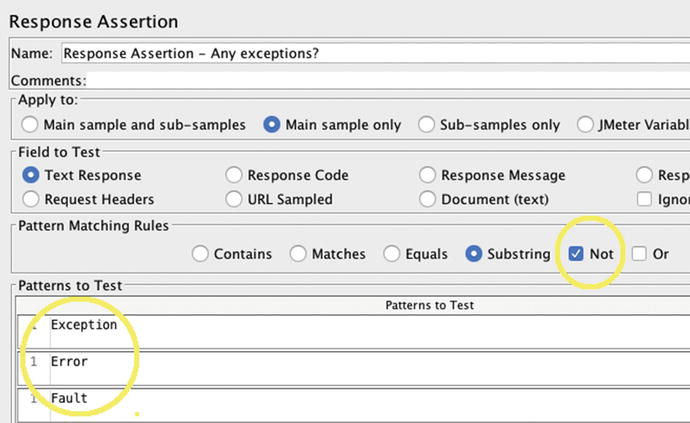
Figure 7-5.
A JMeter Response Assertion like in the previous Figure, but with ‘Not’ checked. This tallies an error if the given text, like and error message, is found in the Sampler’s response.
I have prematurely claimed performance victory before, only to later discover that 100% of the requests failed. Its pretty embarrassing; I don't recommend it.
Not only should you take the time to add Assertions, you also need to watch for error counts/percentages, where all Assertion failures and other errors (like HTTP errors) are recorded. Here are three components (there are probably others) that will help you track errors:
- jp@gc - Transactions per Second (from JMeter Plugins)
- Summary Report (Error % column)
- Synthesis Report (Error % column and from JMeter Plugins)
The Assertion discussed here (Figures 7-4 and 7-5) only checks for preordained list of strings. There are a number of other more sophisticated Assertions detailed here:
http://jmeter.apache.org/usermanual/component_reference.html#assertions
For example, the JSR223 Assertion lets you write code to validate any Sampler response.
Figure 7-6 shows a “Synthesis Report” with failed Assertions. The Synthesis Report from JMeter Plugins performs much better JMeter’s “Summary Report”, which lacks a few key columns like “like 90% response time.” The Sumary Report has less functionality and worse performance.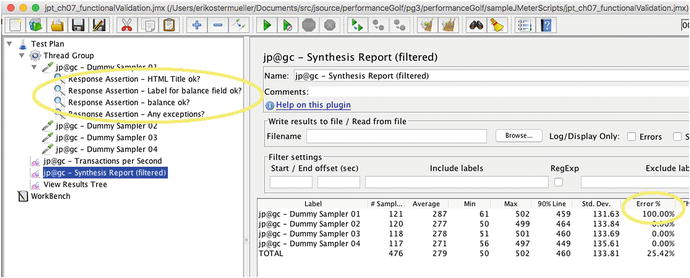
Figure 7-6.
A JMeter “Synthesis Report” showing errors tallied by Assertions in jpt_ch07_functionalValidation.jmx that comes with the jpt examples on github.com
Script Variables
Almost every script
I create has a few script variables, making it easier to run the script in different hardware environments. The MY_DIR variable shown in Figure 7-7 will be used in the following examples to indicate where to store JMeter output files on the machine where JMeter is running.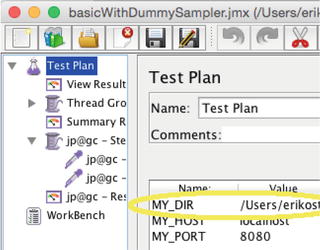
Figure 7-7.
Use a MY_DIR variable to store JMeter output files in the following examples
Figure 7-8 shows how to reference a variable. Practically all input boxes in JMeter, for either numeric or text data, like the one displayed here, will correctly resolve the value of a script variable—just don’t forget to wrap the variable name in the ${} syntax.
Figure 7-8.
When referencing a variable
like MY_DIR, you must wrap the name in special syntax: ${MY_DIR}. You can reference variables in just about any place where you can enter text data
Saving Performance Results to Disk
You can save/persist JMeter
results (response time, throughput, and so on) to disk in a few different ways. You will need this for many reasons, like comparing current performance to that of the last release, documenting performance defects, or showing throughput process to your peeps.
- Copy screenshots from the UI, which is quick. Keep in mind that with just a .png image of a graph, you lose ability to add other metrics, reset sampling granularity, rescale to zoom in, change colors, and so on.
- Save raw results to a text file—by convention JMeter uses a .jtl file extension. This is a bit more complicated (see details below), but you get great flexibility to re-envision your graph on the raw data. This flexibility is especially helpful if you don’t review your results until long after the tests have run. I often generate load on a headless machine. After the test, I’ll just copy the raw .jtl files back to my desktop to render in the JMeter UI. From a headless machine, you can even generate .png files ( https://jmeter-plugins.org/wiki/GraphsGeneratorListener/ ).
- Save results to central database ( http://jmeter.apache.org/usermanual/realtime-results.html , or http://www.testautomationguru.com/jmeter-real-time-results-influxdb-grafana/ ). Great approach to allow multiple users to view metrics during a live test, or for comparing results for multiple SUT releases (to keep all results in one place), or perhaps for an enterprise repository of all results. This is a relatively new approach, and I do not have any experience with it.
- When running headlessly, JMeter displays to stdout (and perhaps to JMETER_HOME/bin/jmeter.log) a small and rudimentary set of (non-configurable) performance metrics every 30 seconds—very helpful for short, quick tests. The Console Status Logger ( https://jmeter-plugins.org/wiki/ConsoleStatusLogger/ ) JMeter-plugin is no longer needed, because more recent versions of JMeter (certainly 2.13 and higher) display this data without even asking for it. There are a number of reasons why you’d want to run JMeter headlessly:
- Run headlessly because JMeter says so. When starting JMeter GUI, this message displays to the console window: “Don't use the GUI for load testing” (Figure 2-6). This is likely because GUI overhead might impact load test results. In my experience, load testing with the GUI and 10 requests per second or fewer has sufficiently low overhead.
- Run headlessly on the SUT so you can avoid network performance issues discussed in Chapter 2 on the Modest Tuning Environment. Avoid bandwidth limiters. Avoid multiple firewalls that might cause performance degradation. Avoid load balancers whose concurrency and other configuration has not yet been vetted for performance.
- Run headlessly so you can apply load to a headless SUT that has no TCP ports available to the outside world.
To save JMeter UI graphs to .png files, start by adding a graph to the test plan tree, as shown in Figure 7-9. For a nice “response time over time” graph, right-click on the root test plan and choose Add ➤ Listener ➤ jp@gc - Response Times Over Time. After you run the test, you can just right-click to copy the image of the graph to the Clipboard
or to the file system.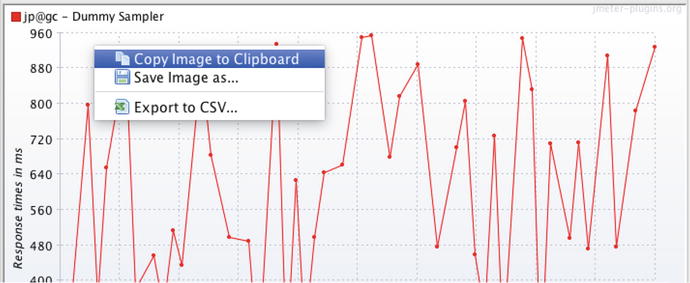
Figure 7-9.
Just right-click on a JMeter-Plugin graph to save the image to the Clipboard or to the disk
The second way to save your test results is to have JMeter save the raw data to the disk. The .jtl file extension is a nice convention, although it is not enforced. For saving data to .jtl files, you can use the same graph as Figure 7-9 by specifying it as shown in Figure 7-10. All of the graphs are Test Elements with the type Listener, and they each have this panel.
Figure 7-10.
After restarting JMeter, if you want to reload metrics into a graph from a populated .jtl file, make sure the .jtl file name is specified, set UI focus in this text box, and press Enter
Yes, the screenshots in Figures 7-8 and 7-10 are identical, but only because this is important functionality. Even though the UI plainly says, “Write results to file / Read from file,” most people, including me, have trouble seeing that this box is used to render a graph from a .jtl file.
Note that Run ➤ Clear All (Ctrl+E) will clear out all the results in graphs and most Test Elements in the UI, but it will neither delete nor zero out the .jtl results file. It appends data. You have to manually delete the .jtl file to start from scratch. This can be a pain when you start what you thought was a new test, but you were really appending data to the test you ran yesterday at the same time of day. If you try to render the data in the .jtl to a graph, say a throughput graph, you will see throughput from yesterday’s test on the left, a huge, vacuous 24 hour gap in the middle, followed by today’s throughput on the right. Not what you expected. So, remember to clear out your .jtl files when restarting to avoid this huge gap.
To avoid playing “file system hide-and-seek” to find your output files, I strongly recommend specifying a full path with the Filename input box; Figure 7-7 shown earlier shows how to use a script variable to say which folder the file will land in.
That shows how to write the .jtl files. To read a .jtl file and display the graph, for example when you restart the JMeter UI, you need to load each Listener Test Element one at a time. There is an interesting usability quirk here to get JMeter to read the .jtl file: make sure the .jtl file name is in place. Then put or keep focus on the input box, and press the Enter key. That starts the process to paint the graph from text data in the .jtl file. Alternatively, using the Browse button to select the file will paint the graph based on the .jtl data.
How to Avoid Redundant Copies of Huge Files
The configuration
in Figure 7-11 looks perfectly reasonable to me. It looks like we are trying to create one output file for response time data and one output file for throughput data.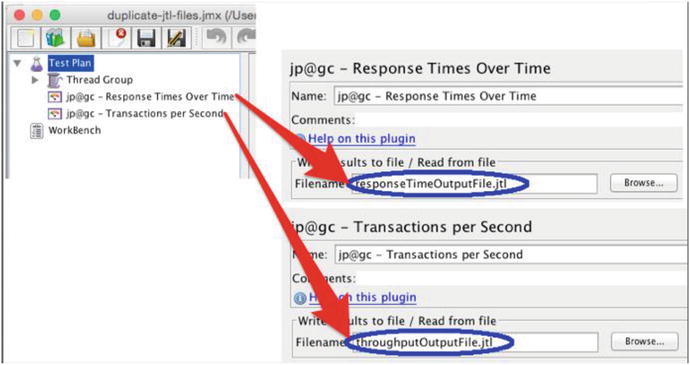
Figure 7-11.
Perfectly reasonable-looking configuration that has very unexpected consequences. On a separate note, the path to the .jtl files is not specified, leaving in question where these files will land on the file system.
It looks like response time
data will land in one file and throughput data will land in a separate file. But, JMeter does not work this way. Instead, it creates two identical output files. This wastes gigabytes of disk space with longer, high-throughput tests. So follow my lead with this: for each JMeter .jmx script, just pick a single one of your Listeners, arbitrarily, and specify the path/name of a .jtl file for just that one. As such, it seems like you could infer a rule that just one Listener (both of the components in Figure 7-1 are Listeners) for the entire .jmx file should be configured with an output file. I will call this the only-one-output-file-per-jmx rule. The rule holds true with other Listeners, ones that I call the “Basic Listeners,” like Active Threads Over Time, Response Time Percentile, Summary Report and others, but there are two exceptions.
The first exception to the only-one-output-file-per-jmx rule is for the PerfMon Listener (which collects CPU consumption and other OS data) and JMXMon Listener
(captures JMX data from a remote system). They are both from jmeter-plugins. Unlike all other Listeners, they each require their own output file. Neither PerfMon nor JMXMon will read data from other Listener’s .jtl files. Likewise, other Listeners will not read data from PerfMon and JMXMon .jtl files.
Here is a summary of how to avoid this confusion of what-data-gets-written-to-where:
- 1.Choose any single Listener in your .jmx, one other than PerfMon and JMXMon, and specify a full path/file name to the .jtl to be written.
- 2.In addition, if you have PerfMon or JMXMon, each should have its own .jtl file .
- 3.If you are running JMeter from the command line (without the user interface), you may specify your .jtl file name with the -l command-line parameter. Keep in mind that any .jtl files specified in your .jmx file will also be written, even if -l is specified. See section 2.4.8 at http://jmeter.apache.org/usermanual/get-started.html ) for documentation of all command-line parameters.
Right-Sizing Output Files for Heavy Debugging or High Throughput
Here is the second exception
to the only-one-output-file-per-jmx rule, and it doubles as a fantastic feature that you need to use to avoid data overload on your load generator. Load generators are highly configurable beasts, and it is easy to misconfigure them to graph, process, calculate, and store so much data, that load generator performance suffers and test results reflect more of the load generator’s problems and less of the SUT’s performance.
However, collecting copious amounts of data (HTTP URL, response codes, input and output XML, cookies, script variables, and so on) is critical for troubleshooting in two different scenarios:
- Debugging a load script, for both errors and successful requests.
- During a load test, troubleshooting errors from the SUT.
JMeter satisfies this use case by allowing you to keep two Basic output files, one in the .csv format and the other in XML. The larger footprint of the XML file, along with its higher CPU consumption, is only used for sampler failures, which will only happen infrequently. In the separate csv-formatted .jtl file, JMeter will keep a smaller and more streamlined but high -volume record of all activity, success or failure.
Here is how you accomplish this:
- 1.In JMETER_HOME/bin/user properties, add the following property to default .jtl files to the csv format, instead of the more CPU-intensive, verbose, and larger XML format:jmeter.save.saveservice.output_format=csv
- 2.Add some other Listener, perhaps a nice jp@gc - Synthesis Report (filtered), which is a more full featured version of the vanilla Summary Report. Specify a .jtl file name (and do not forget to include the path to the .jtl, of course, as I recommended above to avoid protracted hide-and-seek).
- 3.Add a View Results Tree Listener to the load plan tree. Specify a different .jtl file name than the one used in step 2. For me, it is helpful to use the same path for all .jtl files.
- 4.For just this one Listener :
- i)Put a check in the Errors check box. Somewhat confusingly, this tells JMeter to only log errors and avoid the huge overhead of detailed logging for successful Sampler requests. Do not forget this check mark when applying load; we will discuss why in the next section.
- ii)Override the csv file format in the View Results Tree by clicking on the Configure button, as shown in Figure 7-12.
 Figure 7-12.The “Configure” button that allows you to enable/disable XML format of the ouput file
 - iii)To override the csv file format with the XML file format for just this one Listener, put checks in the boxes as shown in Figure 7-13.
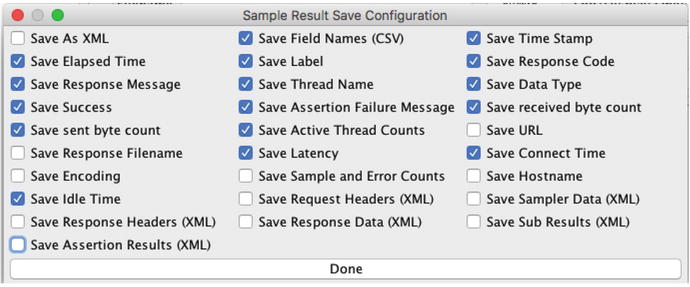 Figure 7-13.The checkboxes required to specify XML format for the output log file
- i)
Recording an HTTP Script
These instructions
show how to record an HTTP script:
Rather than duplicate the instructions, I think it is important to highlight a few key steps in the recording process.
Configuring a .jmx file just right for recording used to be very difficult. Now, there is an easy way to create it: start with .jmx configuration from a JMeter Template.
Choose the File ➤ Templates menu option. Then choose the Recording template in the combo box at the top center. Finally, click Create, as shown in Figure 7-14.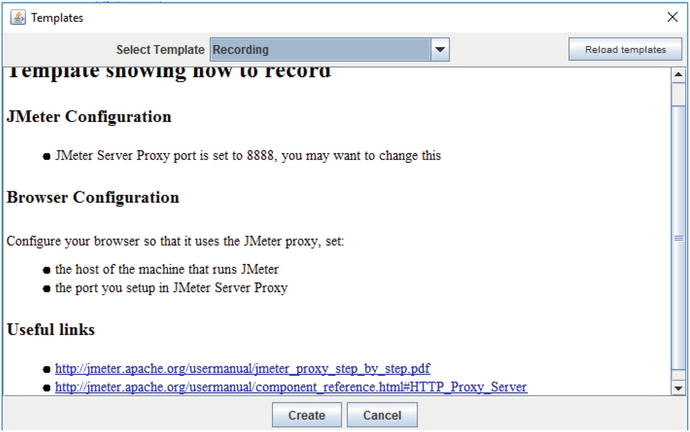
Figure 7-14.
JMeter screen to select a Template that specifies the detailed configuration required to record your browser’s network traffic to a .jmx file.
Once the Recording template
is selected, the JMeter plan tree should look like Figure 7-15.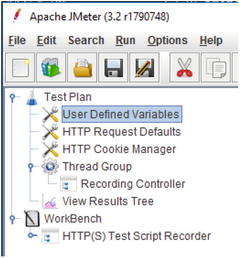
Figure 7-15.
The JMeter Plan Tree after the Recording template has been selected
Figure 7-16 details a critical part
of the process: your browser’s HTTP proxy configuration. With no HTTP proxy configured, your browser makes requests directly to the Internet. With a proxy configured, all requests are forwarded to a specific host (labeled as Address) and port specified as shown.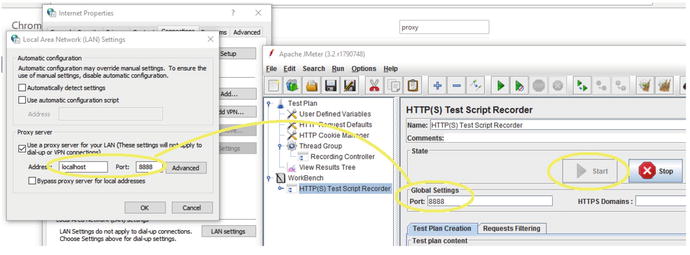
Figure 7-16.
Internet Explorer HTTP proxy configuration and the JMeter HTTP Proxy server. See how IE is configured to make all requests on port 8888 of localhost, and JMeter is configured to listen for all requests on this exact same port? Many JMeter users do not get this configuration correct.
Note that the IE Address input box on the left must point to the local machine and the port number in IE (left) and the port number on the JMeter panel (right) must match. The value in Figure 7-16 is 8888. Also note the JMeter Start button is disabled, meaning that it has already been clicked to start the JMeter HTTP proxy program.
When the IE proxy is correctly configured and you click the big Start button on the HTTP(S) Test Script Recorder, all browser network traffic will be forwarded to the JMeter HTTP proxy, and JMeter proxy will immediately forward all traffic to the SUT. JMeter will record all traffic as you navigate the SUT.
Paste your SUT’s URL
into the browser and start navigating the business processes you want to record. When finished navigating, log out of the SUT and click Stop on the JMeter’s HTTP(S) JMeter Test Script Recorder on the right of Figure 7-16.
JMeter will display all the recorded traffic in the Recording Controller, as shown in Figure 7-17.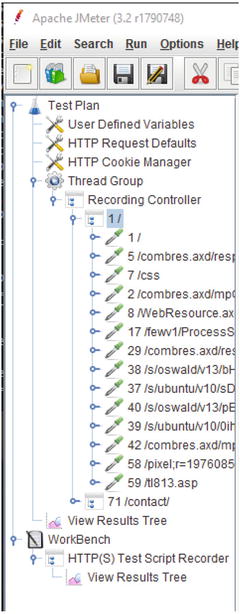
Figure 7-17.
JMeter’s Recording Controller has captured network traffic as a user navigated the SUT in the browser
Debugging an HTTP Recording
Working with XML Schema
validators can be a pain. The validation errors are so cryptic, so not-quite-English. It reminds me of being on a technical support call with the dunce of the English-as-a-second-language (ESL) class.3 But the only thing worse than working with a tightly governed XML Schema is a system without any schema at all, where there are no good rules for right/wrong input.
This is exactly like the load generator’s task of properly assembling the HTTP GET to pass to a web application. What URL parameters are required on the HTTP GET? What kind of web authentication is used? Are CSRF tokens or JSESSIONID required? Any other cookies? What HTML “hidden” variables are pulled from the previous HTML response by the SUT’s browser code and used to build the HTTP GET parameters for a subsequent page? All this uncertainty makes me pine for some kind of tightly governed schema that would plainly spell out the requirements
. In fact, answering any of these questions wrong generally results in an incomplete HTML response and/or an exception on the server side, and getting this kind of an error is a likely sign that your .jmx load script is broken—perhaps out of sync with SUT requirements.
One way of dealing with this uncertainty is to keep a backup of the verbose HTTP log of the initial recording, along with the initially recorded load script itself. This creates a tidy little vault of all the required data items; it isn’t a schema, but it is close enough. But then load script maintenance happens. Bugs are easily introduced later on when enhancing the script as detailed in Chapter 4. Remember? These are the changes required to make your load resemble the actual production load.
When a load script bug shows, you can find whether you have all the required data items by performing a detailed text file “diff” between the original verbose HTTP log and the one from the test run with the bug. The following JMeter instructions show how to capture those verbose HTTP logs.
When you look at the differences between those logs, you most often find that you did not fully understand the HTTP GET requirements (two paragraphs above). Alternatively, perhaps you have deployed a different version of the SUT with different requirements for an HTTP GET.
To repeat, the “diff” you will need to perform is between two different logs: one of the HTTP recording of the business process and the other from playing back the script. I use the JMeter View Results Tree to create these logs. The one for the recording must be under the Workbench (see Figure 7-18). The one for the playback must be configured to record in XML format like the first one, but instead it must be an immediate child of Test Plan, with a different output file name (obviously). You can use the JMeter copy/paste to copy the one created in the Workbench (as in the following instructions) to the Test Plan.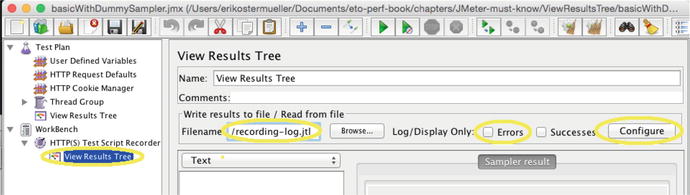
Figure 7-18.
The JMeter Recording template (File ➤ Templates ➤ Recording ➤ Create) used to record full request/response and other detail of the HTTP recording process
To capture that very detailed log of the HTTP recording, do the following:
- 1.Start a new test plan for recording: File ➤ Templates ➤ Recording ➤ Create.
- 2.Select the View Results Tree that is a grandchild of the WorkBench, as shown in Figure 7-18.
- 3.Specify the path/file for the log to be created.
- 4.Make sure there is no checkmark in the Errors checkbox. This will insure that everything gets recorded.
- 5.Click the Configure button and set the check marks as shown in Figure 7-13 earlier.
- 6.Start the recording , as shown in the JMeter doc: ( http://jmeter.apache.org/usermanual/jmeter_proxy_step_by_step.pdf ).
Load Testing Java Directly and Debugging
Once upon a time I was load-testing
the reporting section of a loan system. When a user requested a small 1K report, it had to be extracted from specific byte offset into a single multi-megabyte file that was periodically downloaded from a back-end system. Response time under load for this component got as slow as 5 seconds; server-side concurrency was about five threads.
Unfortunately, the system was down for database maintenance, so the environment wasn’t available for further investigation. I didn’t have access to the source code, so I decompiled the source code (using jad.exe) to have a look. The code used java.io.FileInputStream to read() through the file one segment of bytes at a time, which provides no option to skip any bytes or jump to a particular location in the file. So if my 1K report was located at the end of the 10MB bundled report, the code would have to read through 9+ MB of data that was discarded. What a waste! By the way, this is an example of the Main Anti-Pattern 3—Overprocessing.
So I needed to test my new implementation of the code, which used the java.io.RandomAccessFile to “seek” directly to the specified offset and return the 1K report. When I ran my test 100 times in a row from a single thread, the new implementation was faster. But I had to convince my boss that response time at five threads of load would be better than the 5 seconds seen previously.
I knew how to launch my code five separate threads, but I thought collecting the results from those separate threads would take too much time to code, and then I’d have to graph the data somehow. So instead of launching the five threads myself, I had JMeter
do it for me.
In hindsight, I also could have used jmh, which comes with the JDK:
The following shows how I got JMeter to launch five threads, all running my RandomAccessFile implementation of the reporting code; it took about 15 minutes to figure it all out. I actually ended up with JMeter graphs that compared the performance of both implementations, and the RandomAccessFile approach was tons faster—about 100-400ms for 5 threads of load, zero think time.
- 1.Put the code that you want to performance test into a new class that implements org.apache.jmeter.protocol.java.sampler.JavaSamplerClient . Extending one of these classes could be helpful too: org.apache.jmeter.protocol.java.sampler.AbstractJavaSamplerClientorg.apache.jmeter.protocol.java.test.JavaTest
- 2.Create a new jar file with your class and dependent class files in it, although there is no need to package files in the JMeter package space.
- 3.Add your .jar file and any dependent third-party jar files in the JMETER_HOME/lib/ext folder.
- 4.Create a new JMeter .jmx plan. Add a Thread Group and configure the five threads of load.
- 5.As a child of that Thread Group, add a new Java Request Sampler:
- 6.Restart JMeter.
- 7.Select the Java Request Sampler. In the Classname combo box, select the class name you coded in step 1.
- 8.To enabled debugging, add the following environment variable before launching jmeter.sh or jmeter.cmd:JVM_ARGS=-agentlib:jdwp=transport=dt_socket,server=y,address=8000
- 9.In Eclipse, start a remote debugging session listening on port 8000. Set breakpoints in your source and then launch the JMeter script from the JMeter menu (Run ➤ Start) to trigger the breakpoint .
JMeter Sandbox
The JMeter .jmx file
for this section and the next section is located in the jpt repo in this location:
sampleJMeterScripts/jpt_ch07_sandbox.jmx
Are you a little hesitant about mastering the art of load generation? You should be—it takes work. But fortunately, learning JMeter is easier than other load generators, because you can test just about every Test Element in its own little sandbox without the complexity of your SUT. So turn off the Wi-Fi (don’t do that) and let’s get started:
With this little sandbox technique, you can:
- 1.Create graphs with lots of live-looking squiggly lines, even ones with different metrics (like response time and throughput) on the same graph.
- 2.Process text, like creating an “output-input” script variable, that ever-so-important technique I mentioned in Chapter 4 on load scripting priorities.
- 3.Read data from a .csv file into JMeter script variables.
- 4.Control script flow using “If-then” logic or perhaps repeating a few steps with a Logic Controller.
- 5.…much, much more.
Once we cover items 1 and 2 from this list of sandbox tests, you will be primed and ready to play (yes play) with 3, 4, and 5 for homework. It is just plain fun. Here is how the sandbox works: close out any script you’re working on and add a Thread Group and a child
jp@gc - Dummy Sampler
(
https://jmeter-plugins.org/wiki/DummySampler/
). Here are the steps:
- 1.Right-click on the Test Plan and choose Add ➤ Threads (Users) ➤ Thread Group.
- 2.Configure test duration .
- 3.Check Forever to keep the test running indefinitely (Run ➤ Shutdown, or Ctrl/Cmd+Comma to stop the test).

- 4.Or leave Forever unchecked and put a 1 in the adjacent text box to run the Dummy Sampler just one time—used to run your script just one time, as when testing/debugging.
- 5.In the tree on the left side of the screen, right-click on the new Thread Group and select Add ➤ Sampler ➤ jp@gc - Dummy Sampler.
- 6.Select the newly added Dummy Sampler and duplicate it using the hotkey Ctrl+Shift+C.
- 7.See how I added - 01 and - 02 to the sampler names? The JMeter tree is on the left side of the screen. Look on the right side for the Name input box (above the word Comments). You can add the - 01 or - 02 to change the name here.
This will leave you with the screen shown in Figure 7-19.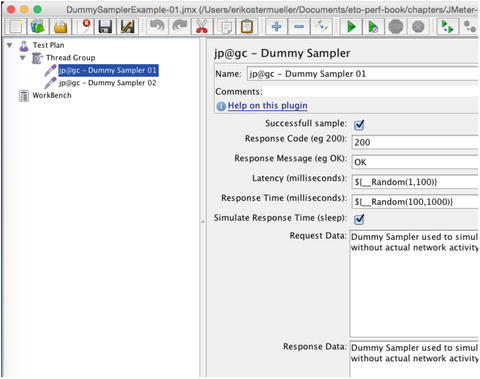
Figure 7-19.
The Basic Sandbox. This is the foundation of JMeter’s sandbox play environment. Note the default values for Latency and Response Time. These variables that resolve to random numbers add a little interest when taking a graph for a test drive
.
JMeter Sandbox with One Graph
The JMeter .jmx file
for this section is the same file used in the previous section:
sampleJMeterScripts/jpt_ch07_sandbox.jmx
With the sandbox foundation in place, just add one of the dozens of Test Elements you want to play with! In Figure 7-20, I added jp@gc Response Times Over Time (
https://jmeter-plugins.org/wiki/ResponseTimesOverTime/
)and started the test (Ctrl+R or Cmd+R) and voila, live-looking graphs. Use Ctrl+Comma or Cmd+Comma to stop.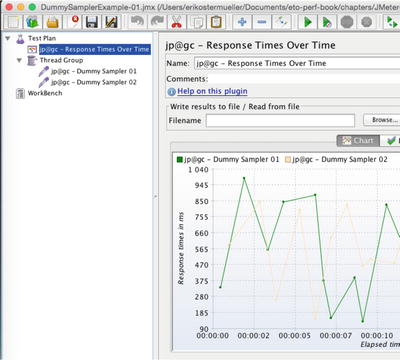
Figure 7-20.
Using the JMeter sandbox to get a quick demonstration
of a graph
JMeter Sandbox / Multiple Metrics on Same Graph
This section shows
how to put two or more metrics on a single JMeterPlugins graph.
To see this in action yourself, look in the jpt repository for this .jmx file. Open it in JMeter:
sampleJMeterScripts/jpt_ch07_multipleMetricsOnOneGraph.jmx
Of course taking guesses, educated ones, is a key part of performance troubleshooting. But if a guess cannot be supported by data, we all need to be big enough to fall on our swords and verbally disown the unproven assertion. In fact, in Chapter 3 I called metrics the antidote to guesswork. So, I think developers need to hone their skills a little bit at finding, collecting and efficiently presenting performance data so we can substantiate more of our guesses or cleanly divorce them.
To see the impact of one metric on another, I think it’s important to put two different metrics on the exact same graph. In Chapter 6, on the Scalability Yardstick, I showed you one example of that. Remember that we had to check to see how many thread of load were required to push the SUT CPU to 25%? The two metrics were CPU and count of JMeter threads of load. In this case, the increase in threads of load impacted two other metrics: both CPU and throughput were impacted—they both increased.
Actually, my favorite four metrics for a single start are CPU, response time, throughput, and load generator thread count.
To help you get up-to-speed on displaying graphs like this yourself, Figure 7-21 shows my test plan, still using the jp@gc - Dummy Sampler sandbox, to put two metrics on the same graph: jp@gc - Response Times Over Time and jp@gc - Transactions per Second
.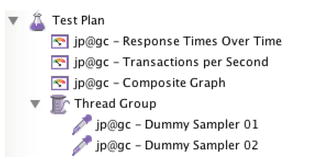
Figure 7-21.
The test plan required to get multiple lines of the same graph
Once you have added them to your load plan tree as shown in Figure 7-21, you need to tell the new jp@gc - Composite Graph which metrics to display. So I selected the jp@gc - Composite Graph and clicked the Graphs tab. Whoops, but there was nothing there, as shown in Figure 7-22.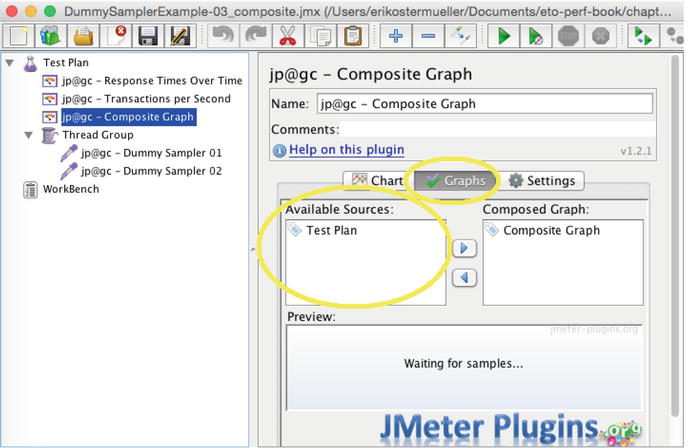
Figure 7-22.
A usability quirk: The Available Sources box is not populated with the metrics I want to display in the graph. See Figure 7-23 for a solution.
To fix this little problem
, you just need to run the test for a few seconds and stop the test. This will populate the Available Sources box so you can select the metrics you want to see (Figure 7-23).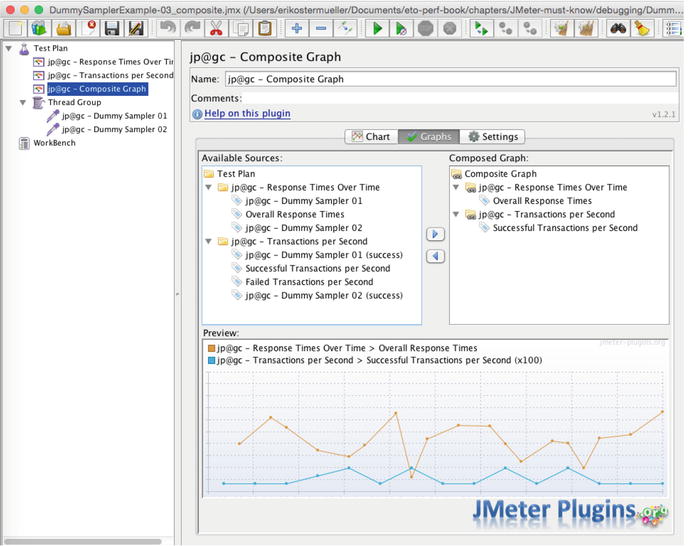
Figure 7-23.
Solution to the problem in Figure 7-22. To get your metric selections to show up in the Available Sources box, just run the test. Then stop the test and double-click your selections in Available Sources to move them into the Composite Graph section.
Once the Available Sources box is populated, you can double-click the metrics you want to move to the Composed Graph box
.
JMeter Sandbox for Testing Correlation Variables
The JMeter .jmx files
for the next two examples are located in the jpt repo in this location:
sampleJMeterScripts/ folder for jpt_ch07_correlationVariables.jmx
In Chapter 4, I showed a number of circumstances where the load generator script has to step in and do small data movement chores that in a live situation are done by your SUT’s JavaScript in the browser. But in that chapter, I tried to show everything in a load-generator–agnostic way. This section jumps into the JMeter specifics on how to implement this.
Sometimes with the right SUT functionality, a unique ID generated on the server SUT gets recorded into your load script. Adding the right script variable, one that I’m calling an “Output-Input” variable, will retrieve the freshly generated value, instead of relying on the single, static value that was initially recorded into the script. That way, the generated ID can be submitted somehow (you have to figure that part out) in a subsequent request, perhaps as a query parameter or somewhere in the body of an HTTP post.
But before sticking a generated ID like this into a script variable, your JMeter script first has to find that particular ID from its location embedded hopefully a predictable place
in lots of text in the output HTML stream.
Fishing Expedition—Step One, Find the Data Item
Two popular ways of finding a data item in the output HTML are with a regular expression or an XPath expression. Choose whichever way you feel most comfortable with, but here is a regular expression example.
Step One is simply to perfect the regular expression to find your data item in the XML or HTML.
Using the JMeter sandbox approach, start by creating a little sandbox test plan like the one shown in Figure 7-24. The goal is to simply embed the HTML that you expect your SUT to return into the Dummy Sampler and then use JMeter to play around with various regular expressions to identify the one that will correctly identify the data.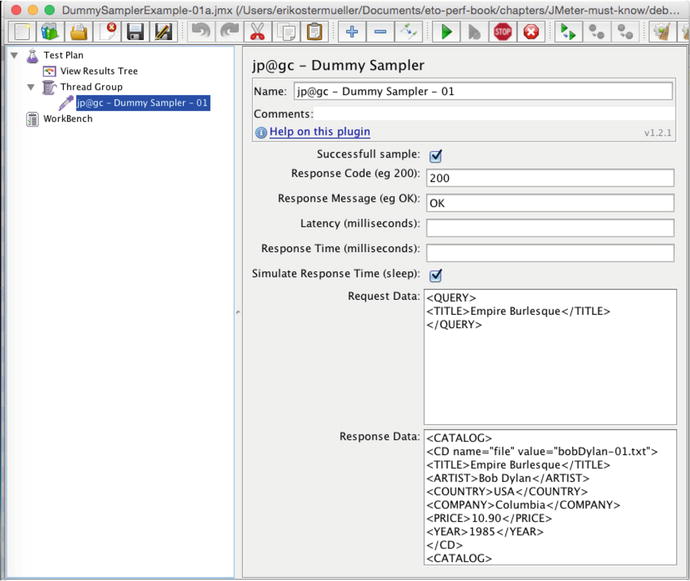
Figure 7-24.
Simple JMeter sandbox plan that returns some hard-coded XML (starting with <CATALOG>) that contains the text to be placed into the Output-Input variable.
Here is our goal: to find the regular expression that will locate the following text:
The bobDylan-01.txt is the value we want to place in the Output-Input script variable. |
<CD name="file" value="bobDylan-01.txt">
|
This regular expression used to identify bobDylan-01.txt |
name="file" value="(.+?)">
|
Before running this test
,
- 1.Make sure the Thread Group is configured to execute the Dummy Sampler one time (hint—make sure the Forever box is unchecked); you don’t need 5235 executions to debug this—you need just one.
- 2.In the View Results Tree (Figure 7-25), make sure the Errors and Successes boxes are unchecked. (Learn more about these checkboxes here: http://jmeter.apache.org/usermanual/component_reference.html#View_Results_Tree .) This will make sure none of the results are hidden or filtered out.
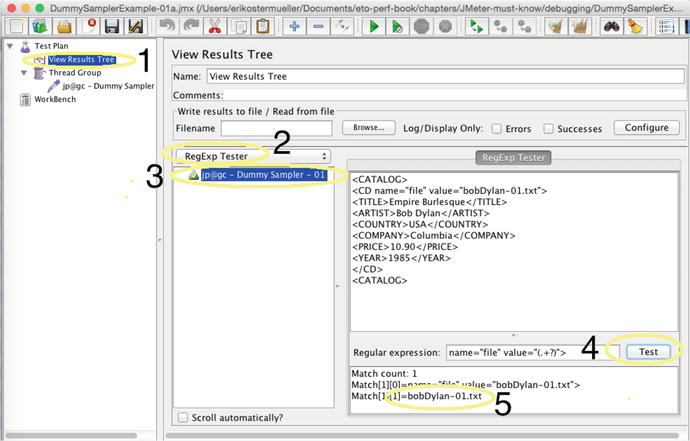 Figure 7-25.JMeter View Results Tree ( http://jmeter.apache.org/usermanual/component_reference.html#View_Results_Tree)—use this to test whether your regular expression works.
Run the test (Run ➤ Start or Cmd/Ctrl+R) just once. Each bulleted number below corresponds to the number in Figure 7-25.
- 1.Click on the View Results Tree to see the result of the single Dummy Sampler execution.
- 2.Change the combo box to RegExp Tester from the default value of Text. This basically reconfigures the UI so we can test the hard coded XML result against the regular expression .
- 3.Do you see the green triangle with the check mark inside it, next to jp@gc - Dummy Sampler - 01 ? Select this—it is the result of the single run of the Dummy Sampler.
- 4.Finally, we get down to business. Type in the value of the regular expression you want to test, and then click the Test button.
- 5.This shows that our regular expression worked, because it isolated bobDylan-01.txt from the rest of the XML .
Fishing Expedition—Step Two
Now it is time to put your perfected XPath or RegEx expression into place. Right-click jp@gc - Dummy Sampler (or the real HTTP Request that will produce the HTML or XML responses that you are fishing through). Choose Add ➤ Post Processor ➤ RegEx Extractor (or XPath Extractor). The JMeter doc for the Extractor you’re using will also show you how to specify the name of the JMeter script variable the fished out value should be stored in. Your JMeter test plan should look like Figure 7-26.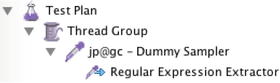
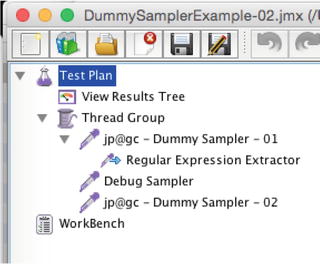
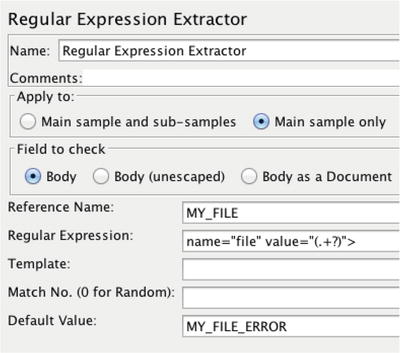
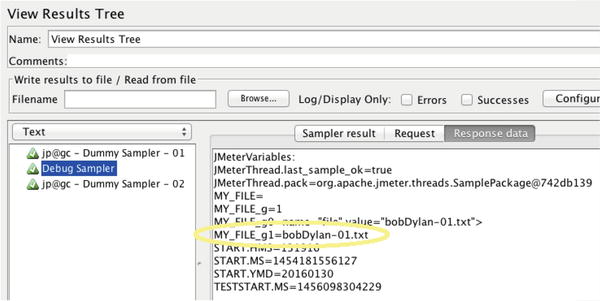
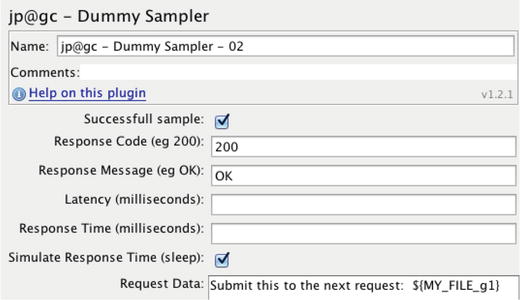
Figure 7-26.
When creating an Correlation variable in JMeter in the sandbox, the load plan tree should look like this
Figure 7-27.
The JMeter Debug Sampler and jp@gc—Dummy Samplers have very similar names. The Debug Sampler acts as a simple request to show all JMeter variables in the View Results Tree, as shown in Figure 7-29.
Figure 7-28.
The JMeter Regular Expression Extractor. The Regular Expression field is used to search the HTTP response
for a string of text used in a Correlation Variable.
Figure 7-29.
This View Results Tree output shows how the Debug Sampler has dumped the values of all JMeter variables for debugging purposes
Figure 7-30.
The Request Data field at the bottom of this figure simulates POST data for an HTTP Requst. The ${MY_FILE_g1} variable is a Correlation Variable being passed back into the SUT
.
When this runs, JMeter will attempt to find the value your looking for. It will then place that value into a script variable. To see whether JMeter has done this as you were expecting, you need to add a Debug Sampler as shown in Figure 7-27. The actual debug information will show up in the View Results Tree at the top of Figure 7-27.
Figure 7-28 shows how to specify exactly what you want to find from the HTTP response. It is helpful to choose a default value that will indicate when something has likely gone wrong.
To find the debug information to troubleshoot problems with the correlation variable, click on the View Results Tree on the test plan (left side of the screen) and select the Debug Sampler as shown in Figure 7-29.
Finally, it is time to use the variable extracted from the response of the previous Sampler. Note in Figure 7-30 how the variable name (MY_FILE_g1) is wraped in curly braces. The “dollar curly” syntax is used to evaluate the variable.
Prerequisites
To conclude this chapter, I’ll present a to-do list of things you should know how to do:
- Record a JMeter load script. During the recording, save every last byte to a log file for future reference .
- Flag a logon script as “run once.”
- Run JMeter headlessly.
- Debug JMeter load script.
- Configure load script to use data from a .csv data file. The file should contain a list of users to log on, lists of accounts and customers to query.
- Create assertions to validate that something actually happened, that your SUT is actually doing its job.
- Using a correlation variable, capture the output of one request and submit to the input of another.
- Create ramp up, ramp down load plans.
- Create a load plan that distributes load by the percentages of business processes see in production.
- Create and use JMeter variables, perhaps reading a variable from the command line.
Load gen features:
- Use multiple network protocols: HTTP/S, JMS, Sockets, JDBC.
- Run headless; also, run from the same machine as the SUT.
- Use JMeter’s nice copy/paste .
Graphing features:
- Composite graphs
- CPU/Resource Consumption
- JMX
- Grafana/InfluxDB integration
Must know:
- Avoid heavy logging.
- .jtl files
- Reading
- Writing
- How many output files? 1, 2 or 3
- Merging
- Clearing UI results does not clear data file.
- Use JDBC sampler for data creation.
- Save the initial Recording using View Results Tree.
- Managing colors.
- Maven, ANT, Jenkins integration.
- Thread groups: separate samplers (SOA), or combined (Web).
- Debugging tips:
- Use a Dummy Sampler to specify sample HTML responses, before hooking your test plan up to a live HTTP system.BSF PostProcessor:var myVariable = vars.get("MY_VARIABLE");OUT.println('The value of MY_VARIABLE is [' + myVariable + ']' )
- Assertions. Configure an Assertion to raise a red flag when text from an error is present.
- Where to stick the Listeners .
Don’t Forget
This chapter provided a tour of some JMeter functionality that is rarely if ever documented, and other functionality that is documented but still causes trouble for the many technicians that I have taught JMeter to.
Don’t forget that if you can’t figure out how to get some JMeter feature to work, create a little “Hello World” sandbox-like .jmx script to experiment with the feature. Copy and paste a snippet of HTML (or json or XML or whatever) into the Dummy Sampler so that your test plan can operate on it. Just about every single JMeter Test Element can be tested like this. You can experiment with logging, load plans, Correlation Variables, JMeter Assertions, Composite Graphs (multiple metrics on the same graph), you name it.
What’s Next
The next chapter provides an overview of the two sample applications that come with this book. These applications reproduce the write-once-run-anywhere (WORA) performance defects that are detectable in both large environments and small ones. These examples will give you hands-on experiences hooking up plug-it-in-now performance and observability tools, where available, that will help you find and fix performance defects quickly.
Footnotes
3
I was never the dunce of an ESL class myself, but I did flunk out of the Russian language program at the University of Kansas before going on to get my computer degree.